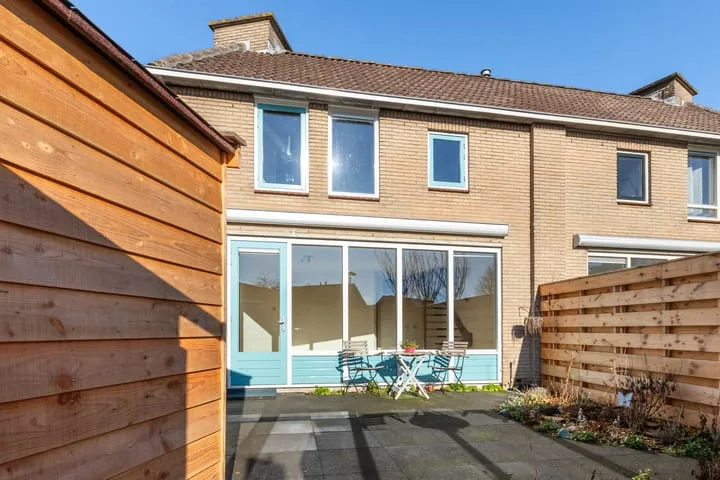
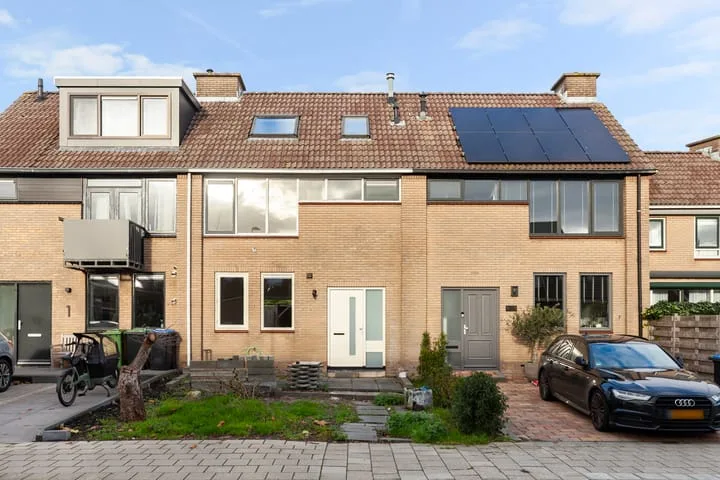
- Sold
Melde 23
2811WC Reeuwijk
€ 550.000 k.k.
€ 4.700/m²
- Living area
- 117 m²
- Land area
- 162 m²
- Bedrooms
- 3
Searching in 134 houses in Reeuwijk
Type to search. Use arrow down and arrow up to navigate through results and press Enter to open.
Hidden search suggestions.
View current properties in Reeuwijk or search targeted on street, postal code and property characteristics.
View the current housing stock in Reeuwijk and quickly filter by price, living area, rooms and more. There are currently 134 houses in this place within our selection. View also 80 sold houses in Reeuwijk for extra insight into the local housing market.
2811WC Reeuwijk
€ 550.000 k.k.
€ 4.700/m²
2811VZ Reeuwijk
€ 495.000 k.k.
€ 4.381/m²
2811KT Reeuwijk
€ 425.000 k.k.
€ 4.427/m²
2811TK Reeuwijk
€ 590.000 k.k.
€ 4.244/m²
2811RE Reeuwijk
€ 369.000 k.k.
€ 5.676/m²
2811JG Reeuwijk
€ 400.000 k.k.
€ 3.604/m²
2811BV Reeuwijk
€ 365.000 k.k.
€ 4.244/m²
2811KS Reeuwijk
€ 360.000 k.k.
€ 3.711/m²
2811GX Reeuwijk
€ 590.000 k.k.
€ 4.436/m²
2811GS Reeuwijk
€ 535.000 k.k.
€ 4.280/m²
2811KA Reeuwijk
€ 1.000.000 k.k.
€ 5.587/m²
2811LJ Reeuwijk
€ 669.000 k.k.
€ 4.155/m²
2811GX Reeuwijk
€ 450.000 k.k.
€ 4.787/m²
2811VR Reeuwijk
€ 425.000 k.k.
€ 4.569/m²
2811PT Reeuwijk
€ 635.000 k.k.
€ 3.691/m²
2811KN Reeuwijk
€ 350.000 k.k.
€ 4.794/m²
2811SJ Reeuwijk
€ 300.000 k.k.
€ 4.411/m²
2811ES Reeuwijk
Price upon request
2811BB Reeuwijk
Price upon request
2811BP Reeuwijk
€ 550.000 k.k.
€ 4.741/m²
2811DS Reeuwijk
€ 590.000 k.k.
€ 5.175/m²
2811PK Reeuwijk
€ 450.000 k.k.
€ 5.769/m²
2811KN Reeuwijk
€ 359.000 k.k.
€ 4.917/m²
2811RK Reeuwijk
Price upon request
2811BL Reeuwijk
€ 995.000 k.k.
€ 4.044/m²
2811VG Reeuwijk
€ 450.000 k.k.
€ 3.947/m²
2811SP Reeuwijk
€ 920.000 k.k.
€ 4.259/m²
2811JC Reeuwijk
€ 600.000 k.k.
€ 4.724/m²
Get free quotes from real estate agents with local market knowledge. Compare more than 54 real estate agents in Reeuwijk.
Selling a home in Reeuwijk? View the sales-oriented guide sell a house in Reeuwijk, compare all real estate agents in Reeuwijk or view the top 10 real estate agents in Reeuwijk for extra context to your choice.
Real estate agents make sharper offers when they know you're comparing — ask for quotes for sale or purchase.
Practical answers about housing supply, sales and comparing real estate agents in Reeuwijk.
The costs of a real estate agent in Reeuwijk depend on commission, setup costs, property presentation and the chosen service. Compare the 54 real estate agents in Reeuwijk via the real estate agent page and request multiple quotes to compare rates and approach well.
Within our selection, we are currently showing 134 houses in Reeuwijk. View also the sold houses in Reeuwijk to compare the current offering with recent transactions.
Take into account not only price and living area but also maintenance, energy label, location, outdoor space and sales status. This way you compare houses in Reeuwijk on more than just the asking price.
A local real estate agent knows the neighborhoods, recent transactions and demand in Reeuwijk. By comparing 54 real estate agents in the region you get a better insight into prices, sales strategy and expected yield; the top 10 in Reeuwijk provides a useful starting point.
Yes, when making a sales plan, a valuation in Reeuwijk is wise. You gain insight into a realistic asking price and can then compare offers from real estate agents specifically.
View current location data on residents, WOZ development, housing stock, energy consumption, business activity and safety in Reeuwijk. In 2025 were there 11.285 residents. The average WOZ value in 2025 is EUR 560.971.
These figures help to better assess and compare the housing stock in Reeuwijk with recent sold homes. Orient yourself then on suitable top real estate agents in Reeuwijk for sales advice in this region.
Residents
11.285
Last year: 2025
Average WOZ
EUR 560.971
Last year: 2025
Average income per person.
EUR 32.326
Source: AllNumbers
Crimes (current year)
505
Total registered
| Year | Residents |
|---|---|
| 2021 | 10.555 |
| 2022 | 10.635 |
| 2023 | 10.980 |
| 2024 | 11.130 |
| 2025 | 11.285 |
| Year | Average WOZ |
|---|---|
| 2021 | EUR 420.361 |
| 2022 | EUR 454.211 |
| 2023 | EUR 514.279 |
| 2024 | EUR 536.561 |
| 2025 | EUR 560.971 |
Hoger
2.930
Praktisch
1.990
Middelbaar
3.170
Europa
1.015
Nederland
9.175
Buiten Europa
1.085
Label A
1.712
Label C
1.233
Label B
653
Label D
537
Label G
321
Label E
269
Label F
229
Label A+++
129
Label A+
61
Label A++
42
Label A++++
20
Label A+++++
1
| Year | Gas (m3) | Electricity (kWh) |
|---|---|---|
| 2020 | 1.330 | 3.168 |
| 2021 | 1.507 | 3.293 |
| 2022 | 1.114 | 3.067 |
| 2023 | 935 | 2.928 |
| 2024 | 915 | 3.001 |
Hoekwoning
Gas: 948 • Electricity: 2.970
Huurwoning
Gas: 740 • Electricity: 2.113
Koopwoning
Gas: 1.023 • Electricity: 3.231
Appartement
Gas: 656 • Electricity: 2.002
Tussenwoning
Gas: 827 • Electricity: 2.568
Vrijstaande woning
Gas: 1.307 • Electricity: 4.197
Twee-onder-één-kap woning
Gas: 1.114 • Electricity: 3.216
Total number of company establishments: 2.000
| Period | Crimes |
|---|---|
| jan 2025 | 46 |
| jan 2026 | 35 |
| jul 2025 | 41 |
| jun 2025 | 43 |
| mei 2025 | 47 |
| mrt 2025 | 33 |
| nov 2024 | 55 |
| nov 2025 | 66 |
| okt 2024 | 39 |
| okt 2025 | 39 |
| sep 2024 | 57 |
| sep 2025 | 27 |
These figures give an indicative picture of safety trends in the living environment of Reeuwijk.
Short answers based on current local statistics, handy for a quick comparison of the living environment.
Reeuwijk telt in 2025 ongeveer 11.285 inwoners.
De gemiddelde WOZ-waarde in Reeuwijk is in 2025 circa € 560.971.
Het gemiddelde inkomen per inwoner in Reeuwijk ligt rond € 32.326 per jaar.
Voor het huidige jaar gaat het om ongeveer 505 geregistreerde misdrijven. Gebruik deze cijfers als indicatie en vergelijk trends per periode.
In Reeuwijk komt vooral "Tussenwoningen" veel voor, met ongeveer 1.779 woningen.