Residents
5.905
Last year: 2026
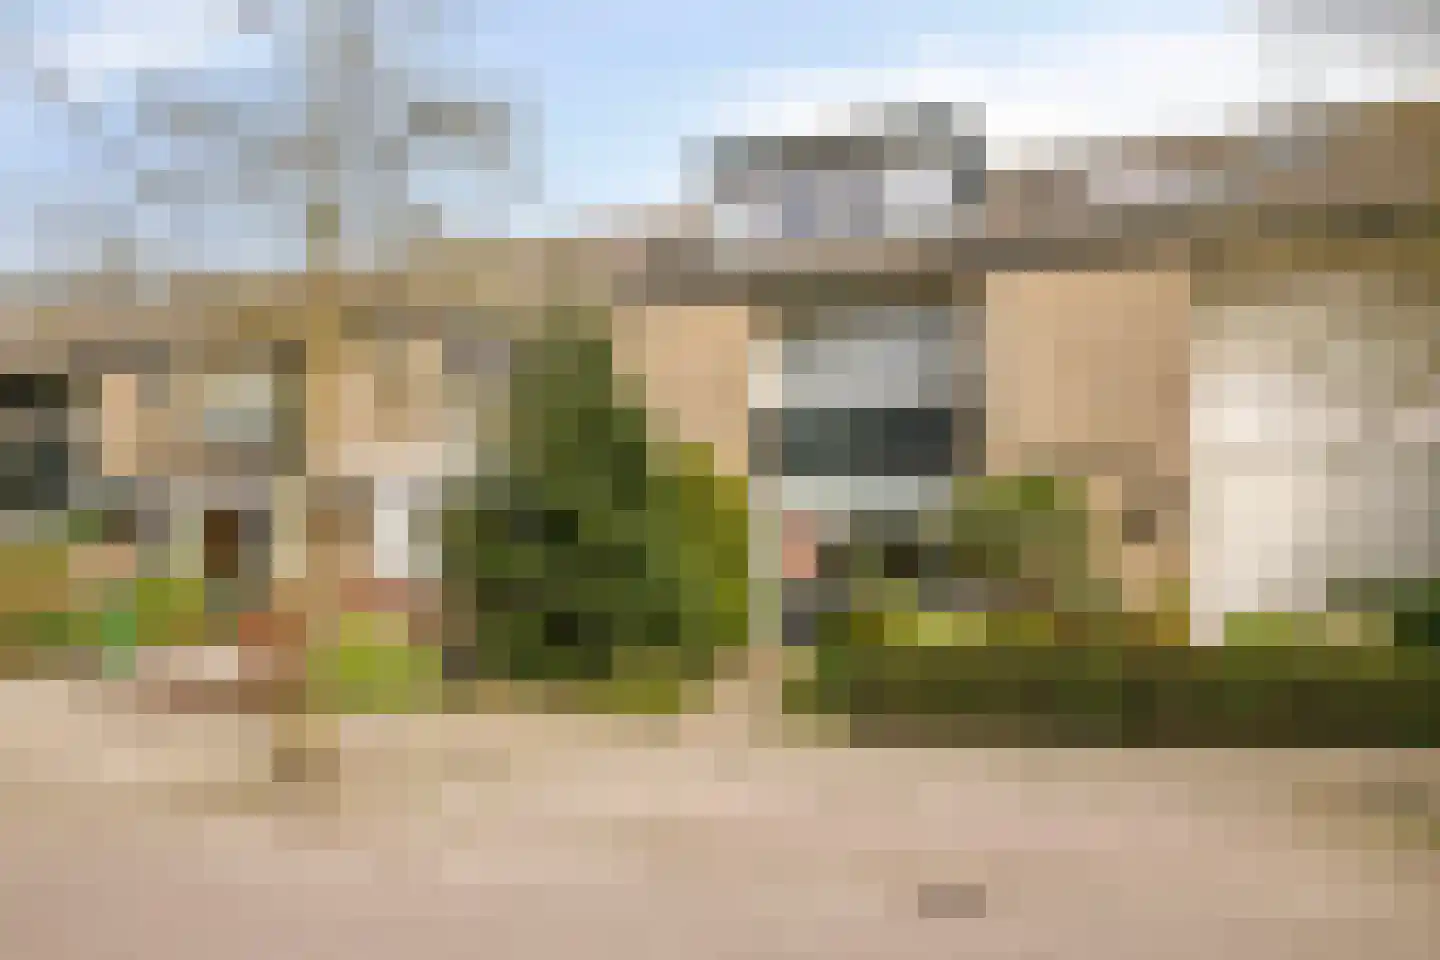
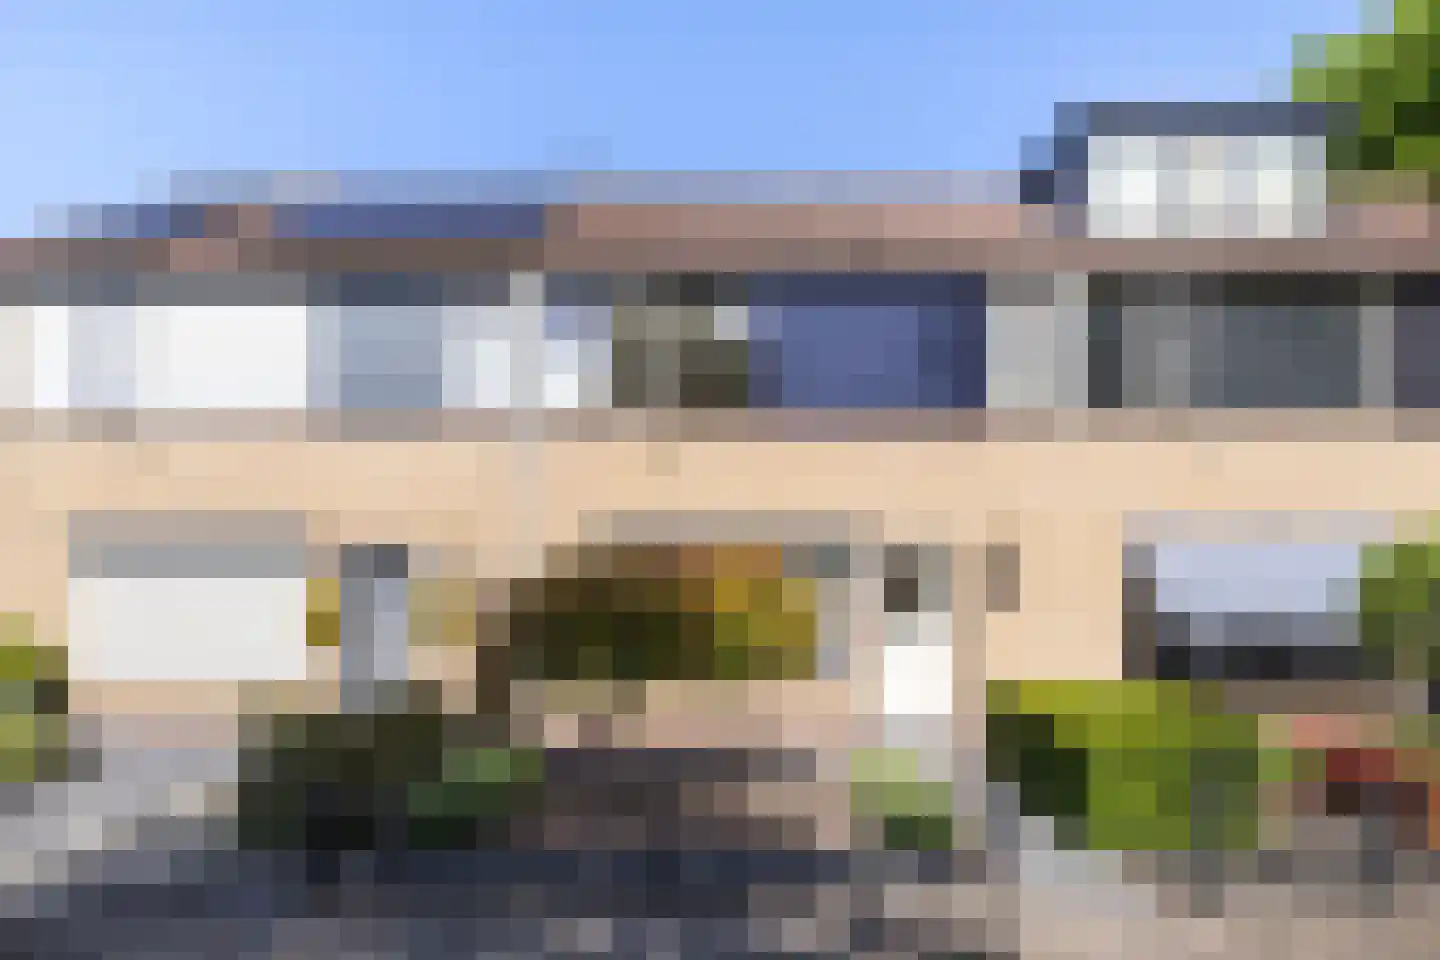
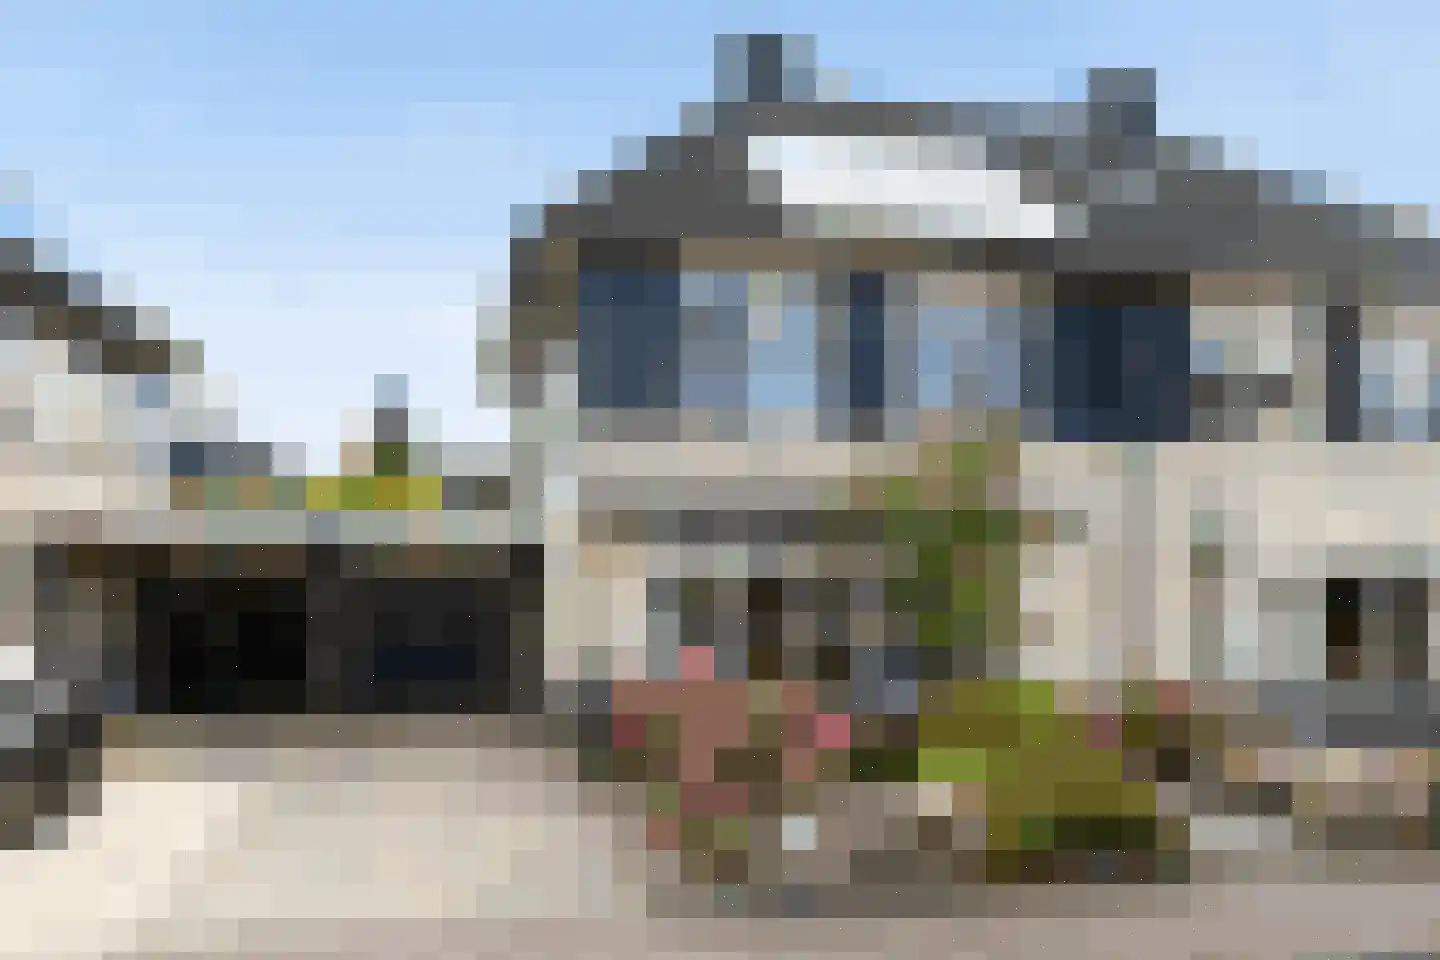
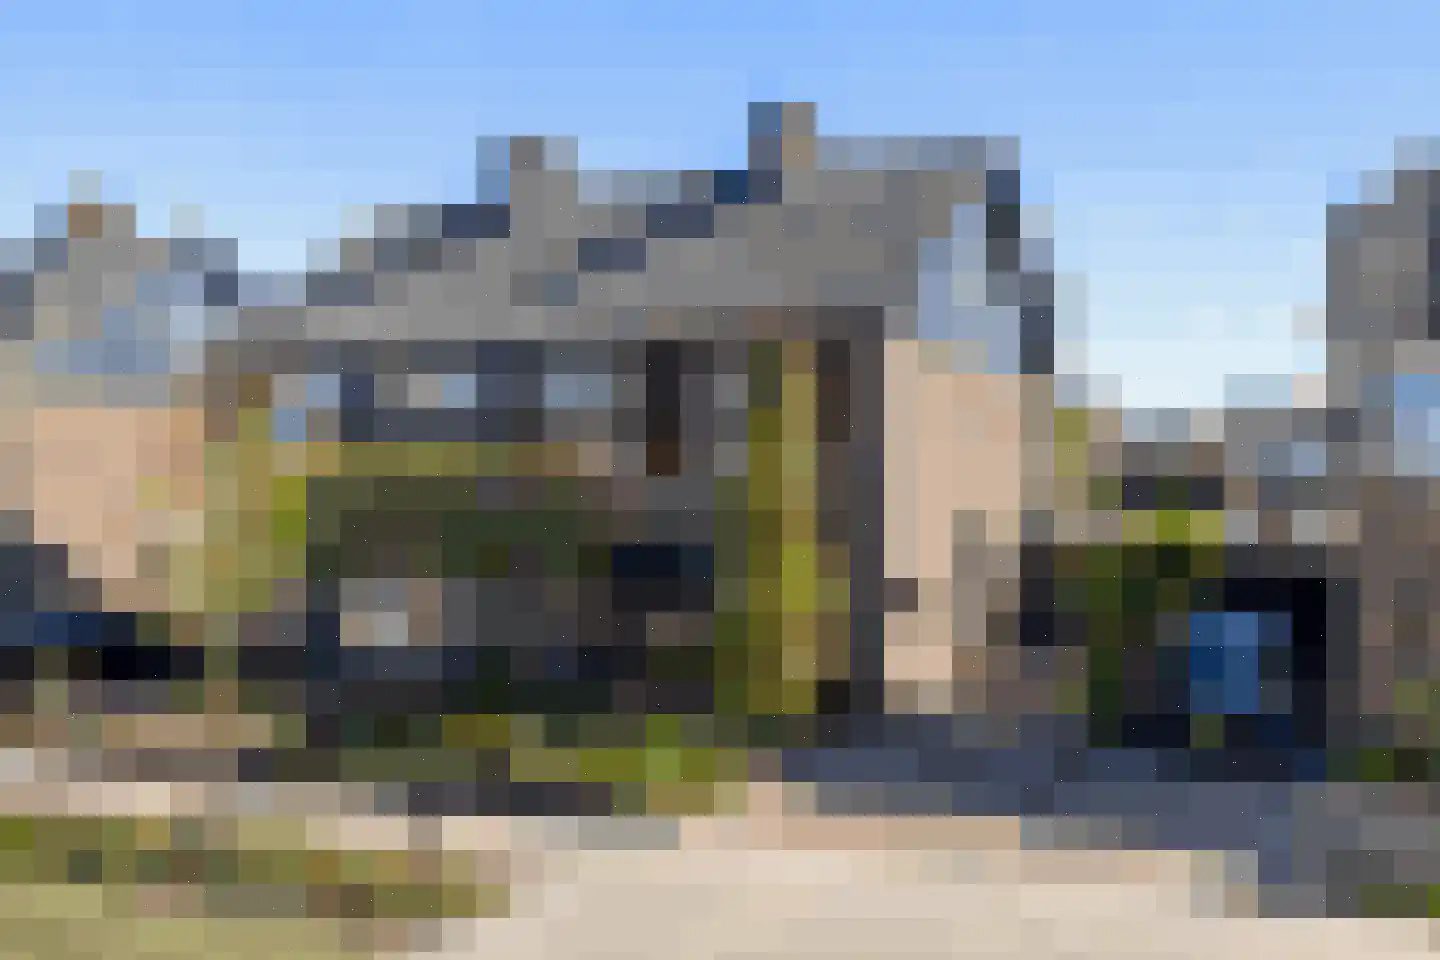
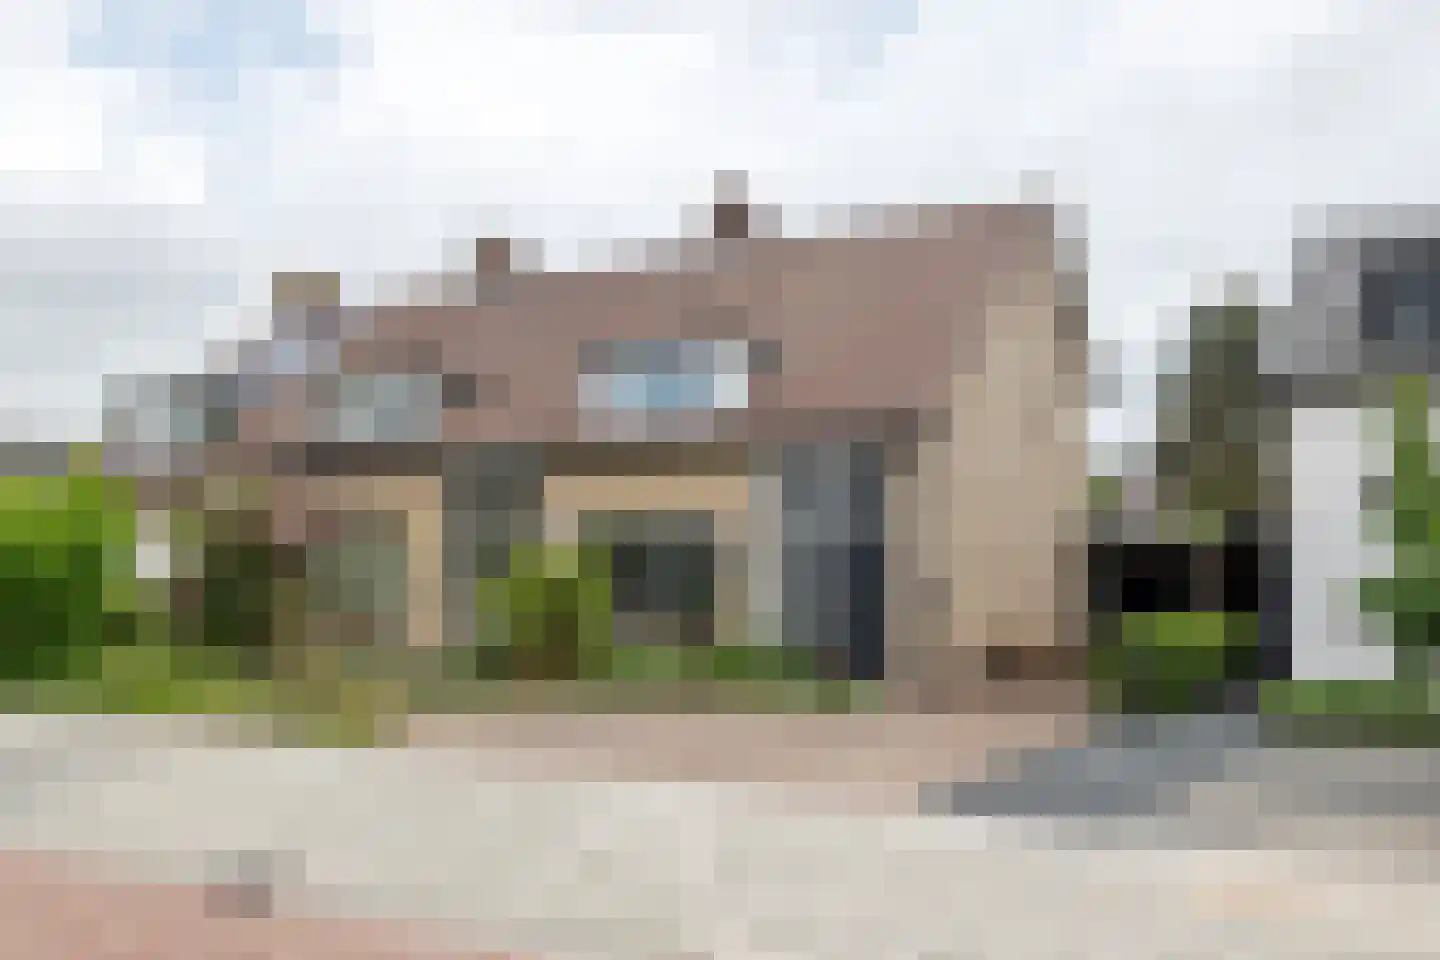
3927DC Renswoude • Utrecht
€ 439.000 k.k.
Cost of copper (estimated): € 10.630
2% transfer tax (€ 8.780) + notary (€ 1.150) + valuation (€ 700)
Total incl. VAT: € 449.630
Purchase price /m²: € 3.430
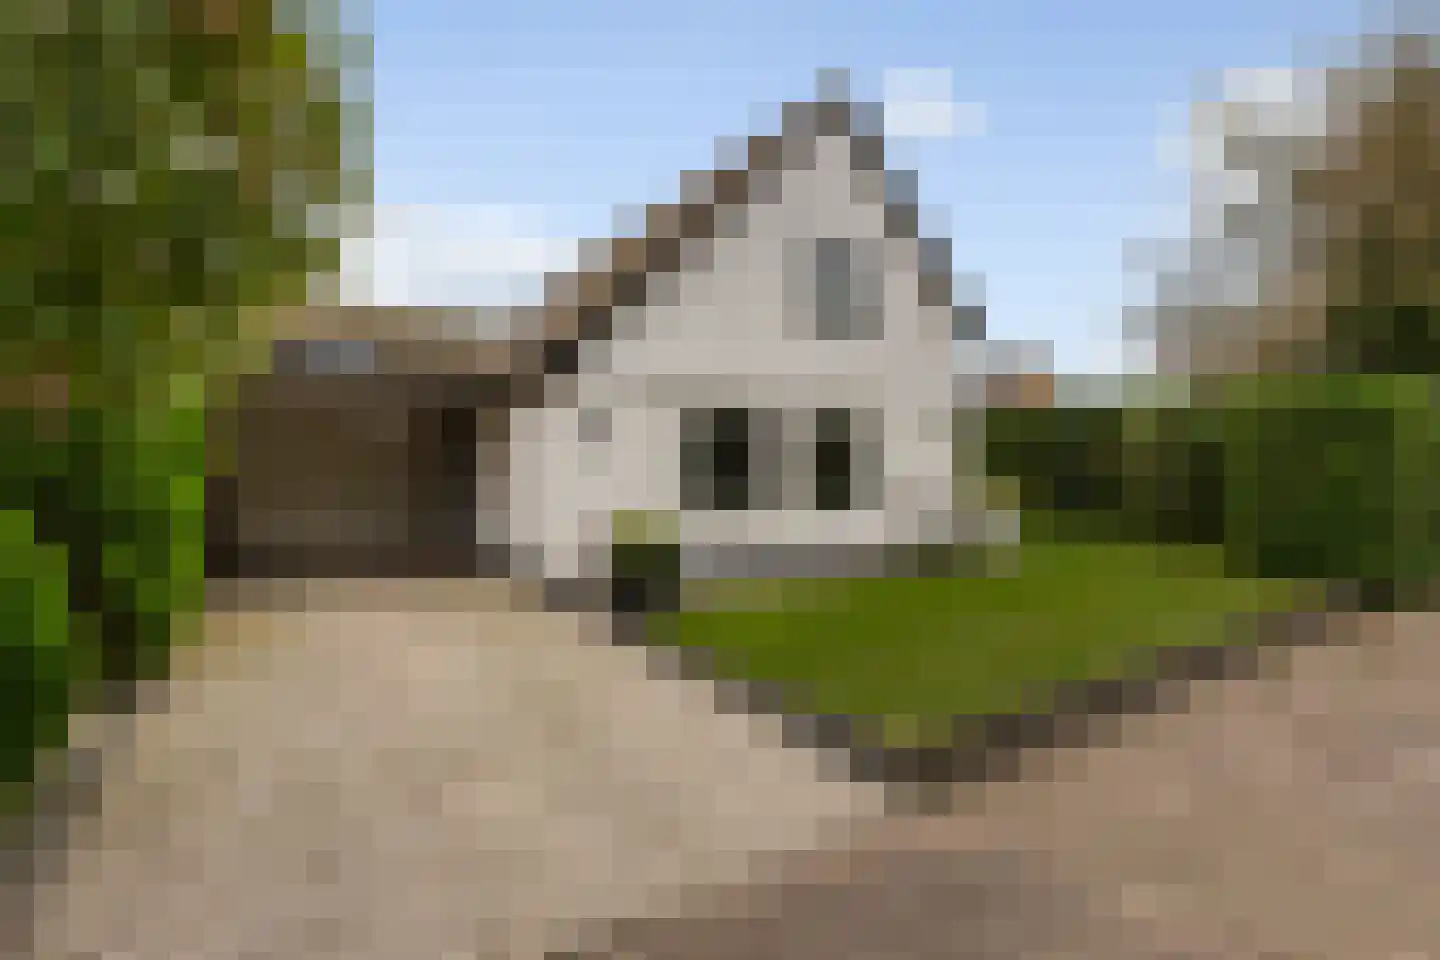
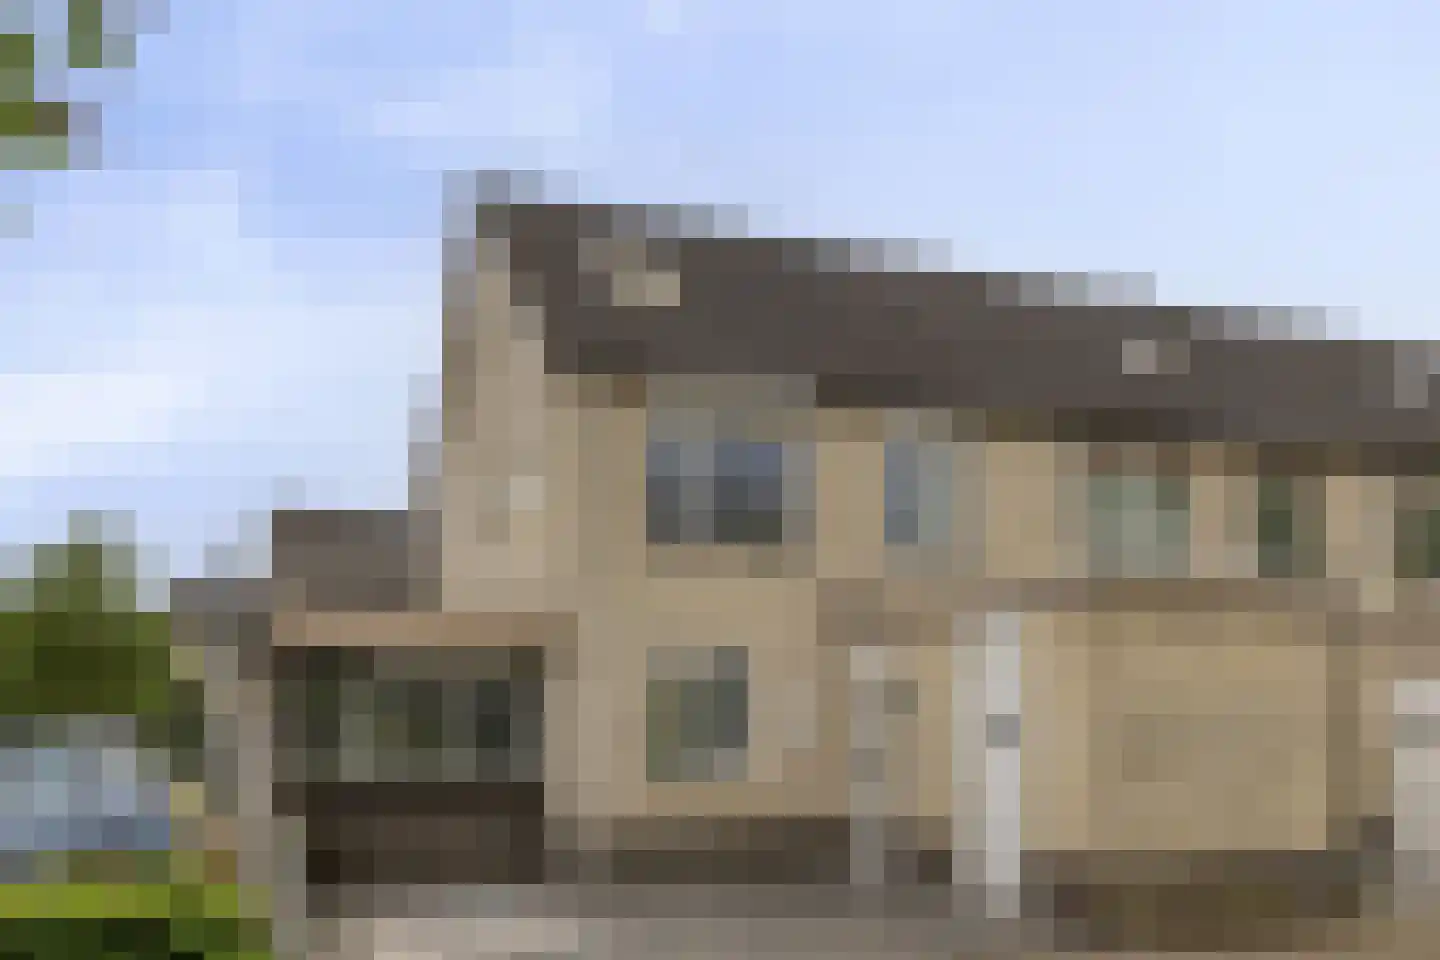
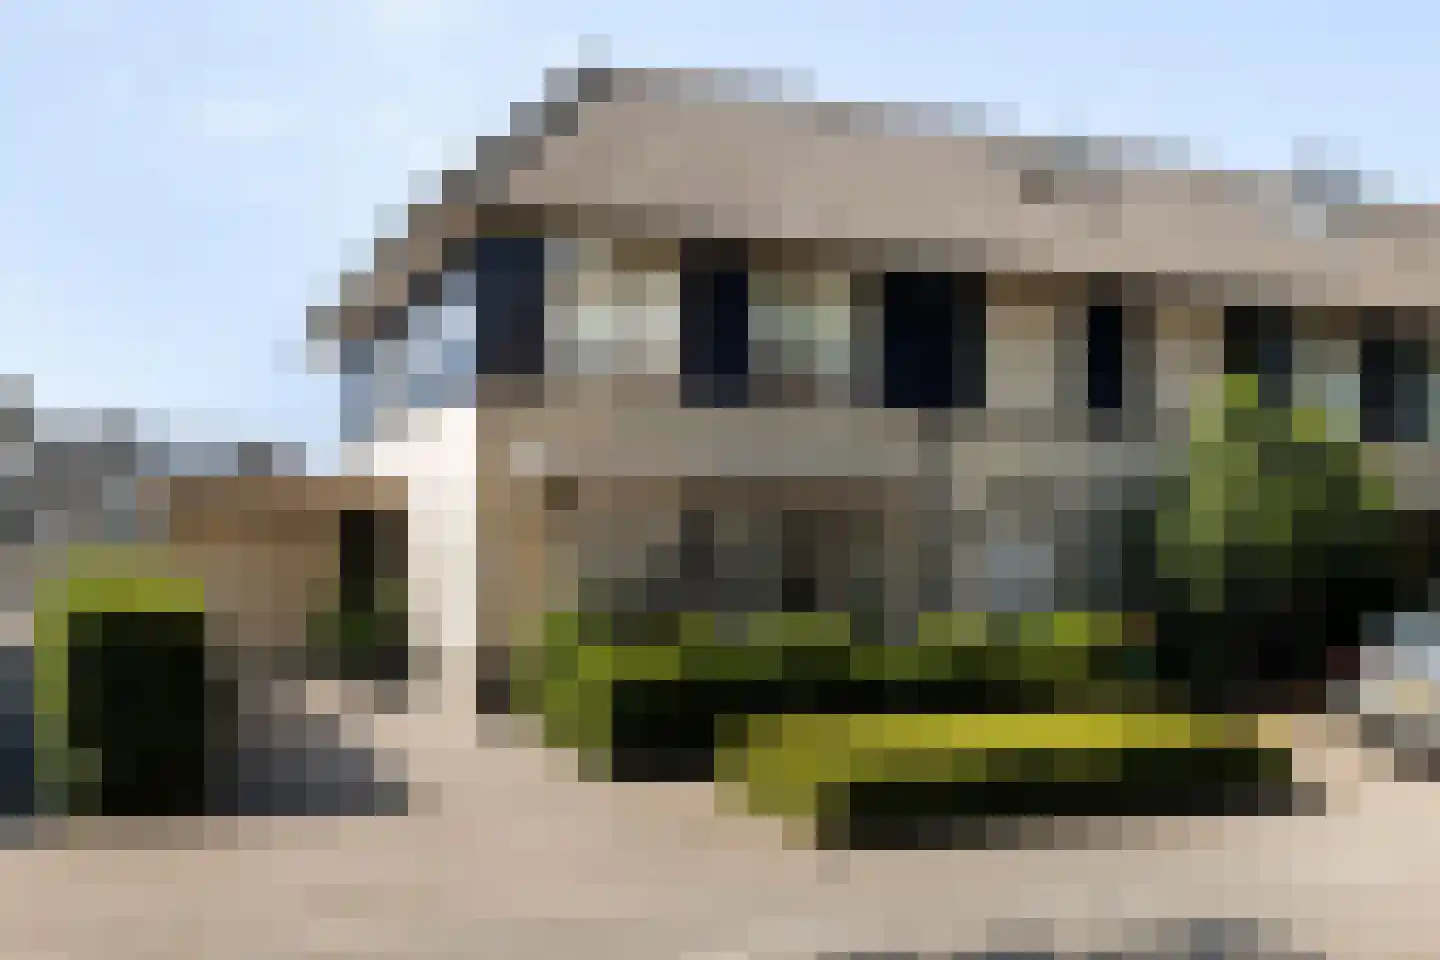
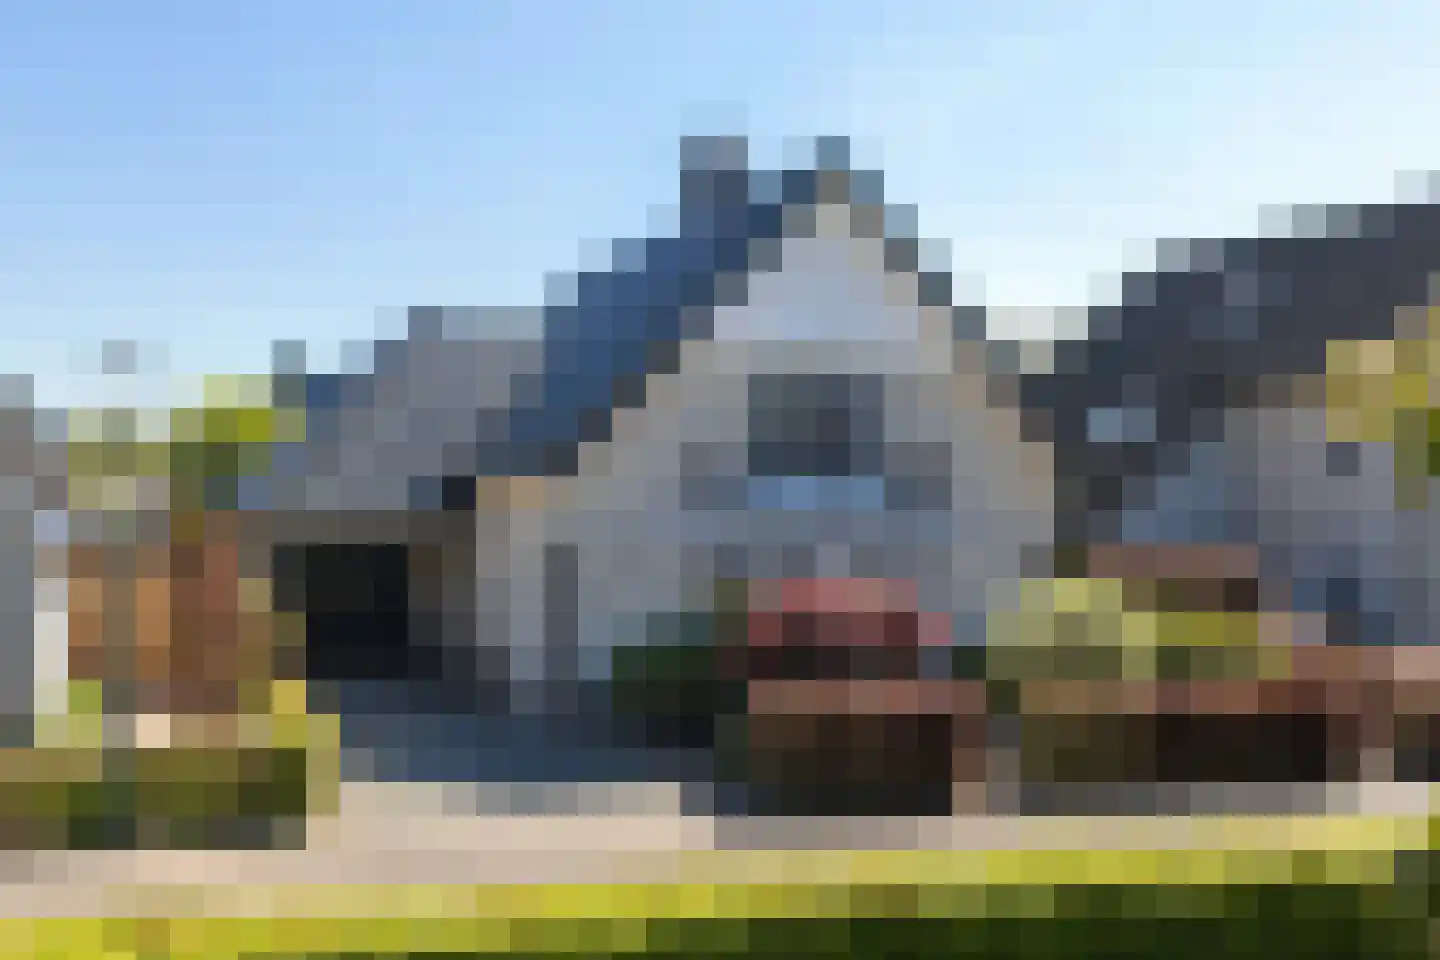
Ben je op zoek naar een ruime eengezinswoning die je volledig naar eigen smaak kunt moderniseren én uitbreiden? Dan is dit een kans die je niet wilt missen. Deze woning biedt een uitstekende basis met verrassend veel ruimte, maar liefst vijf slaapkamers, een ruime garage op eigen terrein en volop mogelijkheden om jouw ideale thuis te realiseren. De grote raampartijen aan zowel de voor- als achterzijde van de begane grond zorgen voor een prettige lichtinval en een heerlijk ruimtelijk gevoel. Aan de voorzijde kijk je leuk weg over een mooie straat, terwijl de woning aan de achterzijde grenst aan een ruim plein met extra parkeergelegenheid. Dit zorgt niet alleen voor veel praktische ruimte, maar ook voor een fijne mate van privacy in de tuin. Een absoluut pluspunt is de reeds verleende vergunning voor het vernieuwen van de voorgevel. Daarbij is tevens toestemming gegeven voor het uitbouwen van zowel de begane grond als de eerste verdieping. Hierdoor kun je de woonkamer én de master bedroom aanzienlijk vergroten en de woning volledig naar eigen wens transformeren. Ook qua ligging zit je hier uitstekend: zowel aan de voor- als achterzijde van de woning is er volop parkeergelegenheid. Daarnaast bevinden dagelijkse voorzieningen zoals een supermarkt, scholen en een huisarts zich letterlijk om de hoek. Voor ontspanning en recreatie wandel je zo naar het nabijgelegen kasteelbos en andere mooie natuurgebieden. Kortom: een ideale woning voor zowel gezinnen als starters die ruimte, potentie en een fijne woonomgeving weten te waarderen. Begane grond: Via de hal betreed je de woning, waar zich tevens de toiletruimte bevindt. Vanuit de hal loop je door naar de woonkamer, waar de trapopgang is gesitueerd. De woonkamer is dankzij de grote raampartijen heerlijk licht en biedt volop mogelijkheden voor het creëren van een sfeervolle zit- en eethoek. Aan de achterzijde bevindt zich de keuken. De huidige keuken is gedateerd, maar compleet uitgevoerd en voorzien van diverse inbouwapparatuur, waaronder een combi-oven, inductiekookplaat, koelkast (2025), boiler en een vaatwasser (2019). Eerste verdieping: De overloop geeft toegang tot drie royale slaapkamers, waaronder een zeer ruime master bedroom. De verdieping is praktisch ingedeeld en beschikt over twee vaste kasten. Er is dus volop ruimte voor een gezin. De badkamer is uitgerust met een ligbad, wastafel en tweede toilet. Tweede verdieping: De zolderverdieping is verrassend ruim dankzij de royale dakkapellen aan zowel de voor- als achterzijde van de woning. Hierdoor zijn hier twee volwaardige slaapkamers gerealiseerd. Daarnaast is er voldoende ruimte om een derde kamer te creëren, ideaal als thuiswerkplek of hobbyruimte. De gehele achtergevel en beide dakkapellen zijn voorzien van kunststof kozijnen met HR++ glas. Tevens zijn de slaapkamers uitgerust met rolluiken, wat zorgt voor extra comfort en privacy. Exterieur: De achtertuin biedt volop ruimte en beschikt over een ruime garage, ideaal voor het stallen van een auto, fietsen en het opbergen van spullen. De garage is bereikbaar via een achtergelegen parkeerplaats en voorzien van een garagedeur, wat zorgt voor extra gebruiksgemak. De tuin is grotendeels voorzien van sierbestrating en wat plantenborders. Bijzonderheden: • Ruime eengezinswoning met veel potentie • Grote raampartijen op de begane grond voor optimale lichtinval • Gedateerde maar functionele keuken met o.a. vaatwasser (2025) • Vergunning aanwezig voor vernieuwen voorgevel • Mogelijkheid tot uitbouw begane grond en eerste verdieping • Drie royale slaapkamers op de eerste verdieping • Twee (mogelijk drie) slaapkamers op zolder dankzij dakkapellen • Dakkapellen aan zowel voor- als achterzijde • Kunststof kozijnen met HR++ glas (achterzijde) • Slaapkamers voorzien van rolluiken • Badkamer met ligbad en tweede toilet • Ruime garage bereikbaar via achtergelegen terrein • De voorgevel verkeert in matige conditie. Hiervoor is reeds een vergunning verleend voor vernieuwing en eventuele uitbouw. Benieuwd naar de mogelijkheden? Deze woning biedt een uitstekende basis met volop kansen om geheel naar eigen wens te moderniseren en uit te breiden. Kom de ruimte en potentie zelf ervaren en plan snel een bezichtiging!
€ 439.000
Cost of copper (estimated): € 10.630
2% transfer tax (€ 8.780) + notary (€ 1.150) + valuation (€ 700)
Total purchase (incl. p.p.): € 449.630
3,02%
Yearly
€ 21.950
Direct available
Estimated mortgage
Indicative gross monthly cost
Based on annuity and 30 year term
Indicative net monthly cost
iDisclaimer: this mortgage calculation is a simplified indication based on general assumptions. No rights can be derived from the results shown. Calculated with 10-annual interest (met NHG), automatically determined based on the price limit € 470.000. Source: 10-jaars rente uit mortgage_rates (08-06-2026 03:45).
Ligbad, toilet, en wastafel
Elektra
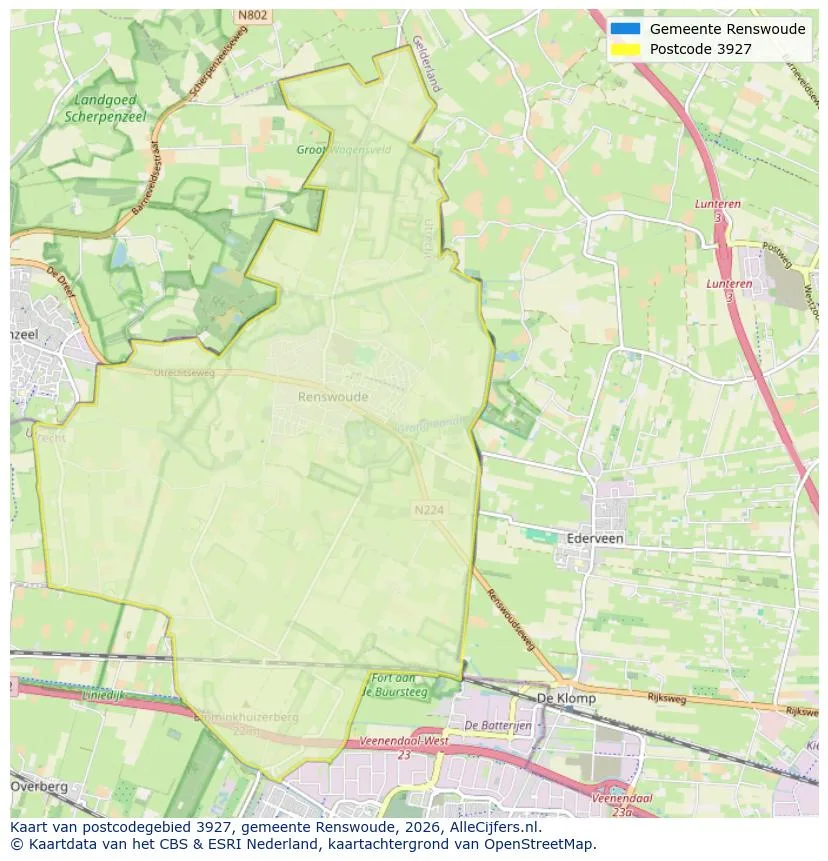
Explore Renswoude and the surrounding areas
View current location data on residents, WOZ development, housing stock, energy consumption, business activity and safety in Renswoude. In 2026 were there 5.905 residents. The average WOZ value in 2025 is EUR 514.000.
Residents
5.905
Last year: 2026
Average WOZ
EUR 514.000
Last year: 2025
Average income per person.
EUR 33.100
Source: AllNumbers
Crimes (current year)
129
Total registered
| Year | Residents |
|---|---|
| 2022 | 5.651 |
| 2023 | 5.747 |
| 2024 | 5.753 |
| 2025 | 5.782 |
| 2026 | 5.905 |
| Year | Average WOZ |
|---|---|
| 2021 | EUR 369.000 |
| 2022 | EUR 402.000 |
| 2023 | EUR 499.000 |
| 2024 | EUR 515.000 |
| 2025 | EUR 514.000 |
Hoger
21
Praktisch
34
Middelbaar
46
Europa
335
Nederland
5.130
Buiten Europa
317
Label A
869
Label C
469
Label B
328
Label G
128
Label D
126
Label F
77
Label A++++
50
Label A+
45
Label A+++
44
Label E
40
Label A++
17
Label A+++++
2
| Year | Gas (m3) | Electricity (kWh) |
|---|---|---|
| 2020 | 1.370 | 3.220 |
| 2021 | 1.490 | 3.350 |
| 2022 | 1.160 | 3.120 |
| 2023 | 970 | 2.910 |
| 2024 | 950 | 3.020 |
Hoekwoning
Gas: 940 • Electricity: 2.670
Huurwoning
Gas: 770 • Electricity: 2.250
Koopwoning
Gas: 1.040 • Electricity: 3.150
Appartement
Gas: 600 • Electricity: 2.010
Tussenwoning
Gas: 780 • Electricity: 2.480
Vrijstaande woning
Gas: 1.410 • Electricity: 4.170
Twee-onder-één-kap woning
Gas: 1.190 • Electricity: 3.220
Total number of company establishments: 960
| Period | Crimes |
|---|---|
| jan 2026 | 10 |
| jul 2025 | 10 |
| jun 2025 | 14 |
| mei 2025 | 24 |
| mrt 2025 | 12 |
| mrt 2026 | 12 |
| nov 2024 | 15 |
| nov 2025 | 11 |
| okt 2024 | 7 |
| okt 2025 | 10 |
| sep 2024 | 7 |
| sep 2025 | 6 |
These figures give an indicative picture of safety trends in the living environment of Renswoude.
Short answers based on current local statistics, handy for a quick comparison of the living environment.
Renswoude telt in 2026 ongeveer 5.905 inwoners.
De gemiddelde WOZ-waarde in Renswoude is in 2025 circa € 514.000.
Het gemiddelde inkomen per inwoner in Renswoude ligt rond € 33.100 per jaar.
Voor het huidige jaar gaat het om ongeveer 129 geregistreerde misdrijven. Gebruik deze cijfers als indicatie en vergelijk trends per periode.
In Renswoude komt vooral "Tussenwoningen" veel voor, met ongeveer 807 woningen.
View more homes in this location.
3927GM Renswoude
€ 825.000 k.k.
€ 5.255/m²
3927DJ Renswoude
€ 569.000 k.k.
€ 3.951/m²
3927AR Renswoude
€ 475.000 k.k.
€ 3.862/m²
3927DH Renswoude
€ 625.000 k.k.
€ 4.921/m²
3927AD Renswoude
€ 598.000 k.k.
€ 3.987/m²
3927AH Renswoude
€ 539.000 k.k.
€ 5.133/m²
3927CK Renswoude
€ 625.000 k.k.
€ 5.000/m²
3927DL Renswoude
€ 915.000 k.k.
