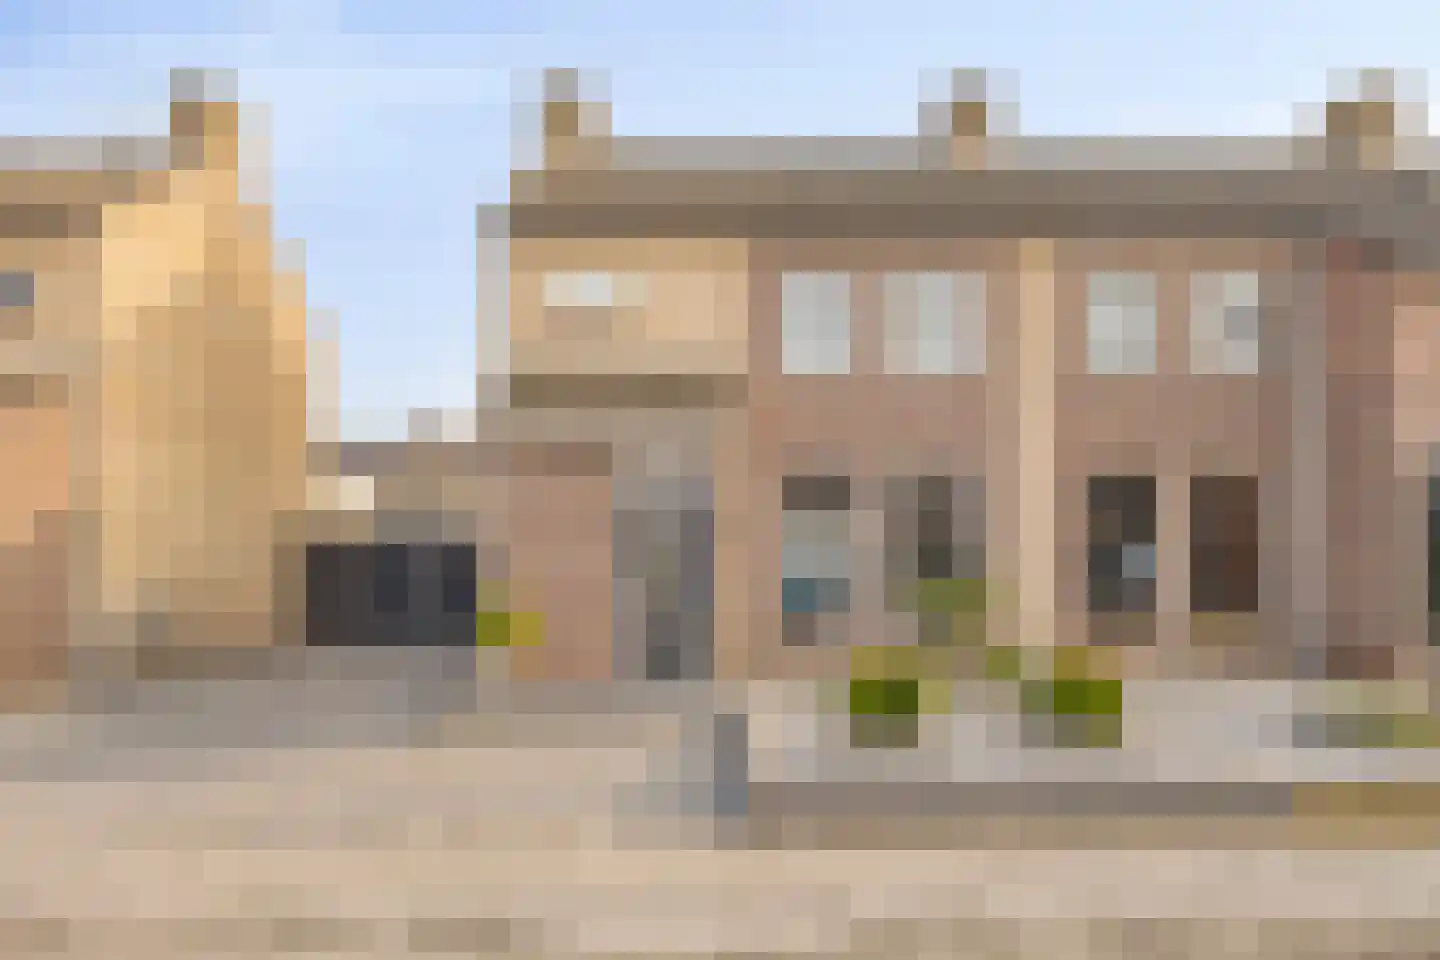
- Sold
Maasstraat 4 b
5836BB Sambeek
€ 695.000 k.k.
€ 3.527/m²
- Living area
- 197 m²
- Land area
- 522 m²
- Bedrooms
- 4
View 12 sold houses in Sambeek
Type to search. Use arrow down and arrow up to navigate through results and press Enter to open.
Hidden search suggestions.
Compare sold homes in Sambeek or view the current offering in this location directly.
On this page you will find recently sold homes in Sambeek. Use this overview to better estimate selling prices, popular neighborhoods, and the local housing supply before you choose a real estate agent. Also view the current housing supply with 16 houses in Sambeek.
5836BB Sambeek
€ 695.000 k.k.
€ 3.527/m²
5836BM Sambeek
€ 415.000 k.k.
€ 4.716/m²
5836EC Sambeek
€ 450.000 k.k.
€ 3.600/m²
5836BD Sambeek
€ 450.000 k.k.
€ 3.658/m²
5836BD Sambeek
€ 350.000 k.k.
€ 2.713/m²
5836AC Sambeek
€ 589.000 k.k.
€ 2.752/m²
5836CC Sambeek
€ 1.650.000 k.k.
€ 2.915/m²
5836BK Sambeek
€ 365.000 k.k.
€ 2.896/m²
5836AG Sambeek
€ 435.000 k.k.
€ 4.223/m²
5836BM Sambeek
€ 360.000 k.k.
€ 4.235/m²
5836AV Sambeek
€ 1.300.000 k.k.
€ 4.905/m²
5836EC Sambeek
€ 439.000 k.k.
€ 3.512/m²
Bekijk recente verkopen en ontvang gratis offertes van lokale verkoopmakelaars in Sambeek.
Zelf je woning verkopen in Sambeek? Vergelijk verkoopmakelaars in Sambeek of bekijk de beste verkoopmakelaars in Sambeek als referentie bij jouw keuze.
Makelaars maken scherpere voorstellen als ze weten dat je vergelijkt — vraag offertes aan voor verkoop of aankoop.
Short answers about housing prices, sold homes and comparing real estate agents in Sambeek.
The costs of a real estate agent in Sambeek vary per office, property type and sales approach. Therefore, compare multiple quotes and also look at the real estate agents in Sambeek to better compare rates, presentation and local experience.
On this page we currently show 12 sold houses in Sambeek from our selection. This helps you to better assess recent transactions and the local housing market.
Houses sold in Sambeek give insight into asking prices, house types and neighborhoods where recent transactions have taken place. Compare this also with the current housing stock in Sambeek to better understand the market.
You can use sold homes as a first market indication, but a local real estate agent can better take into account finishing, location, maintenance and current demand in Sambeek.
Vergelijk makelaars in Sambeek op lokale verkoopervaring, reviews, verwachte opbrengst, courtage en marketingaanpak. Bekijk verkoopmakelaars in Sambeek of de top 10 makelaars in Sambeek om snel sterke kantoren te ontdekken.
View current location data on residents, WOZ development, housing stock, energy consumption, business activity and safety in Sambeek. In 2025 were there 1.845 residents. The average WOZ value in 2025 is EUR 429.000.
These figures help to better assess and compare the housing stock in Sambeek with recent sold homes. Orient yourself then on suitable top real estate agents in Sambeek for sales advice in this region.
Residents
1.845
Last year: 2025
Average WOZ
EUR 429.000
Last year: 2025
Average income per person.
EUR 34.300
Source: AllNumbers
Crimes (current year)
50
Total registered
| Year | Residents |
|---|---|
| 2021 | 1.835 |
| 2022 | 1.840 |
| 2023 | 1.855 |
| 2024 | 1.840 |
| 2025 | 1.845 |
| Year | Average WOZ |
|---|---|
| 2021 | EUR 296.000 |
| 2022 | EUR 318.000 |
| 2023 | EUR 361.000 |
| 2024 | EUR 396.000 |
| 2025 | EUR 429.000 |
Hoger
470
Praktisch
290
Middelbaar
660
Europa
100
Nederland
1.655
Buiten Europa
90
Label A
143
Label C
136
Label D
126
Label B
83
Label G
72
Label F
62
Label E
42
Label A+++
12
Label A+
9
Label A++++
9
Label A++
3
Label A+++++
1
| Year | Gas (m3) | Electricity (kWh) |
|---|---|---|
| 2020 | 1.560 | 3.670 |
| 2021 | 1.660 | 3.680 |
| 2022 | 1.300 | 3.420 |
| 2023 | 1.050 | 3.260 |
| 2024 | 1.010 | 3.370 |
Hoekwoning
Gas: 840 • Electricity: 2.970
Huurwoning
Gas: 820 • Electricity: 2.700
Koopwoning
Gas: 1.090 • Electricity: 3.360
Appartement
Gas: 870 • Electricity: 2.360
Tussenwoning
Gas: 740 • Electricity: 2.920
Vrijstaande woning
Gas: 1.260 • Electricity: 3.890
Twee-onder-één-kap woning
Gas: 950 • Electricity: 2.710
Total number of company establishments: 245
| Period | Crimes |
|---|---|
| jan 2025 | 2 |
| jan 2026 | 2 |
| jul 2025 | 7 |
| jun 2025 | 6 |
| mei 2025 | 3 |
| mrt 2025 | 7 |
| nov 2024 | 3 |
| nov 2025 | 2 |
| okt 2024 | 4 |
| okt 2025 | 3 |
| sep 2024 | 3 |
| sep 2025 | 1 |
These figures give an indicative picture of safety trends in the living environment of Sambeek.
Short answers based on current local statistics, handy for a quick comparison of the living environment.
Sambeek telt in 2025 ongeveer 1.845 inwoners.
De gemiddelde WOZ-waarde in Sambeek is in 2025 circa € 429.000.
Het gemiddelde inkomen per inwoner in Sambeek ligt rond € 34.300 per jaar.
Voor het huidige jaar gaat het om ongeveer 50 geregistreerde misdrijven. Gebruik deze cijfers als indicatie en vergelijk trends per periode.
In Sambeek komt vooral "Vrijstaande woningen" veel voor, met ongeveer 345 woningen.