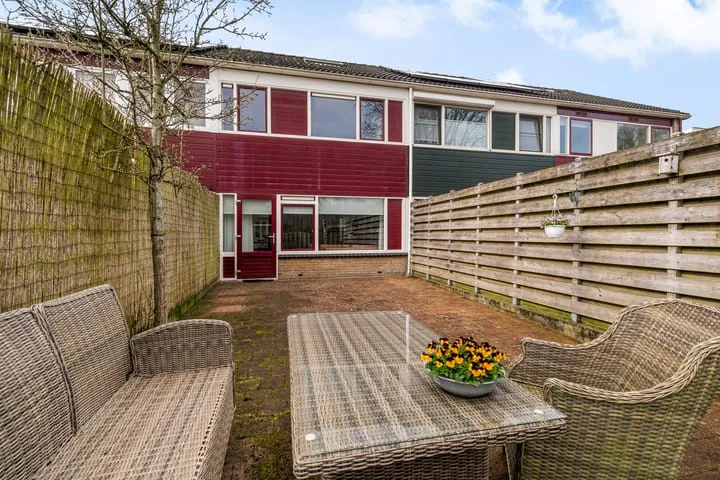
- Sold
Suermondsweg 14 A
9422EE Smilde
€ 325.000 k.k.
€ 3.495/m²
- Living area
- 93 m²
- Land area
- 528 m²
- Bedrooms
- 3
View 46 sold houses in Smilde
Type to search. Use arrow down and arrow up to navigate through results and press Enter to open.
Hidden search suggestions.
Compare sold homes in Smilde or view the current offering in this location directly.
On this page you will find recently sold homes in Smilde. Use this overview to better estimate selling prices, popular neighborhoods, and the local housing supply before you choose a real estate agent. Also view the current housing supply with 59 houses in Smilde.
9422EE Smilde
€ 325.000 k.k.
€ 3.495/m²
9422GE Smilde
€ 282.000 k.k.
€ 3.065/m²
9422GM Smilde
€ 298.000 k.k.
€ 2.462/m²
9422BE Smilde
€ 649.000 k.k.
€ 3.708/m²
9422EP Smilde
€ 380.000 k.k.
€ 3.689/m²
9422GT Smilde
€ 300.000 k.k.
€ 2.068/m²
9422JA Smilde
€ 415.000 k.k.
€ 4.068/m²
9422KM Smilde
€ 399.000 k.k.
€ 2.677/m²
9422JC Smilde
€ 265.000 k.k.
€ 2.944/m²
9422LH Smilde
€ 425.000 k.k.
€ 4.473/m²
9422GT Smilde
€ 439.500 k.k.
€ 2.949/m²
9422HG Smilde
€ 350.000 k.k.
€ 2.916/m²
9422BM Smilde
€ 350.000 k.k.
€ 3.211/m²
9422LK Smilde
€ 475.000 k.k.
€ 3.253/m²
9422GE Smilde
€ 275.000 k.k.
€ 2.956/m²
9422JH Smilde
€ 525.000 k.k.
€ 2.720/m²
9422MG Smilde
€ 550.000 k.k.
€ 3.395/m²
9422AM Smilde
€ 185.000 k.k.
€ 2.434/m²
9422KA Smilde
€ 385.000 k.k.
€ 2.810/m²
9422CE Smilde
€ 675.000 k.k.
€ 4.411/m²
9422LC Smilde
€ 375.000 k.k.
€ 3.676/m²
9422BG Smilde
€ 769.000 k.k.
€ 1.922/m²
9422AB Smilde
€ 445.000 k.k.
€ 3.371/m²
9422EE Smilde
€ 275.000 k.k.
€ 3.819/m²
9422EJ Smilde
€ 385.000 k.k.
€ 2.305/m²
9422HG Smilde
€ 350.000 k.k.
€ 3.932/m²
9422CB Smilde
€ 250.000 k.k.
€ 0/m²
9422ES Smilde
€ 589.500 k.k.
€ 0/m²
Bekijk recente verkopen en ontvang gratis offertes van lokale verkoopmakelaars in Smilde.
Zelf je woning verkopen in Smilde? Vergelijk verkoopmakelaars in Smilde of bekijk de beste verkoopmakelaars in Smilde als referentie bij jouw keuze.
Makelaars maken scherpere voorstellen als ze weten dat je vergelijkt — vraag offertes aan voor verkoop of aankoop.
Short answers about housing prices, sold homes and comparing real estate agents in Smilde.
The costs of a real estate agent in Smilde vary per office, property type and sales approach. Therefore, compare multiple quotes and also look at the real estate agents in Smilde to better compare rates, presentation and local experience.
On this page we currently show 46 sold houses in Smilde from our selection. This helps you to better assess recent transactions and the local housing market.
Houses sold in Smilde give insight into asking prices, house types and neighborhoods where recent transactions have taken place. Compare this also with the current housing stock in Smilde to better understand the market.
You can use sold homes as a first market indication, but a local real estate agent can better take into account finishing, location, maintenance and current demand in Smilde.
Vergelijk makelaars in Smilde op lokale verkoopervaring, reviews, verwachte opbrengst, courtage en marketingaanpak. Bekijk verkoopmakelaars in Smilde of de top 10 makelaars in Smilde om snel sterke kantoren te ontdekken.
View current location data on residents, WOZ development, housing stock, energy consumption, business activity and safety in Smilde. In 2025 were there 4.933 residents. The average WOZ value in 2025 is EUR 309.701.
These figures help to better assess and compare the housing stock in Smilde with recent sold homes. Orient yourself then on suitable top real estate agents in Smilde for sales advice in this region.
Residents
4.933
Last year: 2025
Average WOZ
EUR 309.701
Last year: 2025
Average income per person.
EUR 22.121
Source: AllNumbers
Crimes (current year)
81
Total registered
| Year | Residents |
|---|---|
| 2021 | 4.910 |
| 2022 | 4.940 |
| 2023 | 4.956 |
| 2024 | 4.981 |
| 2025 | 4.933 |
| Year | Average WOZ |
|---|---|
| 2021 | EUR 210.298 |
| 2022 | EUR 226.954 |
| 2023 | EUR 259.459 |
| 2024 | EUR 289.052 |
| 2025 | EUR 309.701 |
Hoger
531
Praktisch
827
Middelbaar
1.839
Europa
171
Nederland
4.459
Buiten Europa
306
Label C
673
Label A
480
Label B
438
Label D
223
Label G
216
Label F
169
Label E
70
Label A+++
35
Label A++
19
Label A+
15
Label A++++
12
Label A+++++
1
| Year | Gas (m3) | Electricity (kWh) |
|---|---|---|
| 2020 | 1.404 | 2.788 |
| 2021 | 1.573 | 2.868 |
| 2022 | 1.211 | 2.715 |
| 2023 | 1.010 | 2.657 |
| 2024 | 977 | 2.773 |
Hoekwoning
Gas: 866 • Electricity: 1.783
Huurwoning
Gas: 810 • Electricity: 1.715
Koopwoning
Gas: 1.089 • Electricity: 3.053
Appartement
Gas: 515 • Electricity: 1.361
Tussenwoning
Gas: 757 • Electricity: 1.694
Vrijstaande woning
Gas: 1.217 • Electricity: 3.468
Twee-onder-één-kap woning
Gas: 953 • Electricity: 2.515
Total number of company establishments: 527
| Period | Crimes |
|---|---|
| jan 2025 | 8 |
| jan 2026 | 3 |
| jul 2025 | 2 |
| jun 2025 | 7 |
| mei 2025 | 6 |
| mrt 2025 | 13 |
| nov 2024 | 6 |
| nov 2025 | 9 |
| okt 2024 | 5 |
| okt 2025 | 8 |
| sep 2024 | 8 |
| sep 2025 | 10 |
These figures give an indicative picture of safety trends in the living environment of Smilde.
Short answers based on current local statistics, handy for a quick comparison of the living environment.
Smilde telt in 2025 ongeveer 4.933 inwoners.
De gemiddelde WOZ-waarde in Smilde is in 2025 circa € 309.701.
Het gemiddelde inkomen per inwoner in Smilde ligt rond € 22.121 per jaar.
Voor het huidige jaar gaat het om ongeveer 81 geregistreerde misdrijven. Gebruik deze cijfers als indicatie en vergelijk trends per periode.
In Smilde komt vooral "Vrijstaande woningen" veel voor, met ongeveer 830 woningen.