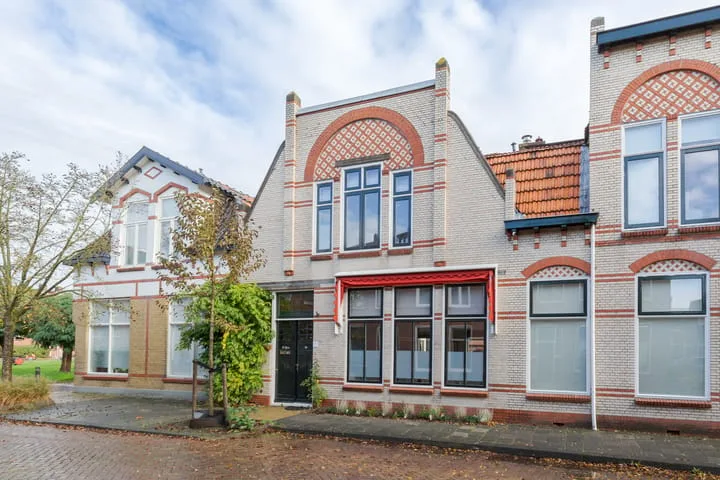
- Sold
Spijkerboor 24
8607KC Sneek
€ 798.500 k.k.
€ 5.151/m²
- Living area
- 155 m²
- Land area
- 683 m²
- Bedrooms
- 3
View 338 sold houses in Sneek
Type to search. Use arrow down and arrow up to navigate through results and press Enter to open.
Hidden search suggestions.
Compare sold homes in Sneek or view the current offering in this location directly.
On this page you will find recently sold homes in Sneek. Use this overview to better estimate selling prices, popular neighborhoods, and the local housing supply before you choose a real estate agent. Also view the current housing supply with 477 houses in Sneek.
8607KC Sneek
€ 798.500 k.k.
€ 5.151/m²
8607GS Sneek
€ 379.500 k.k.
€ 3.614/m²
8601BA Sneek
€ 305.000 k.k.
€ 4.919/m²
8601BA Sneek
€ 299.500 k.k.
€ 4.753/m²
8601BA Sneek
€ 215.000 k.k.
€ 5.000/m²
8605BC Sneek
€ 197.500 k.k.
€ 2.500/m²
8601XR Sneek
€ 385.000 k.k.
€ 3.318/m²
8603EW Sneek
Price upon request
8606EM Sneek
Price upon request
8603XL Sneek
€ 375.000 k.k.
€ 3.504/m²
8606AD Sneek
€ 299.000 k.k.
€ 2.820/m²
8601ZE Sneek
€ 495.000 k.k.
€ 3.721/m²
8606CK Sneek
€ 260.000 k.k.
€ 2.680/m²
8607AD Sneek
€ 695.000 k.k.
€ 4.572/m²
8603CG Sneek
€ 249.000 k.k.
€ 3.772/m²
8606EE Sneek
€ 200.000 k.k.
€ 3.174/m²
8607EB Sneek
€ 300.000 k.k.
€ 2.564/m²
8606AC Sneek
€ 319.500 k.k.
€ 3.227/m²
8606EH Sneek
€ 275.000 k.k.
€ 3.160/m²
8604DE Sneek
€ 795.000 k.k.
€ 4.491/m²
8607AS Sneek
€ 239.500 k.k.
€ 2.419/m²
8608EB Sneek
€ 190.000 k.k.
€ 2.317/m²
8606XX Sneek
€ 269.000 k.k.
€ 2.744/m²
8603XH Sneek
€ 249.500 k.k.
€ 3.006/m²
8606EB Sneek
€ 262.500 k.k.
€ 3.201/m²
8602XN Sneek
€ 265.000 k.k.
€ 3.192/m²
8602AX Sneek
€ 250.000 k.k.
€ 3.125/m²
8608BP Sneek
€ 195.000 k.k.
€ 3.046/m²
Get free quotes from realtors with local market knowledge in Sneek.
Selling a home in Sneek? Compare real estate agents who know the local housing market. Also check out all real estate agents in Sneek or the top 10 real estate agents in Sneek for extra context for your choice.
By comparing brokers and requesting quotes
Short answers about housing prices, sold homes and comparing real estate agents in Sneek.
The costs of a real estate agent in Sneek vary per office, property type and sales approach. Therefore, compare multiple quotes and also look at the real estate agents in Sneek to better compare rates, presentation and local experience.
On this page we currently show 338 sold houses in Sneek from our selection. This helps you to better assess recent transactions and the local housing market.
Houses sold in Sneek give insight into asking prices, house types and neighborhoods where recent transactions have taken place. Compare this also with the current housing stock in Sneek to better understand the market.
You can use sold homes as a first market indication, but a local real estate agent can better take into account finishing, location, maintenance and current demand in Sneek.
Compare realtors in Sneek on local sales experience, reviews, expected yield, commission and marketing approach. The top 10 realtors in Sneek helps to quickly discover strong offices.
View current location data on residents, WOZ development, housing stock, energy consumption, business activity and safety in Sneek. In 2025 were there 35.130 residents. The average WOZ value in 2025 is EUR 306.000.
These figures help to better assess and compare the housing stock in Sneek with recent sold homes. Orient yourself then on suitable top real estate agents in Sneek for sales advice in this region.
Residents
35.130
Last year: 2025
Average WOZ
EUR 306.000
Last year: 2025
Average income per person.
EUR 31.000
Source: AllNumbers
Crimes (current year)
1.572
Total registered
| Year | Residents |
|---|---|
| 2021 | 34.485 |
| 2022 | 34.840 |
| 2023 | 35.020 |
| 2024 | 34.850 |
| 2025 | 35.130 |
| Year | Average WOZ |
|---|---|
| 2021 | EUR 220.000 |
| 2022 | EUR 241.000 |
| 2023 | EUR 280.000 |
| 2024 | EUR 290.000 |
| 2025 | EUR 306.000 |
Hoger
7.100
Praktisch
7.160
Middelbaar
11.320
Europa
1.765
Nederland
29.535
Buiten Europa
3.835
Label A
4.999
Label C
4.328
Label B
3.033
Label D
1.382
Label F
949
Label G
948
Label E
932
Label A+
486
Label A+++
295
Label A++
185
Label A++++
106
Label A+++++
6
| Year | Gas (m3) | Electricity (kWh) |
|---|---|---|
| 2020 | 1.170 | 2.450 |
| 2021 | 1.290 | 2.510 |
| 2022 | 990 | 2.350 |
| 2023 | 850 | 2.260 |
| 2024 | 820 | 2.310 |
Hoekwoning
Gas: 970 • Electricity: 2.390
Huurwoning
Gas: 720 • Electricity: 1.750
Koopwoning
Gas: 940 • Electricity: 2.660
Appartement
Gas: 610 • Electricity: 1.600
Tussenwoning
Gas: 870 • Electricity: 2.220
Vrijstaande woning
Gas: 1.210 • Electricity: 3.770
Twee-onder-één-kap woning
Gas: 960 • Electricity: 2.880
Total number of company establishments: 4.325
| Period | Crimes |
|---|---|
| jan 2025 | 124 |
| jan 2026 | 129 |
| jul 2025 | 129 |
| jun 2025 | 128 |
| mei 2025 | 130 |
| mrt 2025 | 140 |
| nov 2024 | 118 |
| nov 2025 | 103 |
| okt 2024 | 145 |
| okt 2025 | 126 |
| sep 2024 | 139 |
| sep 2025 | 140 |
These figures give an indicative picture of safety trends in the living environment of Sneek.
Short answers based on current local statistics, handy for a quick comparison of the living environment.
Sneek telt in 2025 ongeveer 35.130 inwoners.
De gemiddelde WOZ-waarde in Sneek is in 2025 circa € 306.000.
Het gemiddelde inkomen per inwoner in Sneek ligt rond € 31.000 per jaar.
Voor het huidige jaar gaat het om ongeveer 1.572 geregistreerde misdrijven. Gebruik deze cijfers als indicatie en vergelijk trends per periode.
In Sneek komt vooral "Tussenwoningen" veel voor, met ongeveer 5.952 woningen.