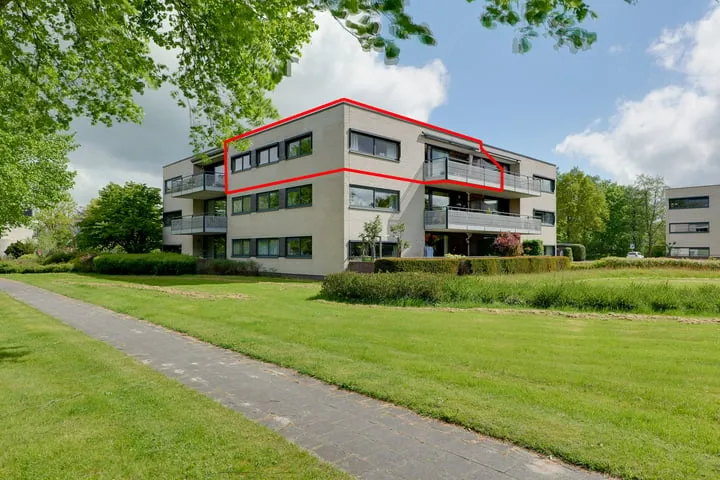
Houses sold in Tolbert

View 37 sold houses in Tolbert

Connected to: Vastgoed Nederland NVM Makelaars

On this page you will find recently sold homes in Tolbert. Use this overview to better estimate selling prices, popular neighborhoods, and the local housing supply before you choose a real estate agent. Also view the current housing supply with 47 houses in Tolbert.

Selection

Search and filter homes

Set your preferences and discover homes that suit you.

Total supply 241.886
Filters

Set price, area and other characteristics. Adjust a filter or click on Show homes. Location changes directly above.

Reset filters

You search for

  • Place Tolbert
  • Status Sold

Huis verkopen in Tolbert? Vergelijk verkoopmakelaars

Bekijk recente verkopen en ontvang gratis offertes van lokale makelaars. Vergelijk meer dan 23 makelaars in Tolbert.

Free request a quote

  • Quotes in Tolbert
  • Non-binding
  • Personal
  • Gratis tarieven vergelijken

Zelf je woning verkopen in Tolbert? Vergelijk verkoopmakelaars in Tolbert of bekijk de beste verkoopmakelaars in Tolbert als referentie bij jouw keuze.

Vergelijk meerdere offertes

Makelaars maken scherpere voorstellen als ze weten dat je vergelijkt — vraag offertes aan voor verkoop of aankoop.

Frequently asked questions about sold homes in Tolbert

Short answers about housing prices, sold homes and comparing real estate agents in Tolbert.

Residential and neighborhood statistics in Tolbert

View current location data on residents, WOZ development, housing stock, energy consumption, business activity and safety in Tolbert. In 2025 were there 4.243 residents. The average WOZ value in 2025 is EUR 286.563.

These figures help to better assess and compare the housing stock in Tolbert with recent sold homes. Orient yourself then on suitable top real estate agents in Tolbert for sales advice in this region.

Residents

4.243

Last year: 2025

Average WOZ

EUR 286.563

Last year: 2025

Average income per person.

EUR 213

Source: AllNumbers

Crimes (current year)

86

Total registered

Demographics and WOZ development

Inhabitants per year

Inhabitants per year in Tolbert
Year Residents
2021 4.262
2022 4.239
2023 4.251
2024 4.225
2025 4.243

Annual WOZ value

WOZ value per year in Tolbert
Year Average WOZ
2021 EUR 209.388
2022 EUR 229.315
2023 EUR 264.448
2024 EUR 260.463
2025 EUR 286.563

Composition of residents

Age build-up

65+: 1.059 0-15: 612 15-25: 426 25-45: 921 45-65: 1.215

Education level

Hoger

872

Praktisch

721

Middelbaar

1.551

Origin of residents (2025)

Europa

141

Nederland

3.746

Buiten Europa

354

Housing stock and construction periods

Types of homes

Hoekwoningen 319
Appartementen 433
Tussenwoningen 431
Vrijstaande woningen 556
Twee-onder-één-kap woningen 377

Construction period of buildings

Voor 1700 1
1700 tot 1900 19
1900 tot 1925 107
1925 tot 1950 74
1950 tot 1970 177
1970 tot 1980 304
1980 tot 1990 556
1990 tot 2000 467
2000 tot 2010 33
2010 tot 2020 99
2020 en later 37

Energy and sustainability

Energy label distribution

Label C

692

Label B

469

Label A

354

Label G

132

Label A++

119

Label D

113

Label A+

87

Label F

79

Label A+++

70

Label E

29

Label A++++

2

Label A+++++

0

Average energy consumption per year

Average energy consumption per year in Tolbert
Year Gas (m3) Electricity (kWh)
2020 1.331 2.691
2021 1.446 2.717
2022 1.136 2.505
2023 934 2.413
2024 874 2.508

Consumption per house type

Hoekwoning

Gas: 898 • Electricity: 2.112

Huurwoning

Gas: 801 • Electricity: 1.811

Koopwoning

Gas: 992 • Electricity: 2.720

Appartement

Gas: 565 • Electricity: 1.608

Tussenwoning

Gas: 838 • Electricity: 2.004

Vrijstaande woning

Gas: 1.189 • Electricity: 3.094

Twee-onder-één-kap woning

Gas: 941 • Electricity: 2.647

Business activity in Tolbert (2025)

Handel en HORECA 85
Nijverheid en energie 75
Zakelijke dienstverlening 128
Overheid, onderwijs en zorg 84
Landbouw, bosbouw en visserij 14
Vervoer, informatie en communicatie 24
Financiele diensten en onroerendgoed 23
Cultuur, recreatie en overige diensten 54

Total number of company establishments: 482

Recent crime statistics

Recent crime statistics in Tolbert
Period Crimes
jan 2025 4
jan 2026 8
jul 2025 6
jun 2025 20
mei 2025 7
mrt 2025 4
nov 2024 5
nov 2025 2
okt 2024 7
okt 2025 6
sep 2024 7
sep 2025 13

These figures give an indicative picture of safety trends in the living environment of Tolbert.

Frequently asked questions about living in Tolbert

Short answers based on current local statistics, handy for a quick comparison of the living environment.

Hoeveel inwoners heeft Tolbert?

Tolbert telt in 2025 ongeveer 4.243 inwoners.

Wat is de gemiddelde WOZ-waarde in Tolbert?

De gemiddelde WOZ-waarde in Tolbert is in 2025 circa € 286.563.

Wat is het gemiddelde inkomen per inwoner in Tolbert?

Het gemiddelde inkomen per inwoner in Tolbert ligt rond € 213 per jaar.

Hoe veilig is wonen in Tolbert?

Voor het huidige jaar gaat het om ongeveer 86 geregistreerde misdrijven. Gebruik deze cijfers als indicatie en vergelijk trends per periode.

Welke woningtypen komen het meest voor in Tolbert?

In Tolbert komt vooral "Vrijstaande woningen" veel voor, met ongeveer 556 woningen.

Receive free, non-binding quotes

Compare multiple real estate agents and choose the best match.