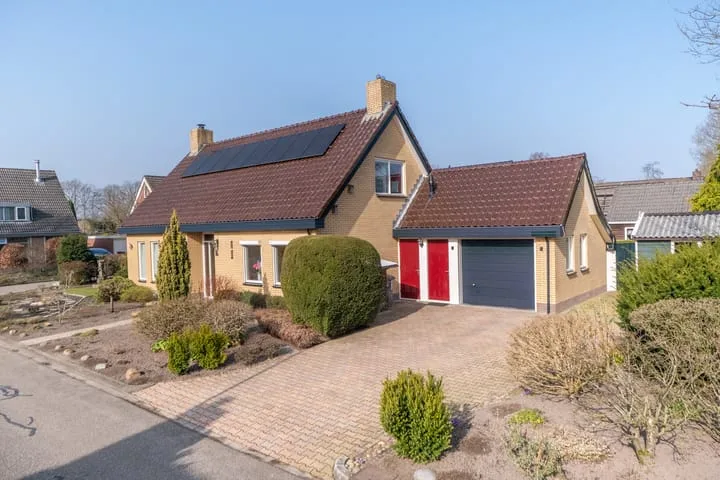
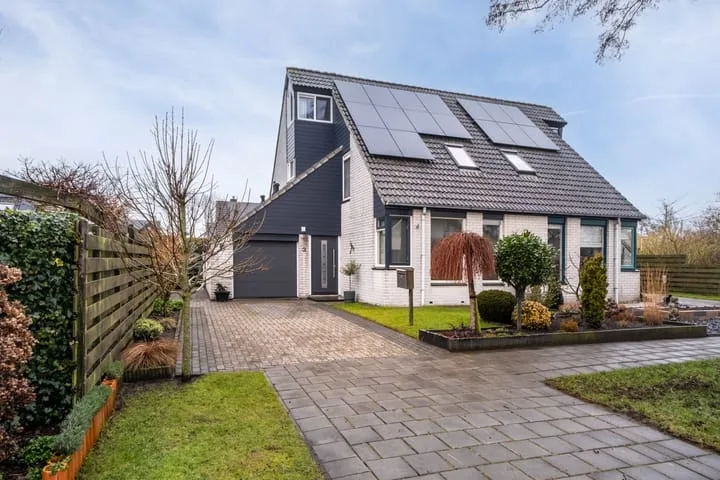
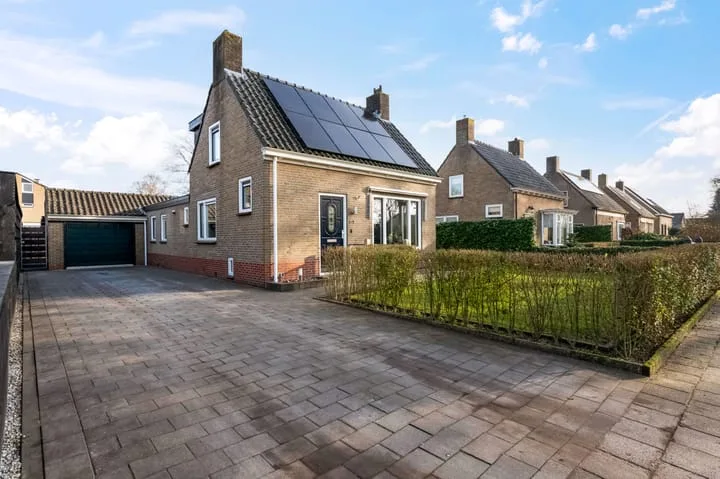
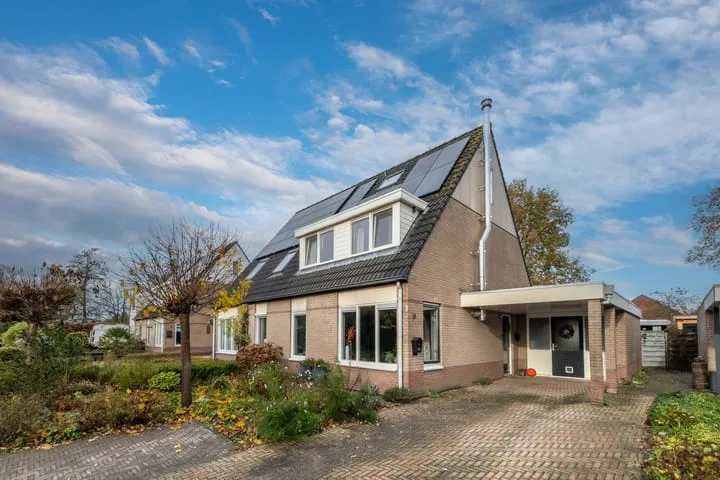
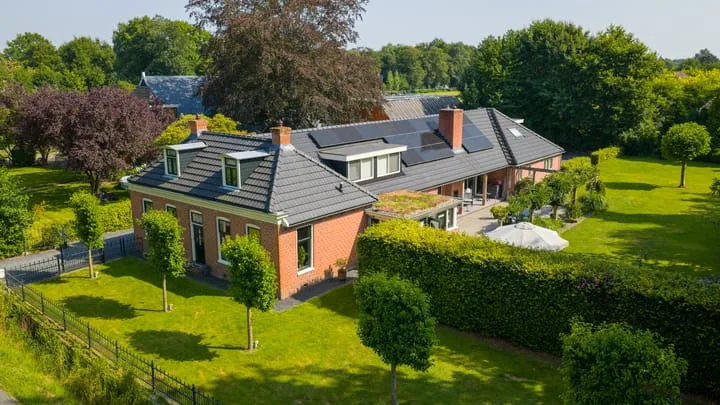
- Sold
Hoofdstraat 50
9356AX Tolbert
€ 499.000 k.k.
€ 2.218/m²
- Living area
- 225 m²
- Land area
- 400 m²
- Bedrooms
- 4
View 37 sold houses in Tolbert
Type to search. Use arrow down and arrow up to navigate through results and press Enter to open.
Hidden search suggestions.
Compare sold homes in Tolbert or view the current offering in this location directly.
On this page you will find recently sold homes in Tolbert. Use this overview to better estimate selling prices, popular neighborhoods, and the local housing supply before you choose a real estate agent. Also view the current housing supply with 47 houses in Tolbert.
9356AX Tolbert
€ 499.000 k.k.
€ 2.218/m²
9356AW Tolbert
€ 425.000 k.k.
€ 3.102/m²
9356SK Tolbert
€ 445.000 k.k.
€ 4.082/m²
9356SK Tolbert
€ 425.000 k.k.
€ 3.695/m²
9356CR Tolbert
€ 389.500 k.k.
€ 3.477/m²
9356CP Tolbert
€ 495.000 k.k.
€ 3.535/m²
9356DB Tolbert
€ 389.000 k.k.
€ 3.382/m²
9356AG Tolbert
€ 350.000 k.k.
€ 4.320/m²
9356CJ Tolbert
€ 265.000 k.k.
€ 2.704/m²
9356EN Tolbert
€ 319.000 k.k.
€ 2.848/m²
9356DL Tolbert
€ 349.000 k.k.
€ 3.712/m²
9356DA Tolbert
€ 475.000 k.k.
€ 3.861/m²
9356HE Tolbert
€ 369.000 k.k.
€ 3.208/m²
9356EK Tolbert
€ 349.000 k.k.
€ 2.982/m²
9356HD Tolbert
€ 525.000 k.k.
€ 3.977/m²
9356AD Tolbert
€ 369.000 k.k.
€ 2.928/m²
9356DK Tolbert
€ 485.000 k.k.
€ 3.415/m²
9356ES Tolbert
€ 395.000 k.k.
€ 3.558/m²
9356CP Tolbert
€ 389.500 k.k.
€ 3.042/m²
9356VA Tolbert
€ 549.000 k.k.
€ 4.575/m²
9356CM Tolbert
€ 325.000 k.k.
€ 3.282/m²
9356DJ Tolbert
€ 460.000 k.k.
€ 2.754/m²
9356TB Tolbert
€ 925.000 k.k.
€ 2.974/m²
9356EG Tolbert
€ 315.000 k.k.
€ 2.971/m²
9356BL Tolbert
€ 315.000 k.k.
€ 2.480/m²
9356CD Tolbert
€ 345.000 k.k.
€ 0/m²
9356AD Tolbert
€ 375.000 k.k.
€ 0/m²
9356BK Tolbert
€ 425.000 k.k.
€ 0/m²
Bekijk recente verkopen en ontvang gratis offertes van lokale makelaars. Vergelijk meer dan 23 makelaars in Tolbert.
Zelf je woning verkopen in Tolbert? Vergelijk verkoopmakelaars in Tolbert of bekijk de beste verkoopmakelaars in Tolbert als referentie bij jouw keuze.
Makelaars maken scherpere voorstellen als ze weten dat je vergelijkt — vraag offertes aan voor verkoop of aankoop.
Short answers about housing prices, sold homes and comparing real estate agents in Tolbert.
De kosten van een makelaar in Tolbert verschillen per kantoor, woningtype en verkoopaanpak. In Tolbert kun je 23 real estate agents vergelijken; bekijk daarom ook de makelaars in Tolbert om tarieven, presentatie en lokale ervaring beter naast elkaar te zetten.
On this page we currently show 37 sold houses in Tolbert from our selection. This helps you to better assess recent transactions and the local housing market.
Houses sold in Tolbert give insight into asking prices, house types and neighborhoods where recent transactions have taken place. Compare this also with the current housing stock in Tolbert to better understand the market.
You can use sold homes as a first market indication, but a local real estate agent can better take into account finishing, location, maintenance and current demand in Tolbert.
Vergelijk de 23 real estate agents in Tolbert op lokale verkoopervaring, reviews, verwachte opbrengst, courtage en marketingaanpak. Bekijk verkoopmakelaars in Tolbert of de top 10 makelaars in Tolbert om snel sterke kantoren te ontdekken.
View current location data on residents, WOZ development, housing stock, energy consumption, business activity and safety in Tolbert. In 2025 were there 4.243 residents. The average WOZ value in 2025 is EUR 286.563.
These figures help to better assess and compare the housing stock in Tolbert with recent sold homes. Orient yourself then on suitable top real estate agents in Tolbert for sales advice in this region.
Residents
4.243
Last year: 2025
Average WOZ
EUR 286.563
Last year: 2025
Average income per person.
EUR 213
Source: AllNumbers
Crimes (current year)
86
Total registered
| Year | Residents |
|---|---|
| 2021 | 4.262 |
| 2022 | 4.239 |
| 2023 | 4.251 |
| 2024 | 4.225 |
| 2025 | 4.243 |
| Year | Average WOZ |
|---|---|
| 2021 | EUR 209.388 |
| 2022 | EUR 229.315 |
| 2023 | EUR 264.448 |
| 2024 | EUR 260.463 |
| 2025 | EUR 286.563 |
Hoger
872
Praktisch
721
Middelbaar
1.551
Europa
141
Nederland
3.746
Buiten Europa
354
Label C
692
Label B
469
Label A
354
Label G
132
Label A++
119
Label D
113
Label A+
87
Label F
79
Label A+++
70
Label E
29
Label A++++
2
Label A+++++
0
| Year | Gas (m3) | Electricity (kWh) |
|---|---|---|
| 2020 | 1.331 | 2.691 |
| 2021 | 1.446 | 2.717 |
| 2022 | 1.136 | 2.505 |
| 2023 | 934 | 2.413 |
| 2024 | 874 | 2.508 |
Hoekwoning
Gas: 898 • Electricity: 2.112
Huurwoning
Gas: 801 • Electricity: 1.811
Koopwoning
Gas: 992 • Electricity: 2.720
Appartement
Gas: 565 • Electricity: 1.608
Tussenwoning
Gas: 838 • Electricity: 2.004
Vrijstaande woning
Gas: 1.189 • Electricity: 3.094
Twee-onder-één-kap woning
Gas: 941 • Electricity: 2.647
Total number of company establishments: 482
| Period | Crimes |
|---|---|
| jan 2025 | 4 |
| jan 2026 | 8 |
| jul 2025 | 6 |
| jun 2025 | 20 |
| mei 2025 | 7 |
| mrt 2025 | 4 |
| nov 2024 | 5 |
| nov 2025 | 2 |
| okt 2024 | 7 |
| okt 2025 | 6 |
| sep 2024 | 7 |
| sep 2025 | 13 |
These figures give an indicative picture of safety trends in the living environment of Tolbert.
Short answers based on current local statistics, handy for a quick comparison of the living environment.
Tolbert telt in 2025 ongeveer 4.243 inwoners.
De gemiddelde WOZ-waarde in Tolbert is in 2025 circa € 286.563.
Het gemiddelde inkomen per inwoner in Tolbert ligt rond € 213 per jaar.
Voor het huidige jaar gaat het om ongeveer 86 geregistreerde misdrijven. Gebruik deze cijfers als indicatie en vergelijk trends per periode.
In Tolbert komt vooral "Vrijstaande woningen" veel voor, met ongeveer 556 woningen.