- Sold
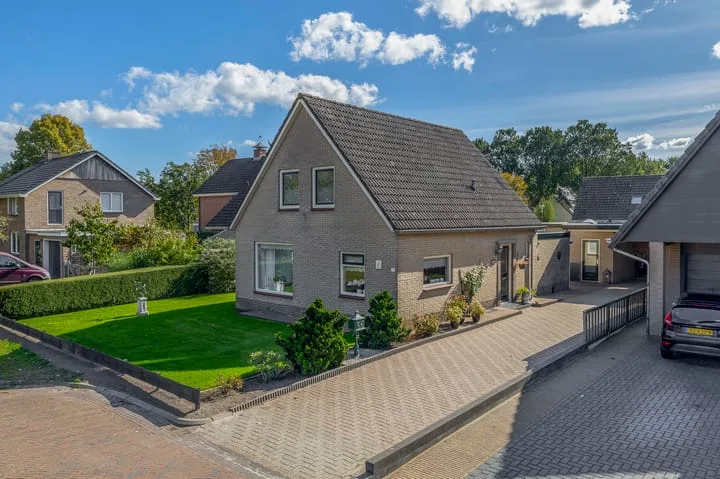
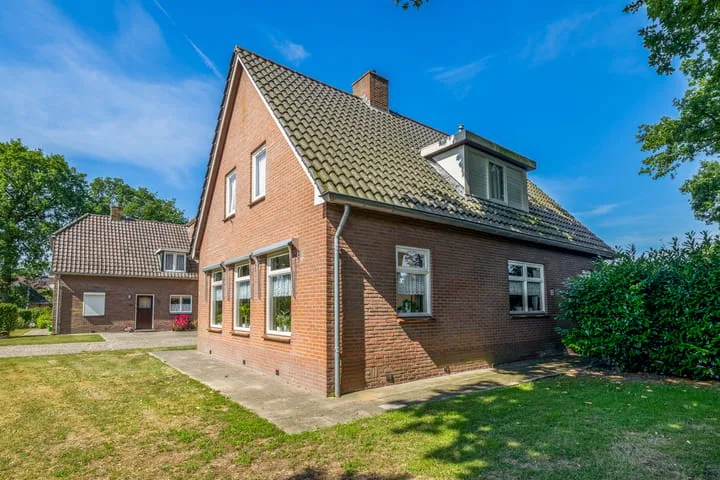
Egginkstraat 8
7975PG Uffelte
€ 495.000 k.k.
€ 4.194/m²
C
Save as favorite
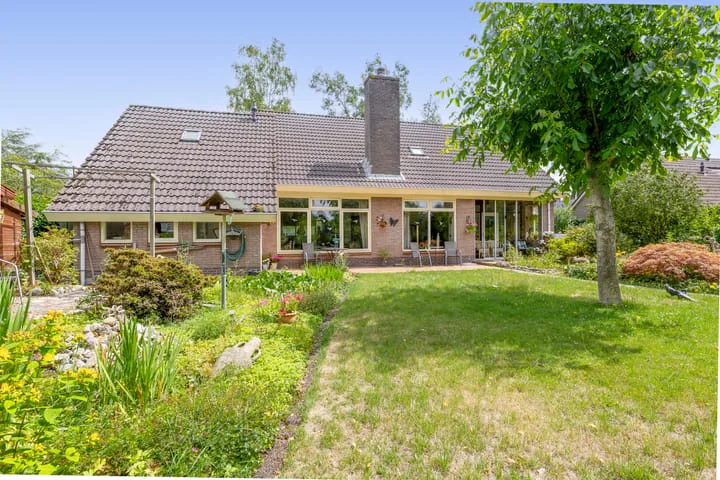
- Living area
- 118 m²
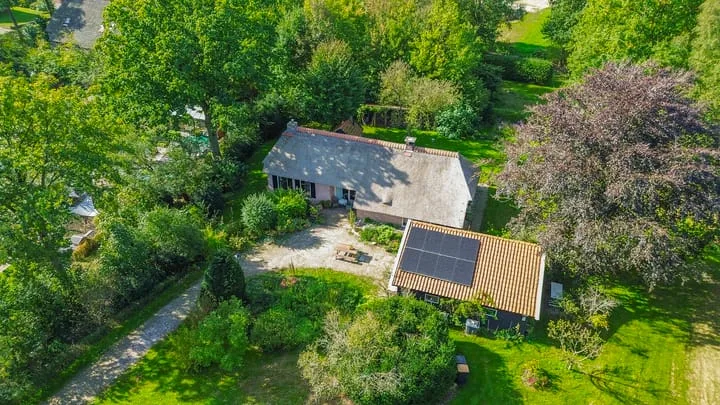
- Land area
- 1085 m²
- Bedrooms
- 5