
Residents
325.510
Last year: 2025
3513AP Utrecht • Utrecht
€ 395.000 k.k.
Cost of copper (estimated): € 9.750
2% transfer tax (€ 7.900) + notary (€ 1.150) + valuation (€ 700)
Total incl. VAT: € 404.750
Purchase price /m²: € 6.810
Beverstraat 35 in Utrecht is een volledig gerenoveerde benedenwoning die combinatie van stadse charme en moderne comfort biedt. Met drie kamers, waarvan twee slaapkamers, een moderne keuken met inbouwapparatuur en een strakke badkamer voorzien van een inloopdouche, is de woning instapklaar en ideaal voor starters of jonge professionals. Uitkomst is een strakke indeling met houten visgraatvloer en moderne kleurstelling. Vanuit de woonkamer leidt een openslaande deur rechtstreeks naar de eigen patiotuin, een zeldzame luxe in het stadscentrum. De woning ligt op de begane grond en biedt toegang tot een levendige wijk waar alle voorzieningen binnen handbereik zijn. De woning staat op een sfeervolle locatie met korte afstand naar het centrum van Utrecht en is gelegen in een straat waar gezelligheid, culinair aanbod en openbaar vervoer samenkomen. Er is geen VvE, het gebouw is instapklaar en beschikt over een gebruiksoppervlakte van ongeveer 58 m². De patiotuin biedt een rustige buitenruimte midden in de stad, ideaal voor ontspanning of sociale momenten. Met deze kenmerken is Beverstraat 35 een fraaie keuze voor wie op zoek is naar comfortabele en centraal gelegen woning in een sfeervolle omgeving.
€ 395.000
Cost of copper (estimated): € 9.750
2% transfer tax (€ 7.900) + notary (€ 1.150) + valuation (€ 700)
Total purchase (incl. p.p.): € 404.750
2,78%
Yearly
€ 19.750
Direct available
Estimated mortgage
Indicative gross monthly cost
Based on annuity and 30 year term
Indicative net monthly cost
iDisclaimer: this mortgage calculation is a simplified indication based on general assumptions. No rights can be derived from the results shown. Calculated with 10-annual interest (met NHG), automatically determined based on the price limit € 470.000. Source: 10-jaars rente uit mortgage_rates (01-05-2026 03:45).
Inloopdouche en wastafel
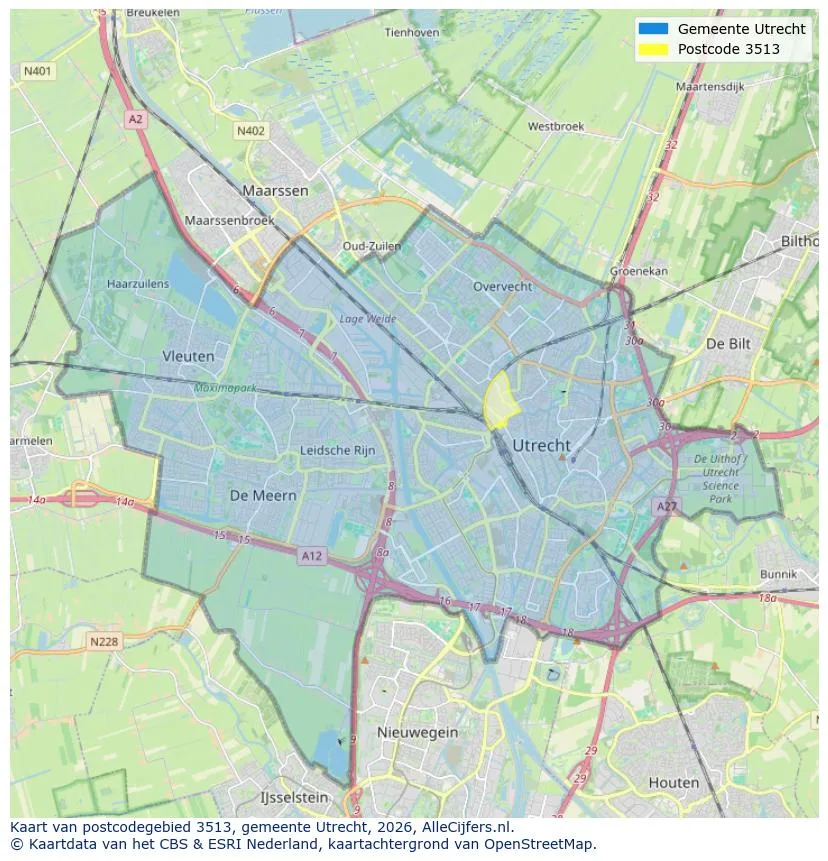
Explore Utrecht and the surrounding areas
View current location data on residents, WOZ development, housing stock, energy consumption, business activity and safety in Utrecht. In 2025 were there 325.510 residents. The average WOZ value in 2025 is EUR 474.416.
Residents
325.510
Last year: 2025
Average WOZ
EUR 474.416
Last year: 2025
Average income per person.
EUR 38.255
Source: AllNumbers
Crimes (current year)
25.985
Total registered
| Year | Residents |
|---|---|
| 2021 | 308.685 |
| 2022 | 310.610 |
| 2023 | 316.460 |
| 2024 | 323.020 |
| 2025 | 325.510 |
| Year | Average WOZ |
|---|---|
| 2021 | EUR 349.277 |
| 2022 | EUR 381.193 |
| 2023 | EUR 442.579 |
| 2024 | EUR 435.454 |
| 2025 | EUR 474.416 |
Hoger
148.860
Praktisch
45.840
Middelbaar
67.680
Europa
37.515
Nederland
186.915
Buiten Europa
101.045
Label A
47.799
Label C
25.699
Label B
17.523
Label D
13.066
Label F
12.655
Label G
11.728
Label E
11.306
Label A+
9.677
Label A++
5.013
Label A+++
4.232
Label A++++
725
Label A+++++
21
| Year | Gas (m3) | Electricity (kWh) |
|---|---|---|
| 2020 | 664 | 2.253 |
| 2021 | 740 | 2.328 |
| 2022 | 572 | 2.170 |
| 2023 | 484 | 2.028 |
| 2024 | 468 | 2.042 |
Hoekwoning
Gas: 791 • Electricity: 2.601
Huurwoning
Gas: 421 • Electricity: 1.821
Koopwoning
Gas: 587 • Electricity: 2.316
Appartement
Gas: 368 • Electricity: 1.760
Tussenwoning
Gas: 700 • Electricity: 2.361
Vrijstaande woning
Gas: 1.325 • Electricity: 3.953
Twee-onder-één-kap woning
Gas: 898 • Electricity: 3.142
Total number of company establishments: 55.750
| Period | Crimes |
|---|---|
| jan 2025 | 1.938 |
| jan 2026 | 2.042 |
| jul 2025 | 2.284 |
| jun 2025 | 2.296 |
| mei 2025 | 2.085 |
| mrt 2025 | 2.095 |
| nov 2024 | 2.183 |
| nov 2025 | 2.313 |
| okt 2024 | 2.124 |
| okt 2025 | 2.340 |
| sep 2024 | 1.881 |
| sep 2025 | 2.221 |
These figures give an indicative picture of safety trends in the living environment of Utrecht.
Short answers based on current local statistics, handy for a quick comparison of the living environment.
Utrecht telt in 2025 ongeveer 325.510 inwoners.
De gemiddelde WOZ-waarde in Utrecht is in 2025 circa € 474.416.
Het gemiddelde inkomen per inwoner in Utrecht ligt rond € 38.255 per jaar.
Voor het huidige jaar gaat het om ongeveer 25.985 geregistreerde misdrijven. Gebruik deze cijfers als indicatie en vergelijk trends per periode.
In Utrecht komt vooral "Appartementen" veel voor, met ongeveer 108.137 woningen.
View more homes in this location.

3553CX Utrecht
€ 599.000 k.k.

3515VN Utrecht
€ 370.000 k.k.

3515AK Utrecht
€ 3.095 p/m
€ 21/m²

3582DS Utrecht
€ 1.450.000 k.k.

3544VX Utrecht
€ 975.000 k.k.

3573XP Utrecht
€ 925.000 k.k.

3512XM Utrecht
€ 895.000 k.k.

3541DZ Utrecht
€ 795.000 k.k.
