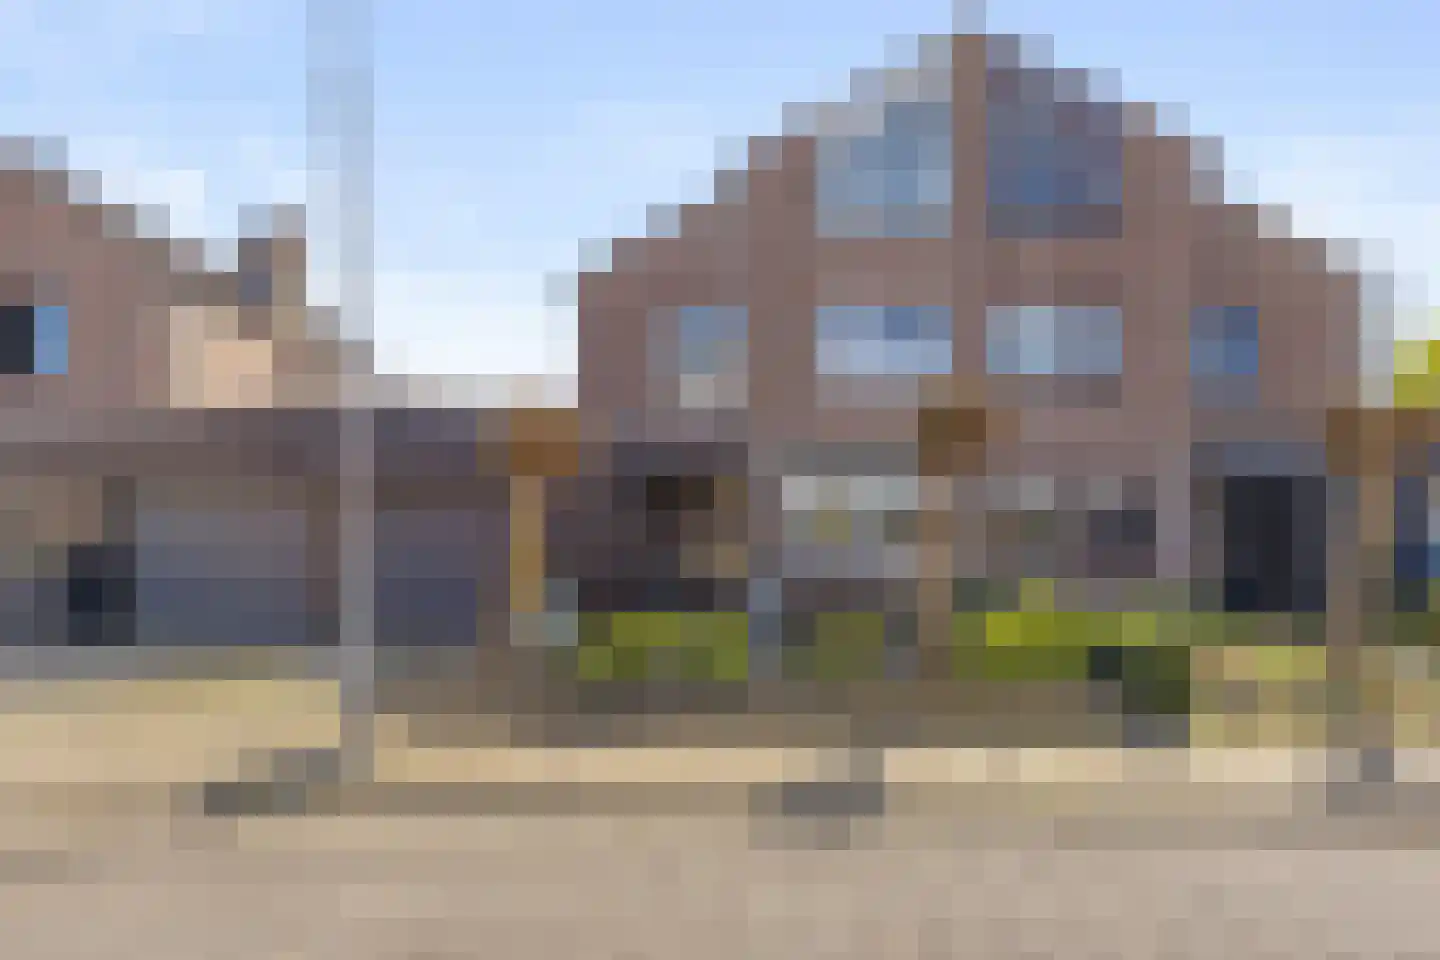
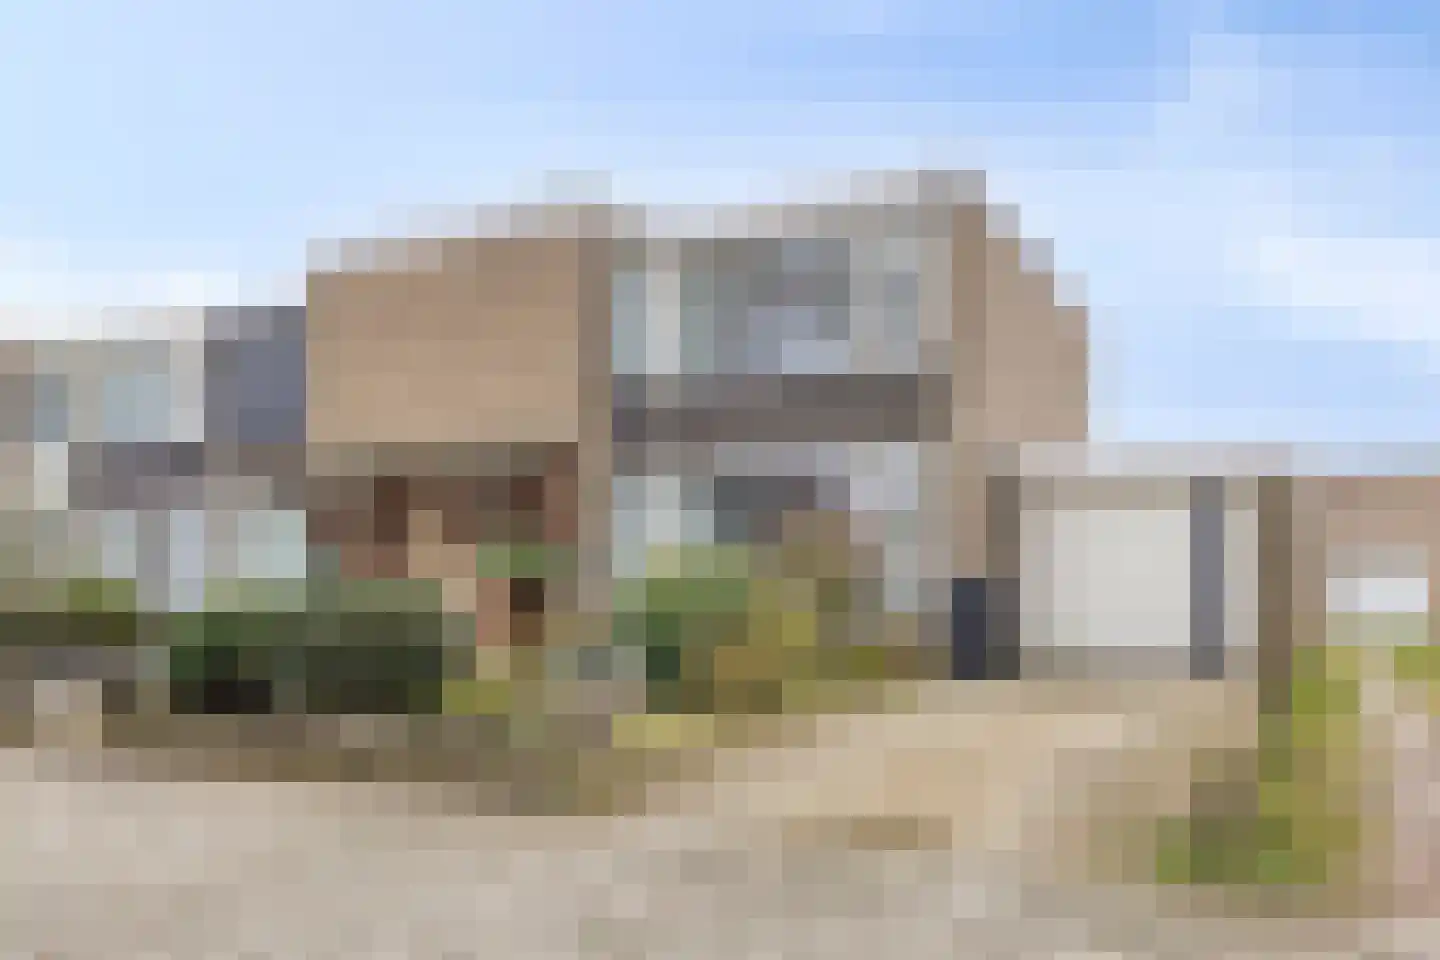
Houses sold in Valkenswaard

View 352 sold houses in Valkenswaard

Connected to: Vastgoed Nederland NVM Makelaars

On this page you will find recently sold homes in Valkenswaard. Use this overview to better estimate selling prices, popular neighborhoods, and the local housing supply before you choose a real estate agent. Also view the current housing supply with 500 houses in Valkenswaard.

Selection

Search and filter homes

Set your preferences and discover homes that suit you.

Total supply 240.123
Filters

Set price, area and other characteristics. Adjust a filter or click on Show homes. Location changes directly above.

Reset filters

You search for

  • Place Valkenswaard
  • Status Sold

Selling a home in Valkenswaard? Compare realtor offers

Get free quotes from realtors with local market knowledge in Valkenswaard.

Free request a quote

  • Quotes in Valkenswaard
  • Non-binding
  • Personal
  • Free property website

Selling a home in Valkenswaard? Compare real estate agents who know the local housing market. Also check out all real estate agents in Valkenswaard or the top 10 real estate agents in Valkenswaard for extra context for your choice.

Save an average of €5000,-

By comparing brokers and requesting quotes

Frequently asked questions about sold homes in Valkenswaard

Short answers about housing prices, sold homes and comparing real estate agents in Valkenswaard.

Residential and neighborhood statistics in Valkenswaard

View current location data on residents, WOZ development, housing stock, energy consumption, business activity and safety in Valkenswaard. In 2026 were there 31.912 residents. The average WOZ value in 2025 is EUR 419.000.

These figures help to better assess and compare the housing stock in Valkenswaard with recent sold homes. Orient yourself then on suitable top real estate agents in Valkenswaard for sales advice in this region.

Residents

31.912

Last year: 2026

Average WOZ

EUR 419.000

Last year: 2025

Average income per person.

EUR 35.200

Source: AllNumbers

Crimes (current year)

1.000

Total registered

Demographics and WOZ development

Inhabitants per year

Inhabitants per year in Valkenswaard
Year Residents
2022 31.236
2023 31.527
2024 31.714
2025 31.955
2026 31.912

Annual WOZ value

WOZ value per year in Valkenswaard
Year Average WOZ
2021 EUR 301.000
2022 EUR 326.000
2023 EUR 360.000
2024 EUR 381.000
2025 EUR 419.000

Composition of residents

Age build-up

65+: 8.502 0-15: 4.320 15-25: 3.076 25-45: 7.607 45-65: 8.450

Education level

Hoger

31

Praktisch

27

Middelbaar

42

Origin of residents (2025)

Europa

2.822

Nederland

25.976

Buiten Europa

3.157

Housing stock and construction periods

Types of homes

Hoekwoningen 2.709
Appartementen 3.908
Tussenwoningen 5.150
Vrijstaande woningen 1.990
Twee-onder-één-kap woningen 1.939

Construction period of buildings

Voor 1700 0
1700 tot 1900 82
1900 tot 1925 290
1925 tot 1950 1.438
1950 tot 1970 3.901
1970 tot 1980 2.515
1980 tot 1990 2.452
1990 tot 2000 1.046
2000 tot 2010 662
2010 tot 2020 705
2020 en later 515

Energy and sustainability

Energy label distribution

Label A

4.306

Label C

4.052

Label B

2.629

Label D

1.250

Label G

935

Label E

779

Label F

725

Label A+++

469

Label A+

395

Label A++

245

Label A++++

92

Label A+++++

6

Average energy consumption per year

Average energy consumption per year in Valkenswaard
Year Gas (m3) Electricity (kWh)
2020 1.250 2.990
2021 1.400 3.000
2022 1.100 2.790
2023 920 2.660
2024 880 2.730

Consumption per house type

Hoekwoning

Gas: 980 • Electricity: 2.650

Huurwoning

Gas: 720 • Electricity: 2.000

Koopwoning

Gas: 1.050 • Electricity: 3.090

Appartement

Gas: 550 • Electricity: 1.890

Tussenwoning

Gas: 880 • Electricity: 2.470

Vrijstaande woning

Gas: 1.480 • Electricity: 4.210

Twee-onder-één-kap woning

Gas: 1.120 • Electricity: 3.120

Business activity in Valkenswaard (2025)

Handel en HORECA 785
Nijverheid en energie 710
Zakelijke dienstverlening 990
Overheid, onderwijs en zorg 620
Landbouw, bosbouw en visserij 85
Vervoer, informatie en communicatie 215
Financiele diensten en onroerendgoed 250
Cultuur, recreatie en overige diensten 445

Total number of company establishments: 4.100

Recent crime statistics

Recent crime statistics in Valkenswaard
Period Crimes
jan 2025 91
jan 2026 55
jul 2025 85
jun 2025 66
mei 2025 84
mrt 2025 111
nov 2024 91
nov 2025 68
okt 2024 103
okt 2025 95
sep 2024 98
sep 2025 88

These figures give an indicative picture of safety trends in the living environment of Valkenswaard.

Frequently asked questions about living in Valkenswaard

Short answers based on current local statistics, handy for a quick comparison of the living environment.

Hoeveel inwoners heeft Valkenswaard?

Valkenswaard telt in 2026 ongeveer 31.912 inwoners.

Wat is de gemiddelde WOZ-waarde in Valkenswaard?

De gemiddelde WOZ-waarde in Valkenswaard is in 2025 circa € 419.000.

Wat is het gemiddelde inkomen per inwoner in Valkenswaard?

Het gemiddelde inkomen per inwoner in Valkenswaard ligt rond € 35.200 per jaar.

Hoe veilig is wonen in Valkenswaard?

Voor het huidige jaar gaat het om ongeveer 1.000 geregistreerde misdrijven. Gebruik deze cijfers als indicatie en vergelijk trends per periode.

Welke woningtypen komen het meest voor in Valkenswaard?

In Valkenswaard komt vooral "Tussenwoningen" veel voor, met ongeveer 5.150 woningen.