Met Ons Makelaars

With Ons Makelaars, we offer a personal and trustworthy approach when buying or selling a home. We help you find the right match, whether as a seller or buyer. Instead of focusing solely on numbers and square footage, we look at what truly matters for your living happiness. Think about space to live, sun in the garden or a neighborhood where you meet new people. We understand that living is more than just a house. Our approach is based...
Current housing stock
-

- Available
Meerstraat 16
5552JE Valkenswaard
€ 600.000 k.k.
€ 4.478/m²
ASave as favorite- Living area
- 134 m²
- Land area
- 405 m²
- Bedrooms
- 4
-

- Available
Bunderstraat 26
5555CN Valkenswaard
€ 589.000 k.k.
€ 3.681/m²
CSave as favorite- Living area
- 160 m²
- Land area
- 158 m²
- Bedrooms
- 5
-
- Available
Dommelseweg 84
5554NT Valkenswaard
€ 315.000 k.k.
€ 2.838/m²
GSave as favorite- Living area
- 111 m²
- Land area
- 288 m²
- Bedrooms
- 3
-

- Available
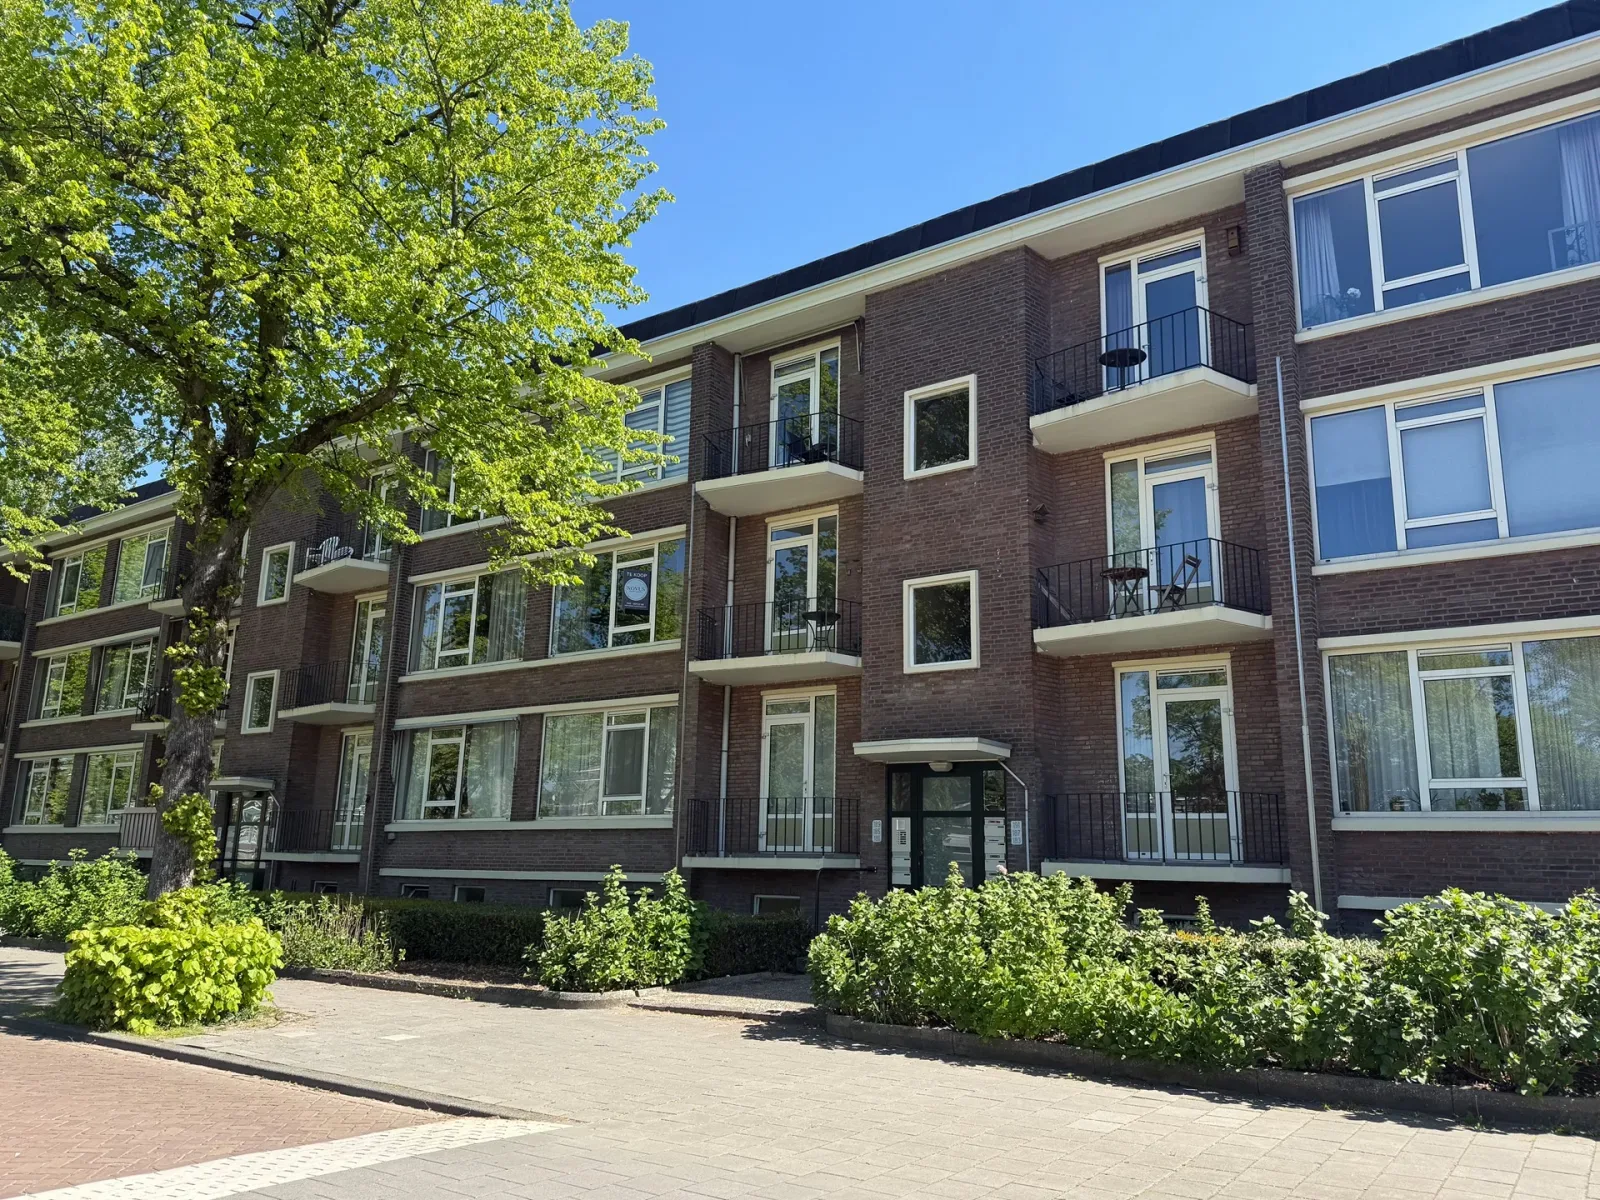
Corridor 37 C
5554HL Valkenswaard
€ 309.500 k.k.
€ 3.968/m²
CSave as favorite- Living area
- 78 m²
- Land area
- —
- Bedrooms
- 2
-

- Available
Unastraat 73
5552BM Valkenswaard
€ 650.000 k.k.
€ 5.200/m²
BSave as favorite- Living area
- 125 m²
- Land area
- 239 m²
- Bedrooms
- 3
-

- Available
Heistraat 9
5554EN Valkenswaard
€ 569.000 k.k.
€ 4.822/m²
DSave as favorite- Living area
- 118 m²
- Land area
- 282 m²
- Bedrooms
- 3
Reviews (188)
Review platforms
BronscoresTotal score
188 total reviews

Funda
97 reviews on Funda

91 reviews on Google
-
Dommelseweg 55
8Translated by AIHad a good contact with Olaf. Was kept well informed by the office about every activity. Although the interest in my house somewhat declined (few viewings) the sale eventually went smoothly to satisfaction. I would certainly recommend this real estate agent.
-
Lysanne van Oorschot
10Translated by AISuper fine help from Roel! From the beginning to the end of the entire process, everything went smoothly and easily. Short lines in terms of communication and we could always ask questions! I recommend Met Ons Makelaars to everyone!
-
Daalderhof 3
10Translated by AIVery satisfied! We were well assisted in all areas. We could ask anything and had short lines. Everything was clear and well organized! Top!
-
Dommelseweg 122
10Translated by AIWe have taken you step by step from the beginning (buy new home) to the end (sell own home) through the process. Everything has been clearly explained, discussed and gone through together. We highly recommend this real estate agent!
-
Hennie Kuijpers
10Translated by AIRoel has well guided and supported us throughout the entire sales process. Fast and good communication and expertise during viewings.
-
Schafterdijk 4
10Translated by AIRoel guided us well through the entire sales process. Kept us well informed, good and fast communication. Demonstrated expertise during viewings, in short, our worries were eased.
-
Brouwerijdreef 20
10Translated by AIWe sold our house with real estate agent Roel, a super nice, honest and reliable real estate agent. He keeps his appointments and does what he promises, furthermore he reacts quickly to messages and to all questions. In short, really recommended because of his good service.
-
Leonardusdal 85
8Translated by AIGood work delivered, you are always well kept informed I recommend this real estate agent for Valkenswaard and surroundings.
-
Warande 55
10Translated by AIVery nice real estate agent. Gave us a great advice and kept us constantly informed. We recommend this real estate agent to everyone. Thank you Olaf!!!
-
Robin Elich
10 -
Reisvennestraat 63
9Translated by AIHad a great contact, was well informed about the real estate market. Reacted very quickly to questions. Takes a lot off your hands and thinks along well! Super Real Estate Office!!
-
de Kortveter 74
10Translated by AII am very satisfied with the cooperation with this real estate agent, I was helped very well. It is a professional real estate agent that I can definitely recommend.
-
Escudohof 9
9Translated by AIGreat help and really thought through. Competent and involved. Guidance from a to z and always indicating what the next step is. Working as a team as well.
-
Korfakker 76
10Translated by AIVery nice real estate agent. Roel is reliable, communicative and just a nice guy. I was well guided during the process and Roel has advised me well. I look back on a top collaboration!
-
Rob Vlassak
10Translated by AIRoel has excellently and very professionally accompanied us throughout the entire process. By quickly switching and even making time on Sunday for a viewing, the house was sold very quickly. I would recommend Roel to everyone.
-
Voermanwei 16
8Translated by AIRoel is a nice real estate agent. He matches well with me on multiple areas. He is always reachable and will explain everything, especially as selling a house can bring with it unrest/anxiety and stress. The team is willing to support you in that and that works very nicely for me.
-
Dommelstraat 9
10Translated by AIOlaf accompanied us fantastically, assertive, beautiful sales brochure, kept us constantly informed. Made an honest open and sincere impression, a quality not all realtors have. In short he was top
-
Havik 20
10Translated by AIThe sale of my home was professionally and efficiently managed by MetOns Makelaar. Clear agreements, strong market knowledge and an excellent price-quality ratio. Exactly what you expect from a good real estate agent – and more. I am optimally grateful to them.
-
Dommelseweg 118
10Translated by AIRoel has excellently and very professionally accompanied us throughout the entire process. By quickly switching and even making time on Sunday for a viewing, the house was sold very quickly. I would recommend Roel to everyone.
-
Hofstraat 20
10Translated by AISuper guidance through our step of selling our house after 20 years to a new place. Professional guidance both from Olaf and Roel.