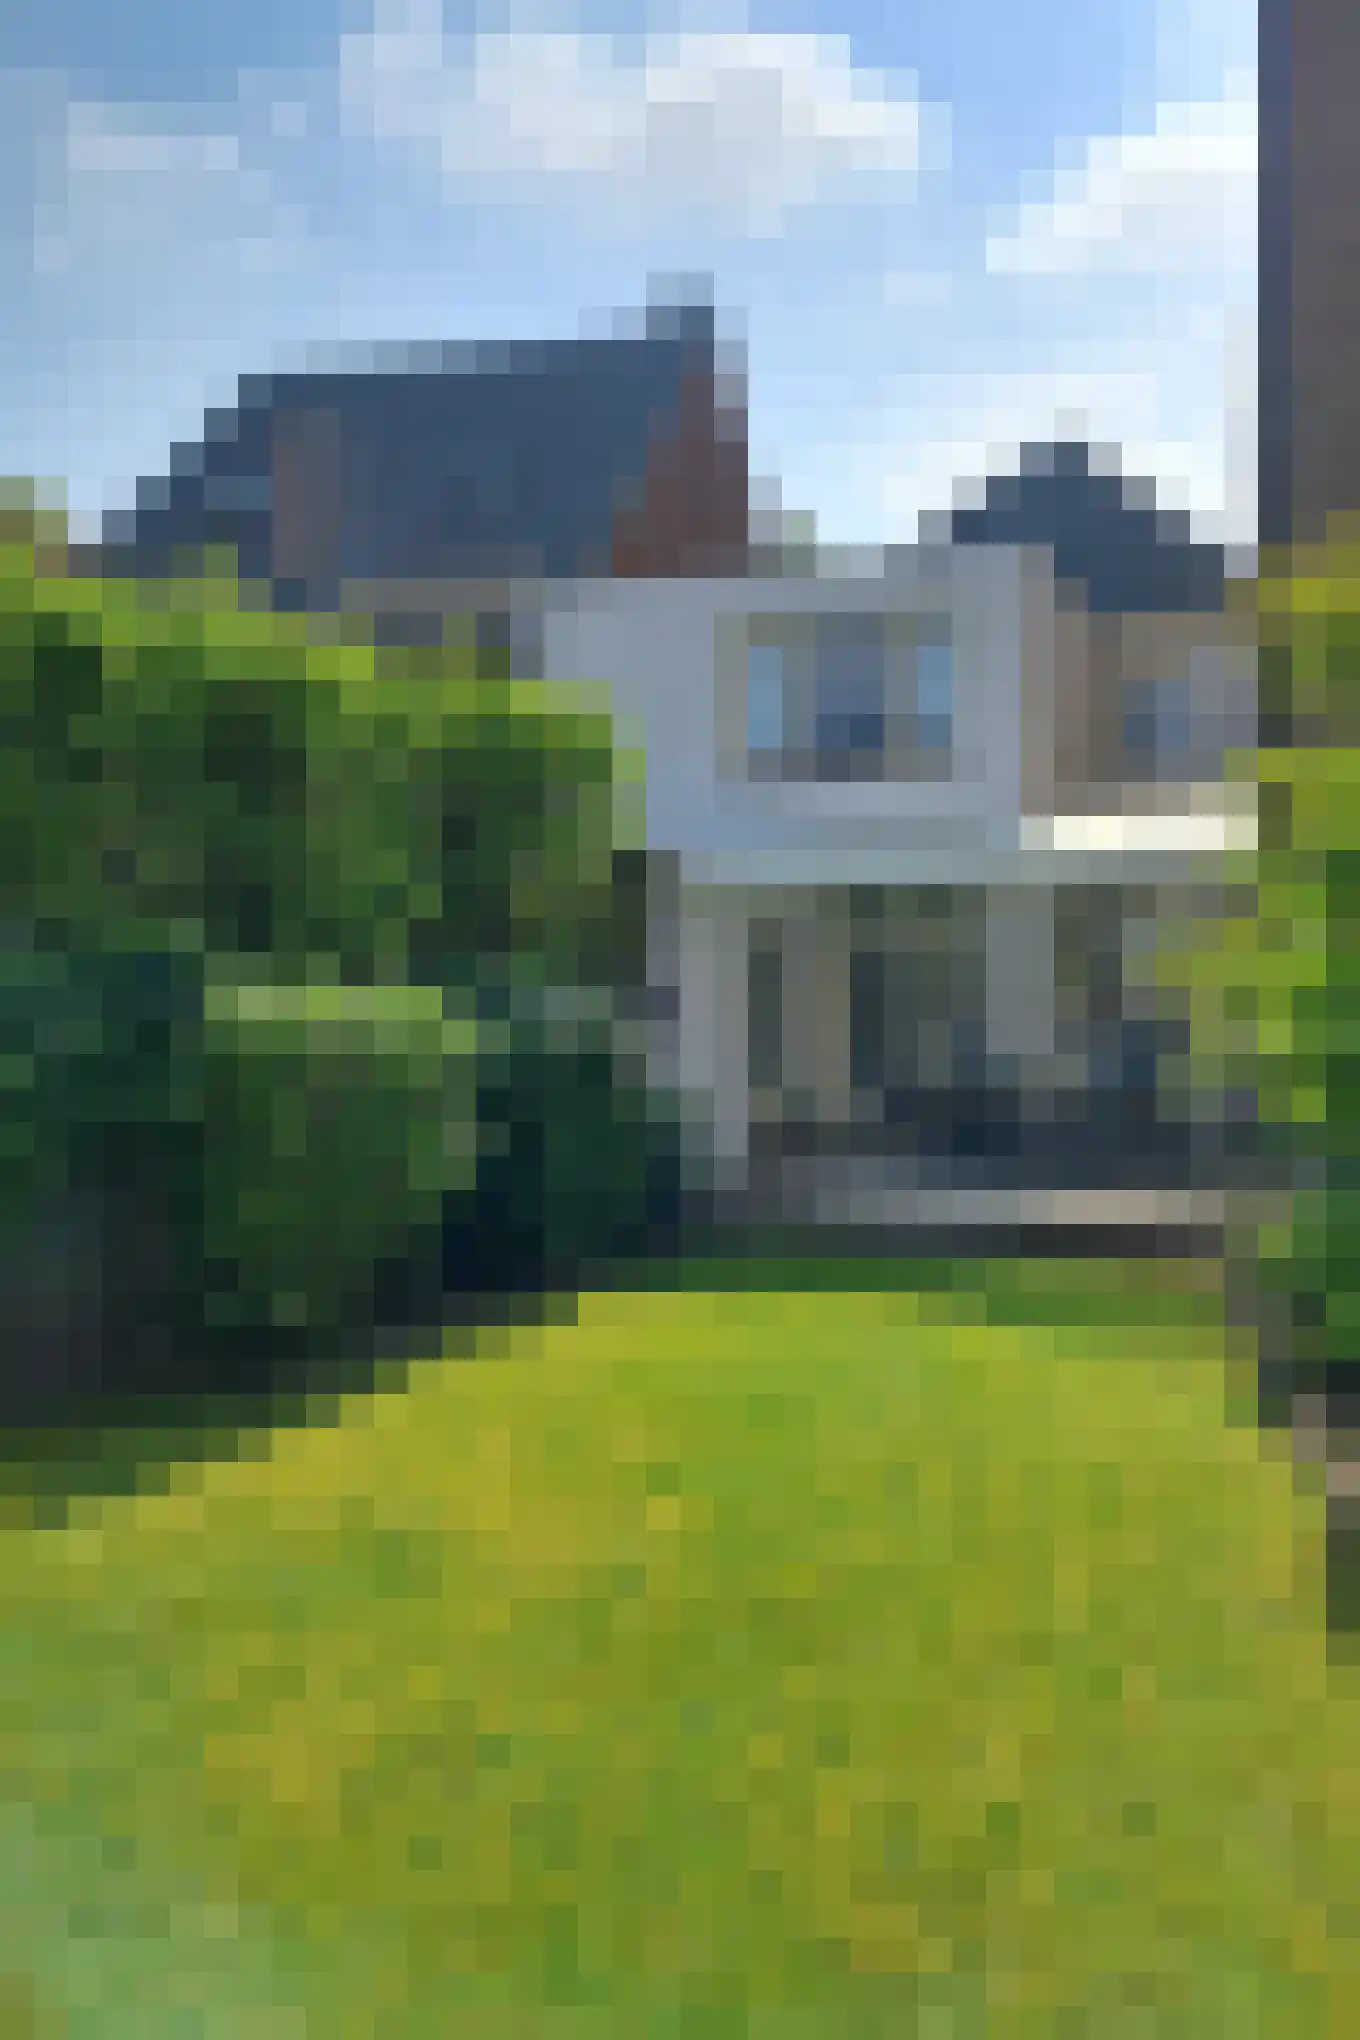
- Available
Terborgh 29
6002XL Weert
€ 375.000 k.k.
€ 2.841/m²
- Living area
- 132 m²
- Land area
- 150 m²
- Bedrooms
- 3
Searching in 682 houses in Weert
Type to search. Use arrow down and arrow up to navigate through results and press Enter to open.
Hidden search suggestions.
View current properties in Weert or search targeted on street, postal code and property characteristics.
View the current housing stock in Weert and quickly filter by price, living area, rooms and more. There are currently 682 houses in this place within our selection. View also 501 sold houses in Weert for extra insight into the local housing market.
6002XL Weert
€ 375.000 k.k.
€ 2.841/m²
6001HM Weert
€ 350.000 k.k.
€ 4.730/m²
6001AW Weert
€ 365.000 k.k.
6004JC Weert
€ 335.000 k.k.
6005SC Weert
€ 525.000 k.k.
6004AN Weert
€ 625.000 k.k.
6005KP Weert
€ 389.000 k.k.
6006SP Weert
€ 1.750.000 k.k.
€ 4.755/m²
6002BC Weert
€ 720.000 k.k.
€ 2.963/m²
6001WV Weert
€ 489.000 k.k.
€ 4.842/m²
6002TW Weert
€ 429.500 k.k.
€ 3.492/m²
6002ST Weert
€ 406.800 k.k.
6003BW Weert
€ 425.000 k.k.
€ 4.048/m²
6006PR Weert
€ 775.000 k.k.
€ 5.420/m²
6006KT Weert
€ 289.000 k.k.
6006PT Weert
€ 360.000
€ 5.070/m²
6004GK Weert
€ 359.000 k.k.
€ 3.779/m²
6003CW Weert
€ 585.000 k.k.
€ 3.656/m²
6001BC Weert
€ 550.000 k.k.
€ 3.333/m²
6003BK Weert
€ 749.000 k.k.
€ 5.130/m²
6006NV Weert
€ 319.000 k.k.
€ 4.311/m²
6001VL Weert
€ 285.000 k.k.
€ 2.522/m²
6001VL Weert
€ 275.000 k.k.
€ 2.594/m²
6003NA Weert
€ 345.000 k.k.
€ 3.557/m²
6001VX Weert
€ 450.000 k.k.
€ 3.214/m²
6006NX Weert
€ 489.000 k.k.
€ 3.791/m²
6004NX Weert
€ 445.000
€ 5.000/m²
6004NX Weert
€ 489.000
€ 4.109/m²
Get free quotes from real estate agents with local market knowledge. Compare more than 22 real estate agents in Weert.
Selling a home in Weert? View the sales-oriented guide sell a house in Weert, compare all real estate agents in Weert or view the top 10 real estate agents in Weert for extra context to your choice.
Real estate agents make sharper offers when they know you're comparing — ask for quotes for sale or purchase.
Practical answers about housing supply, sales and comparing real estate agents in Weert.
The costs of a real estate agent in Weert depend on commission, setup costs, property presentation and the chosen service. Compare the 22 real estate agents in Weert via the real estate agent page and request multiple quotes to compare rates and approach well.
Within our selection, we are currently showing 682 houses in Weert. View also the sold houses in Weert to compare the current offering with recent transactions.
Take into account not only price and living area but also maintenance, energy label, location, outdoor space and sales status. This way you compare houses in Weert on more than just the asking price.
A local real estate agent knows the neighborhoods, recent transactions and demand in Weert. By comparing 22 real estate agents in the region you get a better insight into prices, sales strategy and expected yield; the top 10 in Weert provides a useful starting point.
Yes, when making a sales plan, a valuation in Weert is wise. You gain insight into a realistic asking price and can then compare offers from real estate agents specifically.
View current location data on residents, WOZ development, housing stock, energy consumption, business activity and safety in Weert. In 2025 were there 46.170 residents. The average WOZ value in 2025 is EUR 356.874.
These figures help to better assess and compare the housing stock in Weert with recent sold homes. Orient yourself then on suitable top real estate agents in Weert for sales advice in this region.
Residents
46.170
Last year: 2025
Average WOZ
EUR 356.874
Last year: 2025
Average income per person.
EUR 26.484
Source: AllNumbers
Crimes (current year)
1.814
Total registered
| Year | Residents |
|---|---|
| 2021 | 44.910 |
| 2022 | 45.140 |
| 2023 | 45.580 |
| 2024 | 45.935 |
| 2025 | 46.170 |
| Year | Average WOZ |
|---|---|
| 2021 | EUR 264.182 |
| 2022 | EUR 275.019 |
| 2023 | EUR 328.613 |
| 2024 | EUR 332.886 |
| 2025 | EUR 356.874 |
Hoger
10.560
Praktisch
9.640
Middelbaar
14.180
Europa
5.290
Nederland
34.005
Buiten Europa
6.895
Label C
5.509
Label A
5.091
Label B
3.831
Label D
2.567
Label F
1.712
Label G
1.526
Label E
1.369
Label A+
394
Label A+++
383
Label A++
300
Label A++++
105
Label A+++++
10
| Year | Gas (m3) | Electricity (kWh) |
|---|---|---|
| 2020 | 1.250 | 2.894 |
| 2021 | 1.385 | 2.941 |
| 2022 | 1.093 | 2.793 |
| 2023 | 893 | 2.666 |
| 2024 | 865 | 2.754 |
Hoekwoning
Gas: 957 • Electricity: 2.711
Huurwoning
Gas: 703 • Electricity: 1.998
Koopwoning
Gas: 998 • Electricity: 2.982
Appartement
Gas: 595 • Electricity: 1.844
Tussenwoning
Gas: 853 • Electricity: 2.485
Vrijstaande woning
Gas: 1.380 • Electricity: 3.874
Twee-onder-één-kap woning
Gas: 1.084 • Electricity: 3.033
Total number of company establishments: 5.930
| Period | Crimes |
|---|---|
| jan 2025 | 117 |
| jan 2026 | 134 |
| jul 2025 | 140 |
| jun 2025 | 167 |
| mei 2025 | 161 |
| mrt 2025 | 159 |
| nov 2024 | 173 |
| nov 2025 | 149 |
| okt 2024 | 204 |
| okt 2025 | 180 |
| sep 2024 | 161 |
| sep 2025 | 189 |
These figures give an indicative picture of safety trends in the living environment of Weert.
Short answers based on current local statistics, handy for a quick comparison of the living environment.
Weert telt in 2025 ongeveer 46.170 inwoners.
De gemiddelde WOZ-waarde in Weert is in 2025 circa € 356.874.
Het gemiddelde inkomen per inwoner in Weert ligt rond € 26.484 per jaar.
Voor het huidige jaar gaat het om ongeveer 1.814 geregistreerde misdrijven. Gebruik deze cijfers als indicatie en vergelijk trends per periode.
In Weert komt vooral "Appartementen" veel voor, met ongeveer 6.248 woningen.