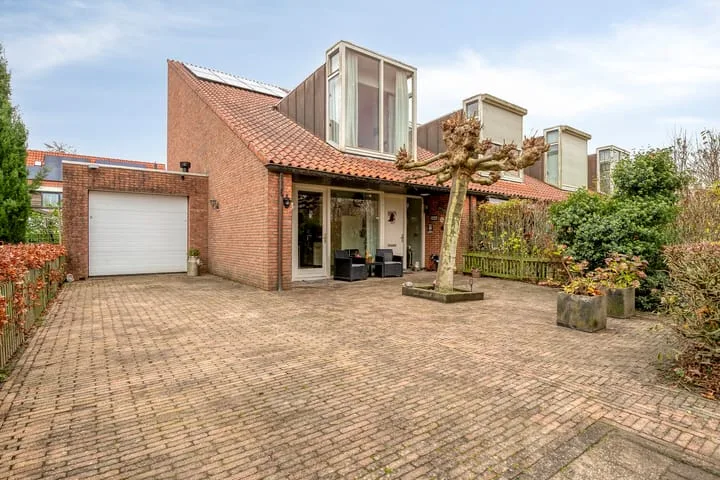
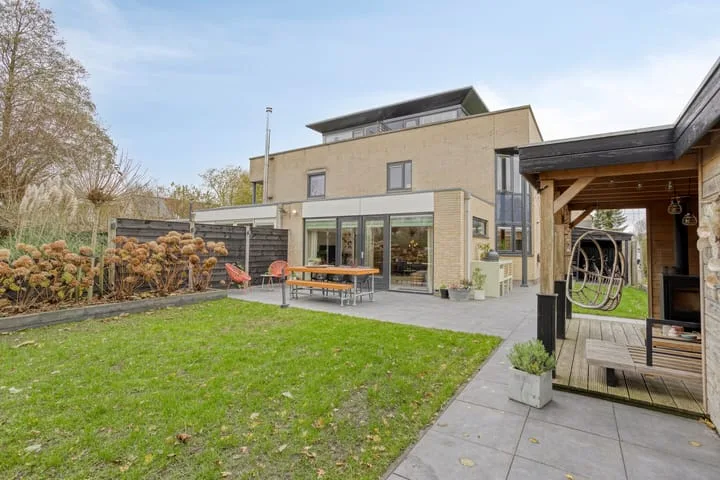
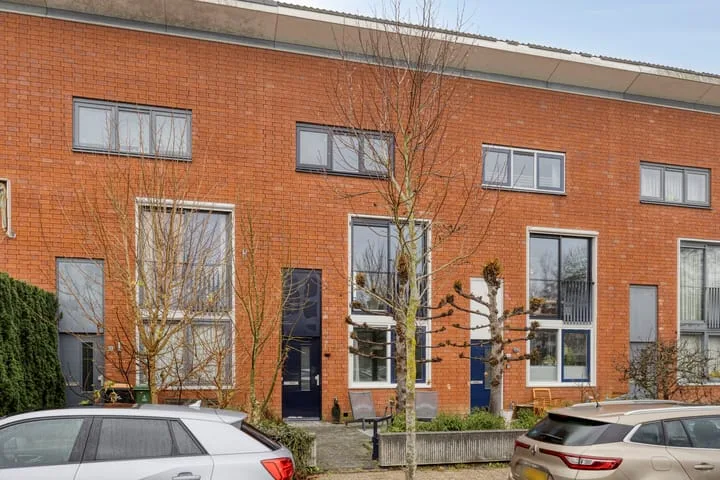
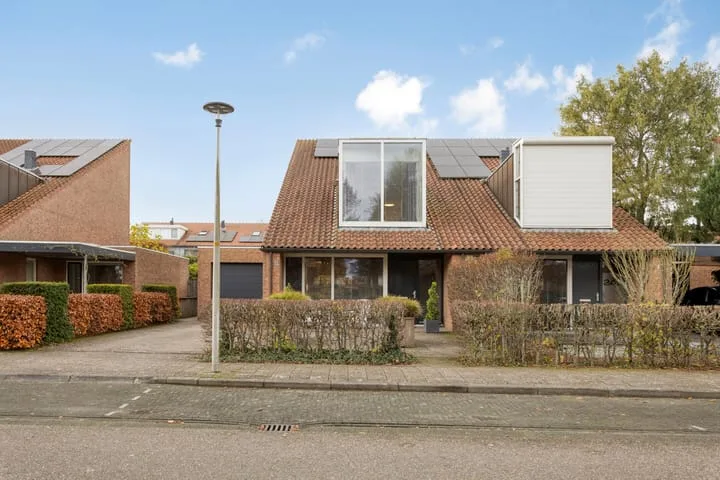
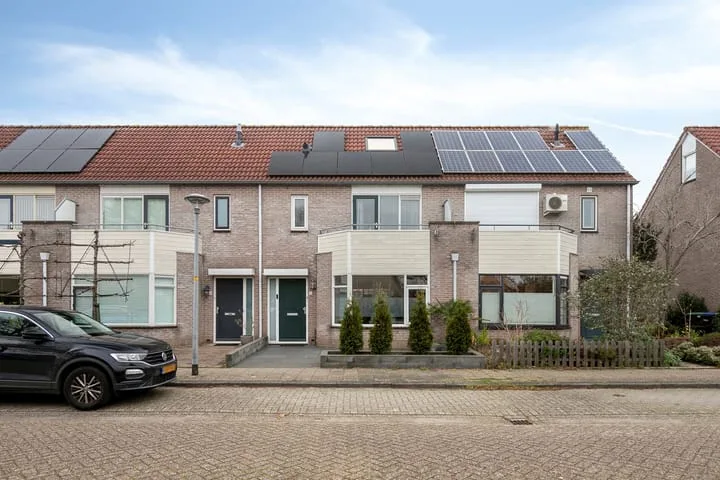
- Sold
Schokker 42
3891DP Zeewolde
€ 429.000 k.k.
€ 3.635/m²
- Living area
- 118 m²
- Land area
- 155 m²
- Bedrooms
- 4
View 275 sold houses in Zeewolde
Type to search. Use arrow down and arrow up to navigate through results and press Enter to open.
Hidden search suggestions.
Compare sold homes in Zeewolde or view the current offering in this location directly.
On this page you will find recently sold homes in Zeewolde. Use this overview to better estimate selling prices, popular neighborhoods, and the local housing supply before you choose a real estate agent. Also view the current housing supply with 401 houses in Zeewolde.
3891DP Zeewolde
€ 429.000 k.k.
€ 3.635/m²
3891ET Zeewolde
€ 339.000 k.k.
€ 3.026/m²
3897LV Zeewolde
€ 400.000 k.k.
€ 2.259/m²
3892EJ Zeewolde
€ 510.000 k.k.
€ 3.834/m²
3894DG Zeewolde
€ 798.000 k.k.
€ 6.045/m²
3891CN Zeewolde
€ 385.000 k.k.
€ 4.425/m²
3893GL Zeewolde
€ 489.000 k.k.
€ 3.676/m²
3893HC Zeewolde
€ 419.500 k.k.
€ 3.745/m²
3893JR Zeewolde
€ 575.000 k.k.
€ 3.938/m²
3898LL Zeewolde
€ 648.000 k.k.
€ 3.145/m²
3891BX Zeewolde
€ 390.000 k.k.
€ 3.823/m²
3892EM Zeewolde
€ 389.000 k.k.
€ 3.851/m²
3893BC Zeewolde
€ 400.000 k.k.
€ 3.278/m²
3892WN Zeewolde
€ 450.000 k.k.
€ 3.879/m²
3893CM Zeewolde
€ 450.000 k.k.
€ 3.750/m²
3891GN Zeewolde
€ 259.500 k.k.
€ 6.329/m²
3892AX Zeewolde
€ 500.000 k.k.
€ 4.629/m²
3892BL Zeewolde
€ 400.000 k.k.
€ 3.508/m²
3894EG Zeewolde
€ 850.000 k.k.
€ 5.247/m²
3894MA Zeewolde
€ 300.000 k.k.
€ 6.250/m²
3893JC Zeewolde
€ 389.000 k.k.
€ 4.138/m²
3892VH Zeewolde
€ 395.000 k.k.
€ 4.072/m²
3891ET Zeewolde
€ 325.000 k.k.
€ 3.779/m²
3893JP Zeewolde
€ 525.000 k.k.
€ 3.220/m²
3892EK Zeewolde
€ 400.000 k.k.
€ 3.418/m²
3893JW Zeewolde
€ 525.000 k.k.
€ 3.947/m²
3893JK Zeewolde
€ 460.000 k.k.
€ 3.538/m²
3893BL Zeewolde
€ 400.000 k.k.
€ 3.252/m²
Bekijk recente verkopen en ontvang gratis offertes van lokale verkoopmakelaars in Zeewolde.
Recent verkocht in Zeewolde? Lees de verkoopgerichte gids huis verkopen in Zeewolde, vergelijk verkoopmakelaars in Zeewolde of bekijk de beste verkoopmakelaars in Zeewolde voor referentie bij jouw keuze.
Makelaars maken scherpere voorstellen als ze weten dat je vergelijkt — vraag offertes aan voor verkoop of aankoop.
Short answers about housing prices, sold homes and comparing real estate agents in Zeewolde.
The costs of a real estate agent in Zeewolde vary per office, property type and sales approach. Therefore, compare multiple quotes and also look at the real estate agents in Zeewolde to better compare rates, presentation and local experience.
On this page we currently show 275 sold houses in Zeewolde from our selection. This helps you to better assess recent transactions and the local housing market.
Houses sold in Zeewolde give insight into asking prices, house types and neighborhoods where recent transactions have taken place. Compare this also with the current housing stock in Zeewolde to better understand the market.
Je kunt verkochte woningen gebruiken als eerste marktindicatie, maar een lokale makelaar kan beter rekening houden met afwerking, ligging, onderhoud en actuele vraag in Zeewolde. Plan de volgende stap via de gids huis verkopen in Zeewolde.
Vergelijk makelaars in Zeewolde op lokale verkoopervaring, reviews, verwachte opbrengst, courtage en marketingaanpak. Bekijk verkoopmakelaars in Zeewolde of de top 10 makelaars in Zeewolde om snel sterke kantoren te ontdekken.
View current location data on residents, WOZ development, housing stock, energy consumption, business activity and safety in Zeewolde. In 2026 were there 24.610 residents. The average WOZ value in 2025 is EUR 423.000.
These figures help to better assess and compare the housing stock in Zeewolde with recent sold homes. Orient yourself then on suitable top real estate agents in Zeewolde for sales advice in this region.
Residents
24.610
Last year: 2026
Average WOZ
EUR 423.000
Last year: 2025
Average income per person.
EUR 35.900
Source: AllNumbers
Crimes (current year)
776
Total registered
| Year | Residents |
|---|---|
| 2022 | 23.348 |
| 2023 | 23.692 |
| 2024 | 23.899 |
| 2025 | 24.291 |
| 2026 | 24.610 |
| Year | Average WOZ |
|---|---|
| 2021 | EUR 305.000 |
| 2022 | EUR 331.000 |
| 2023 | EUR 393.000 |
| 2024 | EUR 413.000 |
| 2025 | EUR 423.000 |
Hoger
32
Praktisch
22
Middelbaar
46
Europa
2.628
Nederland
18.756
Buiten Europa
2.907
Label A
4.503
Label B
3.030
Label C
2.993
Label A+
480
Label A++
392
Label A+++
339
Label A++++
73
Label D
48
Label E
41
Label F
17
Label G
7
Label A+++++
5
| Year | Gas (m3) | Electricity (kWh) |
|---|---|---|
| 2020 | 920 | 3.050 |
| 2021 | 1.030 | 3.100 |
| 2022 | 790 | 2.890 |
| 2023 | 660 | 2.740 |
| 2024 | 620 | 2.830 |
Hoekwoning
Gas: 640 • Electricity: 2.770
Huurwoning
Gas: 530 • Electricity: 2.060
Koopwoning
Gas: 720 • Electricity: 3.030
Appartement
Gas: 420 • Electricity: 1.860
Tussenwoning
Gas: 600 • Electricity: 2.580
Vrijstaande woning
Gas: 1.180 • Electricity: 4.030
Twee-onder-één-kap woning
Gas: 750 • Electricity: 3.570
Total number of company establishments: 3.725
| Period | Crimes |
|---|---|
| jan 2026 | 36 |
| jul 2025 | 74 |
| jun 2025 | 94 |
| mei 2025 | 49 |
| mrt 2025 | 94 |
| mrt 2026 | 52 |
| nov 2024 | 70 |
| nov 2025 | 36 |
| okt 2024 | 74 |
| okt 2025 | 58 |
| sep 2024 | 63 |
| sep 2025 | 46 |
These figures give an indicative picture of safety trends in the living environment of Zeewolde.
Short answers based on current local statistics, handy for a quick comparison of the living environment.
Zeewolde telt in 2026 ongeveer 24.610 inwoners.
De gemiddelde WOZ-waarde in Zeewolde is in 2025 circa € 423.000.
Het gemiddelde inkomen per inwoner in Zeewolde ligt rond € 35.900 per jaar.
Voor het huidige jaar gaat het om ongeveer 776 geregistreerde misdrijven. Gebruik deze cijfers als indicatie en vergelijk trends per periode.
In Zeewolde komt vooral "Tussenwoningen" veel voor, met ongeveer 4.605 woningen.