Flevopand Makelaars
Het verkopen van een woning is meer dan alleen praten over het huis. Klanten nemen binnen de eerste minuut vaak een beslissing: wil ik hier wonen of niet? De eerste bezichtiging geeft vaak dat “goede gevoel”, de tweede is meer over praktische zaken. Passen mijn meubels of bank in deze woonkamer? Deze vragen zijn centraal voor kopers. Een goed verkoopproces houdt ook in dat de makelaar op tijd komt, goed voorbereid is en de woning kent....
Current housing stock
-
- Available
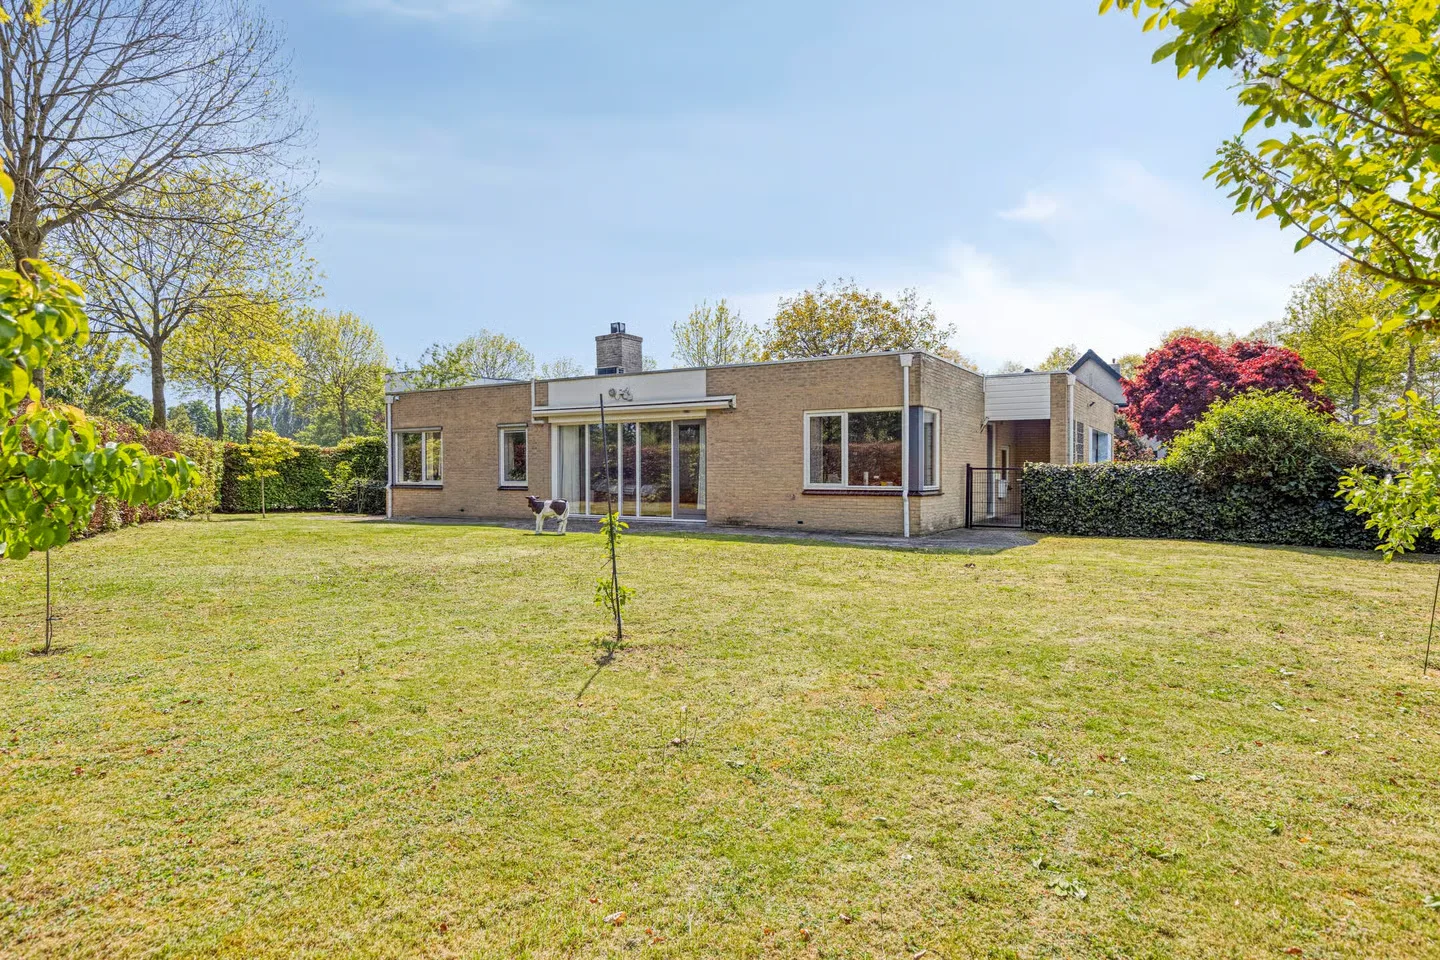
Corridor 1
3893BA Zeewolde
€ 650.000 k.k.
A++Save as favorite- Living area
- 113 m²
- Land area
- 590 m²
- Bedrooms
- 3
-
- Available
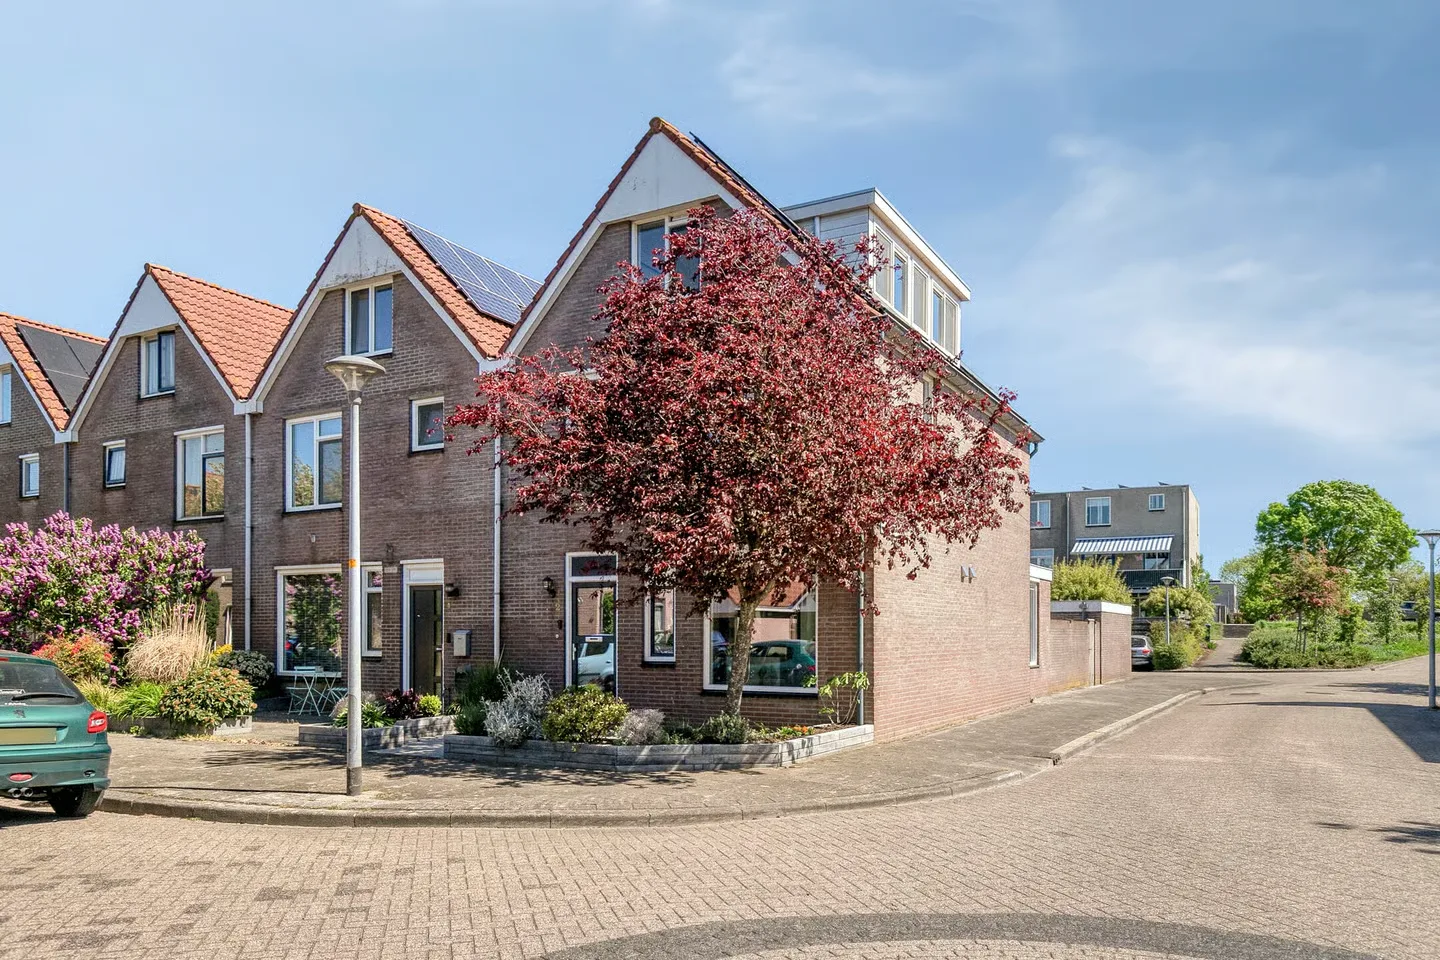
Molenrak 2
3891EL Zeewolde
€ 495.000 k.k.
CSave as favorite- Living area
- 135 m²
- Land area
- 135 m²
- Bedrooms
- 4
-
- Available
Zilverschoon 1
3892AK Zeewolde
€ 889.000 k.k.
ASave as favorite- Living area
- 156 m²
- Land area
- 1024 m²
- Bedrooms
- 3
-
- Available
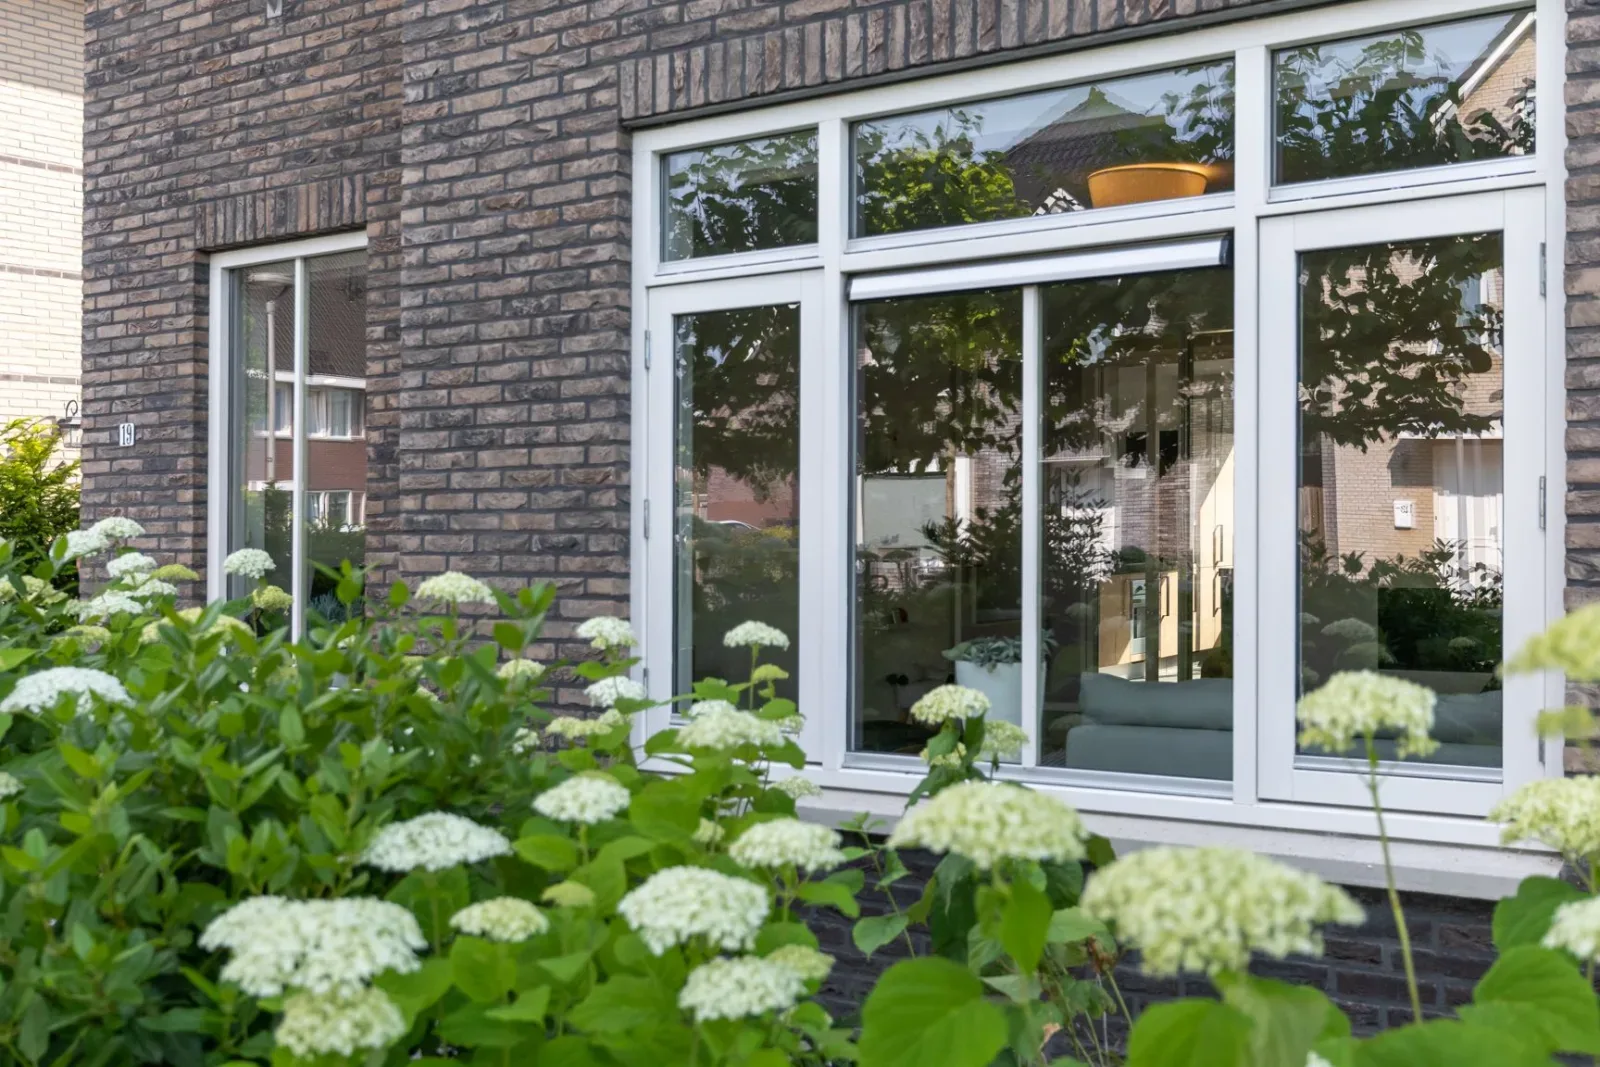
Vlaamse Gaai 13
3893KE Zeewolde
€ 425.000 k.k.
€ 3.125/m²
ASave as favorite- Living area
- 136 m²
- Land area
- 162 m²
- Bedrooms
- 5
-
- Available
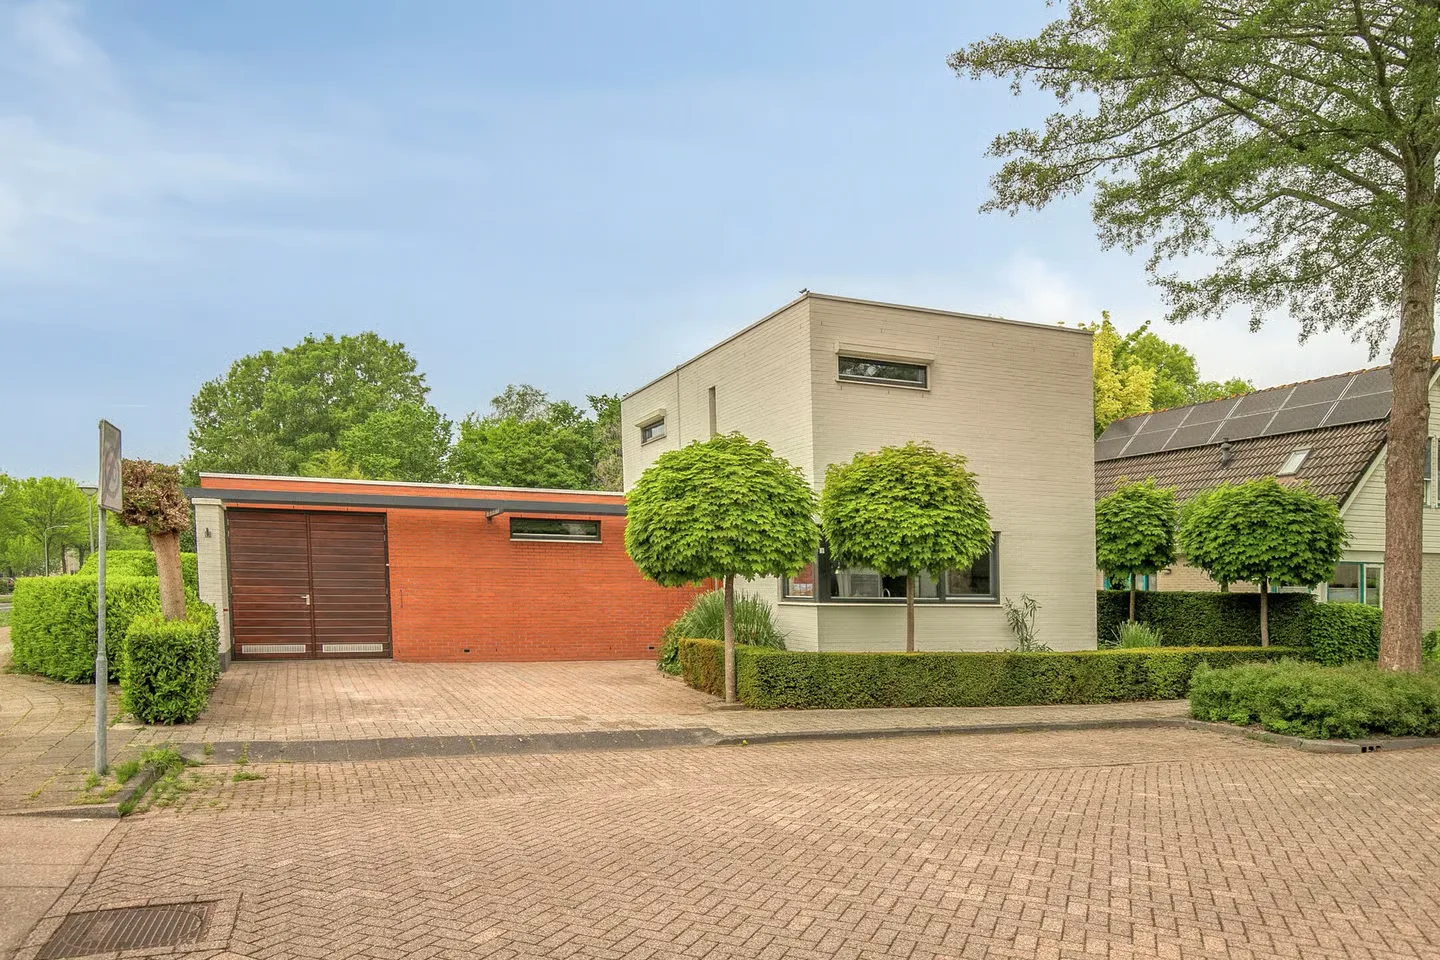
Radon 41
3894DP Zeewolde
€ 569.000 k.k.
€ 4.377/m²
A+Save as favorite- Living area
- 130 m²
- Land area
- 228 m²
- Bedrooms
- 3
-
- Available
Pluuthaven 8
3891AX Zeewolde
€ 789.000 k.k.
€ 4.561/m²
ASave as favorite- Living area
- 173 m²
- Land area
- 353 m²
- Bedrooms
- 4
Reviews (78)
Review platforms
BronscoresTotal score
78 total reviews

Funda
25 reviews on Funda

53 reviews on Google
-
Robijn 33
9Julian is deskundig en kent de locale markt goed. In het begin was weinig ruimte voor eigen inbreng. Wij als verkoper hebben meer emotioneel gevoel bij je eigen woning en hier was o.i. weinig begrip voor. Dat is naderhand goed uitgesproken. Carin van de binnendienst is accuraat en erg vriendelijk in de benadering.
-
Boomkleverlaan 241
9Het ging allemaal heel erg soepel en snel. Het contact was plezierig en de begeleiding van ons als verkopers en de potentiële kopers was overduidelijk succesvol.
-
Almereweg 13
10Wij hebben een heel fijn traject gehad met onze makelaar. De verkoop van onze woning en de aankoop van ons nieuwe huis verliepen soepel en vlekkeloos. Er werd goed meegedacht, snel geschakeld en alles was duidelijk geregeld. We kijken hier met een erg goed gevoel op terug.
-
De Deel 1
10Translated by AIThe contact with the real estate agent went very smoothly. Very competent and has a good grasp of business. Gives clear explanations of what everything entails and guides you through the entire process. Short lines and that's what we like, no surprises. We definitely recommend Flevopand real estate agents.
-
Takeling 2
9Translated by AIGood market assessment, developments and achievable price levels. Communicates smoothly and correctly, easy to reach, quick responses to questions and/or comments. More personal approach than many other real estate agents. Highly recommended.
-
Heleen van der Klink
10Translated by AIWe spoke with multiple real estate agents for the sale of our house, but Julian from Flevopand stepped up for us. He was well-prepared and truly thought with us from the first conversation. Julian is a pleasant real estate agent to work with: careful in his advice and communication, with an excellent feel for the local housing market and a clear, well-considered approach. After each viewing, we received quick and clear feedback. The sale was accompanied with attention and calmness, without haste or pressure. We wholeheartedly recommend Flevopand Makelaars.
-
Poolster 6
10Translated by AIWe spoke with multiple real estate agents for the sale of our house, but Julian from Flevopand stepped up for us. He was well-prepared and truly thought with us from the first conversation. Julian is a pleasant real estate agent to work with: careful in his advice and communication, with an excellent feel for the local housing market and a clear, well-considered approach. After each viewing, we received quick and clear feedback. The sale was handled with care…
-
Grote Beer 75
9Translated by AIJulian is a top real estate agent! Very pleasant to deal with and so is his secretary too. My house was sold quickly. Good guidance and reliable. He also has the principle that "the customer is king" - so he goes along with the customer's choices, but does give honest professional advice.
-
Hazeleger 62
9Translated by AIGood guidance and clear information, good market knowledge and fine communication, recommended for Zeewolde
-
Smaragd 73
9Translated by AIAfter a pleasant introductory meeting, our real estate agent usually acted quickly and enthusiastically. Appointments were always kept neatly, and his knowledge of the local housing market is more than excellent. Our interests as clients were always prioritized. We therefore worked together with great pleasure and complete satisfaction to sell the house as well and as fast as possible. And it was incredibly successful! We would like to wholeheartedly recommend this real estate agent to anyone who…
-
Eli Isely
10Het was een genoegen om met Julian en zijn collega's samen te werken. Hij leverde alle benodigde informatie om het proces soepel te laten verlopen. Ik beveel hem en zijn kantoor van harte aan.
-
Mosselhof 57
10Translated by AISelling a house is quite exciting, and certainly not something we do daily. Throughout the entire process, we were well guided by Julian and Carin of Flevopand Real Estate Agents. At every step in the sales process, Julian took the time to support us, and Carin helped us to relieve our burden. I definitely recommend Flevopand Real Estate Agents. A skilled real estate agent, clear communication, and personal attention.
-
Wijenburg 17
9Translated by AIEverything was perfectly taken care of. The process was explained in bite-sized chunks. The steps you had to take were neatly guided. The speed at which everything came together and was sold was unbelievable. Total processing time for the entire process (from filling out sales lists to sale), less than 4 weeks.
-
Pauwoog 4
10Translated by AIThe broker knows what he's talking about, is skilled, honest, communicates quickly and correctly, and pleasant to deal with. The same applies to the back office.
-
Beekvliet 13
10Translated by AIVery serious and knowledgeable realtor. Pleasant to deal with. Responds quickly via WhatsApp. Nothing to complain about.
-
Ravelijn 23
10Translated by AIAlways willing to think along. Made good agreements with him. Very pleasant collaboration. Gives good advice. Can definitely recommend him.
-
Grote Plaat 41
10Translated by AIVery knowledgeable also regarding difficult issues, very correct and friendly in dealing with the buyer and with the seller.
-
Rietlaan 54
9Translated by AIWe found the broker knowledgeable, collaborative, and a pleasant person. Everything went well. We would recommend him to other house buyers or sellers.
-
Gors 5
10Translated by AIEverything was perfectly arranged, from photos to viewings. Our house was sold within a very short time. The communication with the real estate agent was fast, direct and honest and we experienced it as very pleasant.
-
Elementen 39
9Translated by AIWe had many setbacks, but Julian guided us through them with his expert advice! We would definitely recommend him.