BAAR Makelaardij
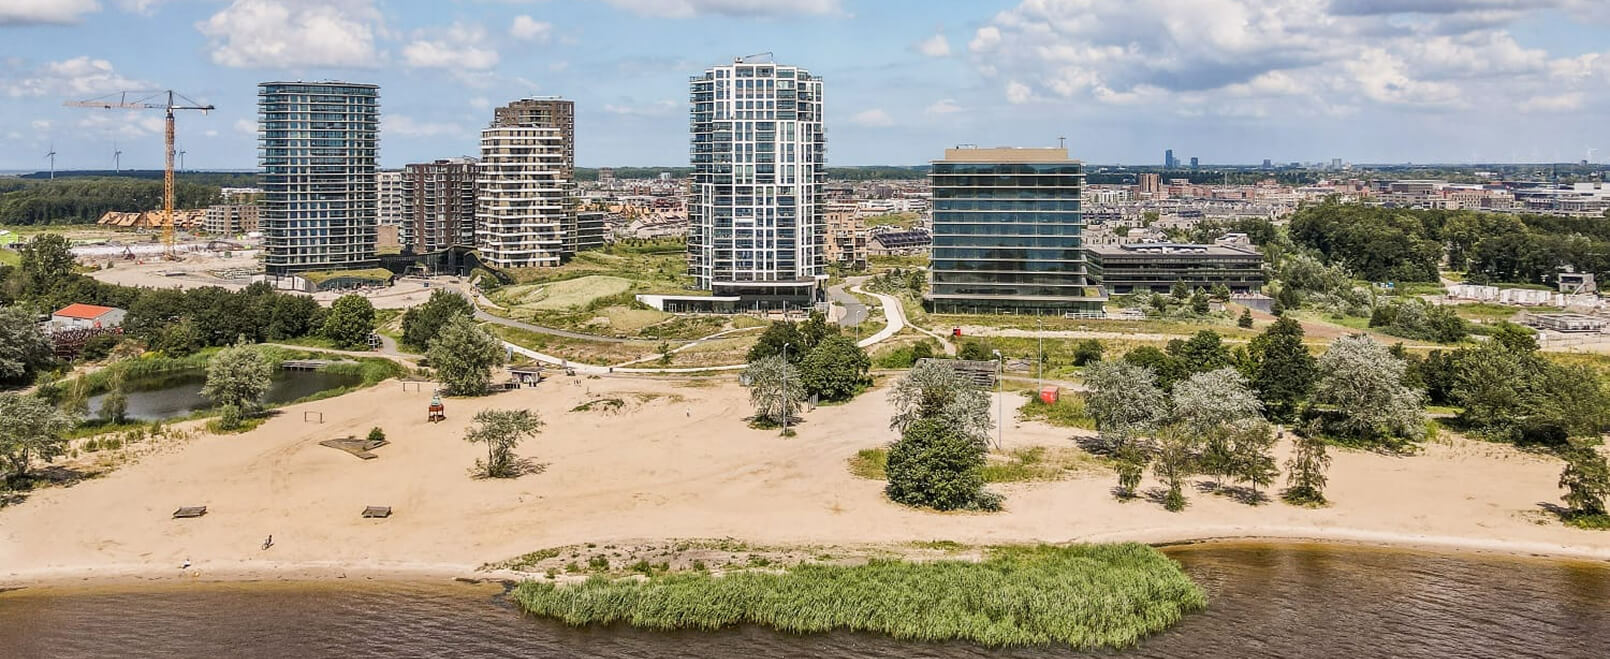
BAAR Makelaardij offers personal guidance in Almere and the surrounding area. With years of experience in sales, purchases and appraisals, the office is committed to a no-nonsense approach where customers are central. We understand the emotions and complexity of real estate transactions and provide a calm, professional support from A to Z. We specialize in sales, purchases and appraisals with an approach focused on transparency and resu...
Current housing stock
-
- Available
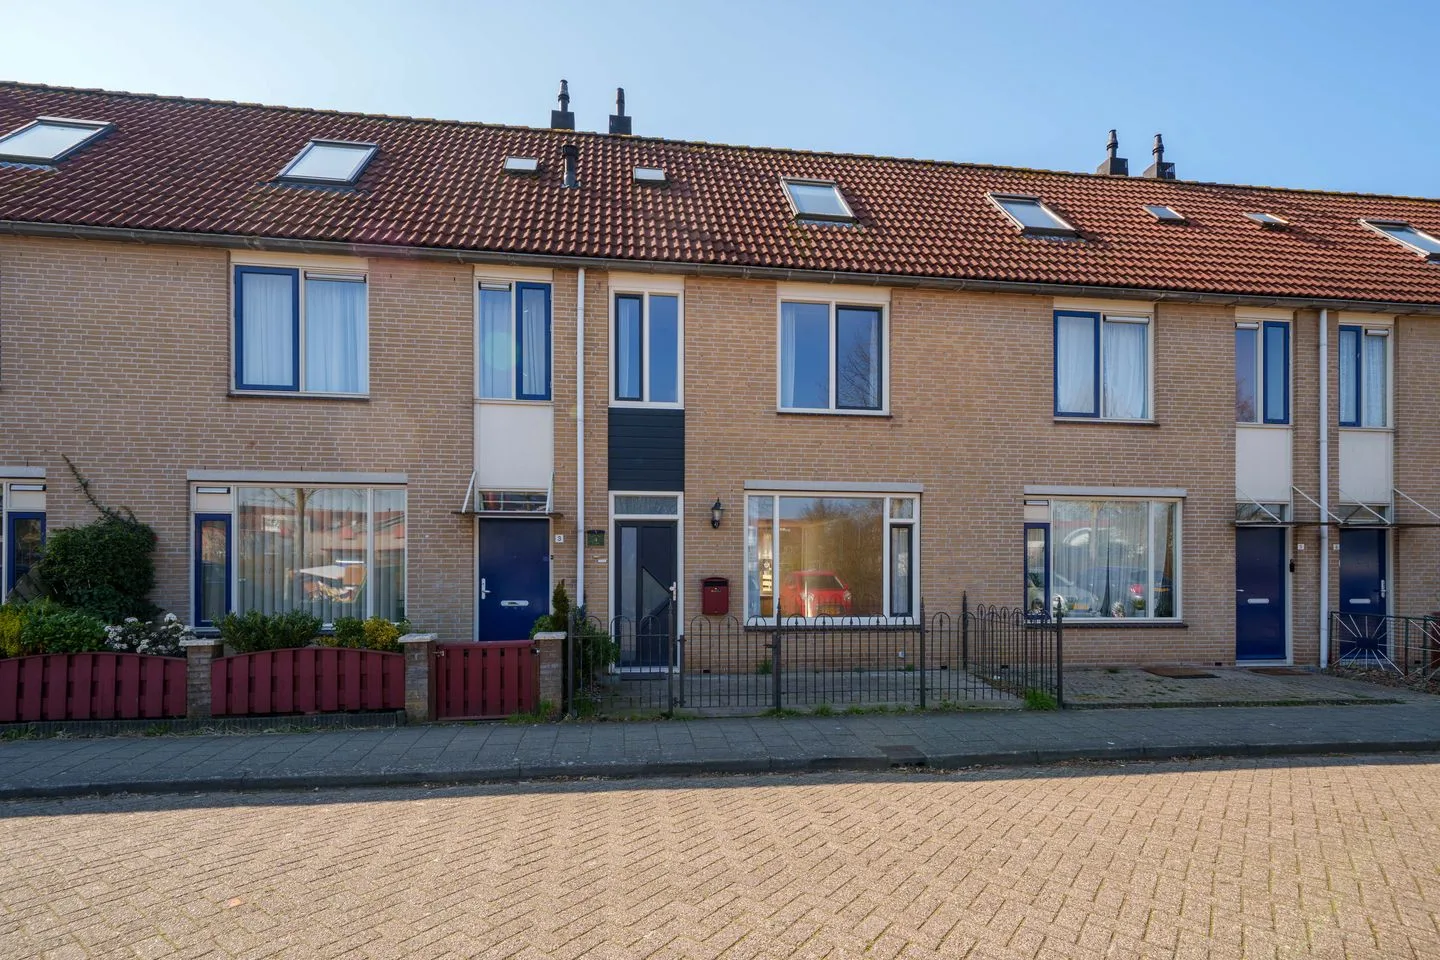
Archipel 15 55
8224GD Lelystad
€ 395.000 k.k.
€ 2.821/m²
BSave as favorite- Living area
- 140 m²
- Land area
- 174 m²
- Bedrooms
- 4
-
- Available
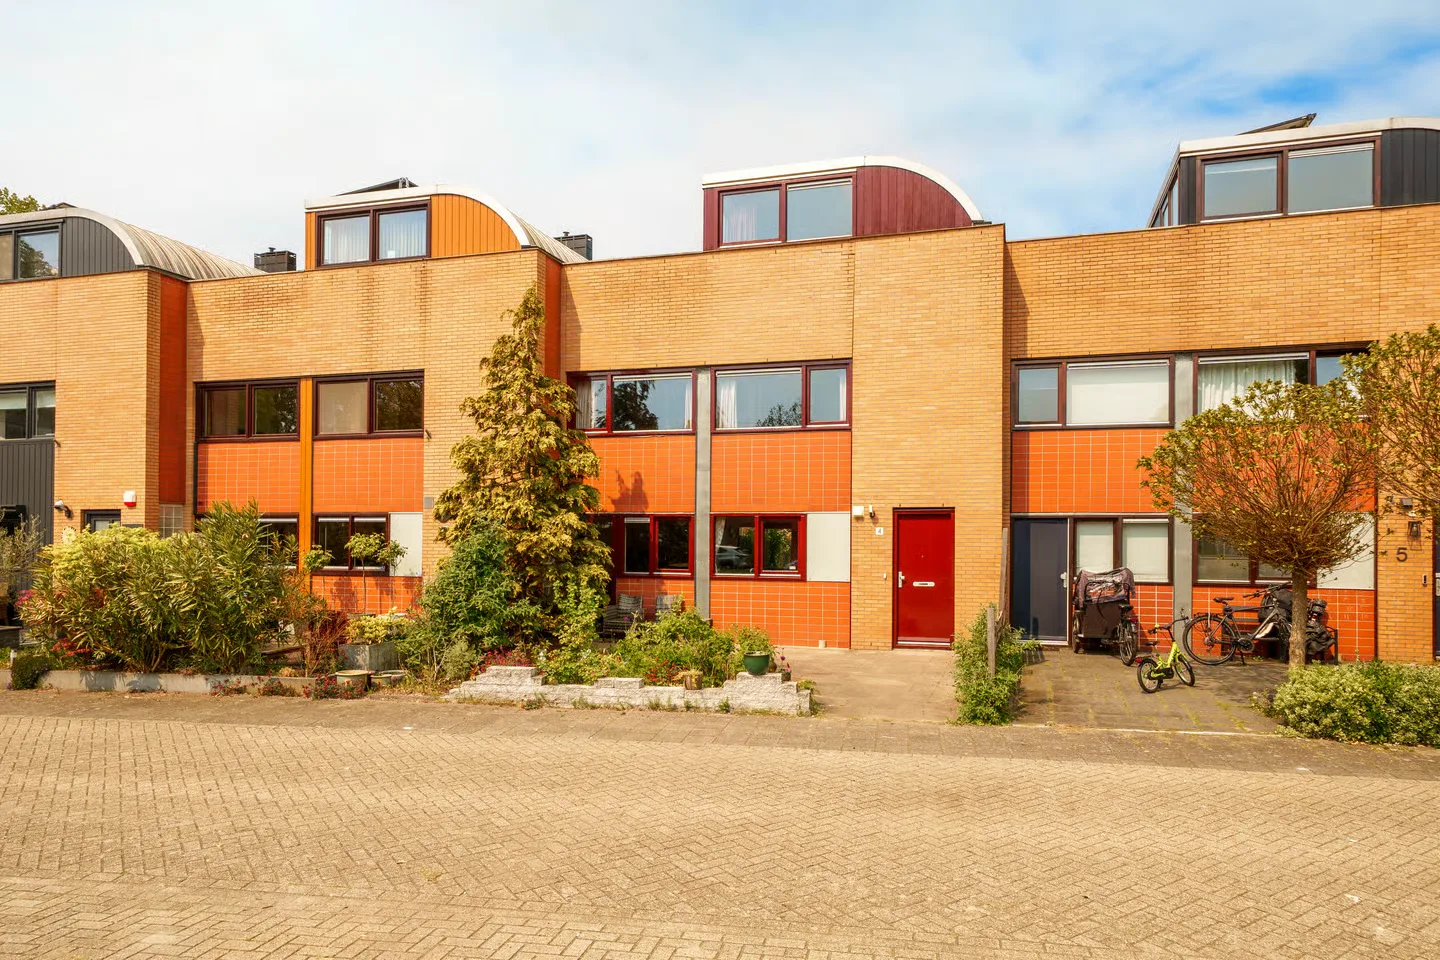
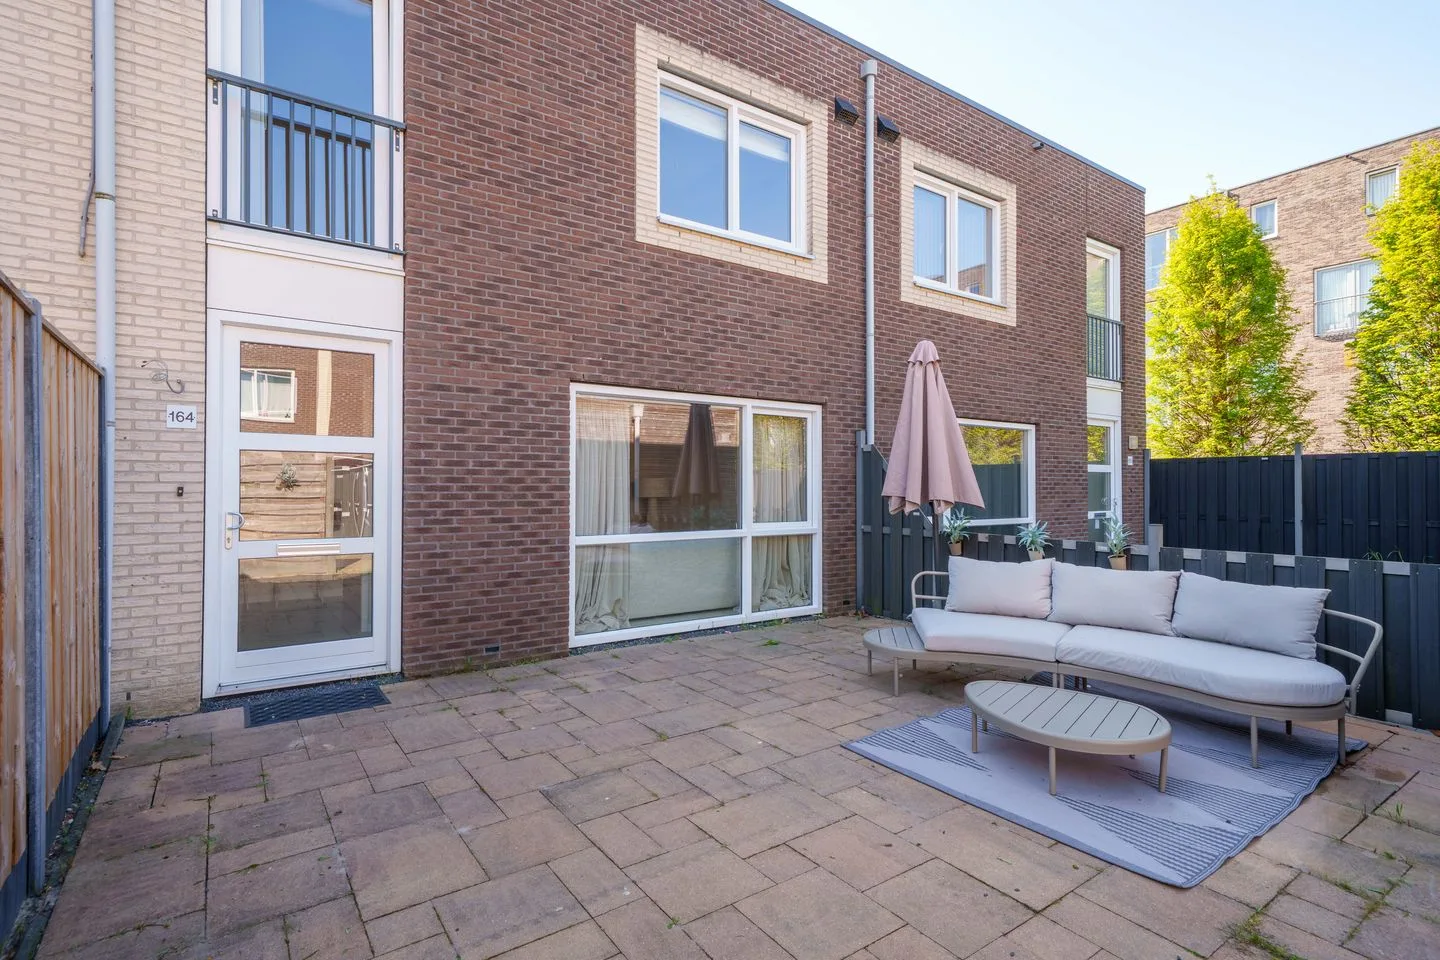
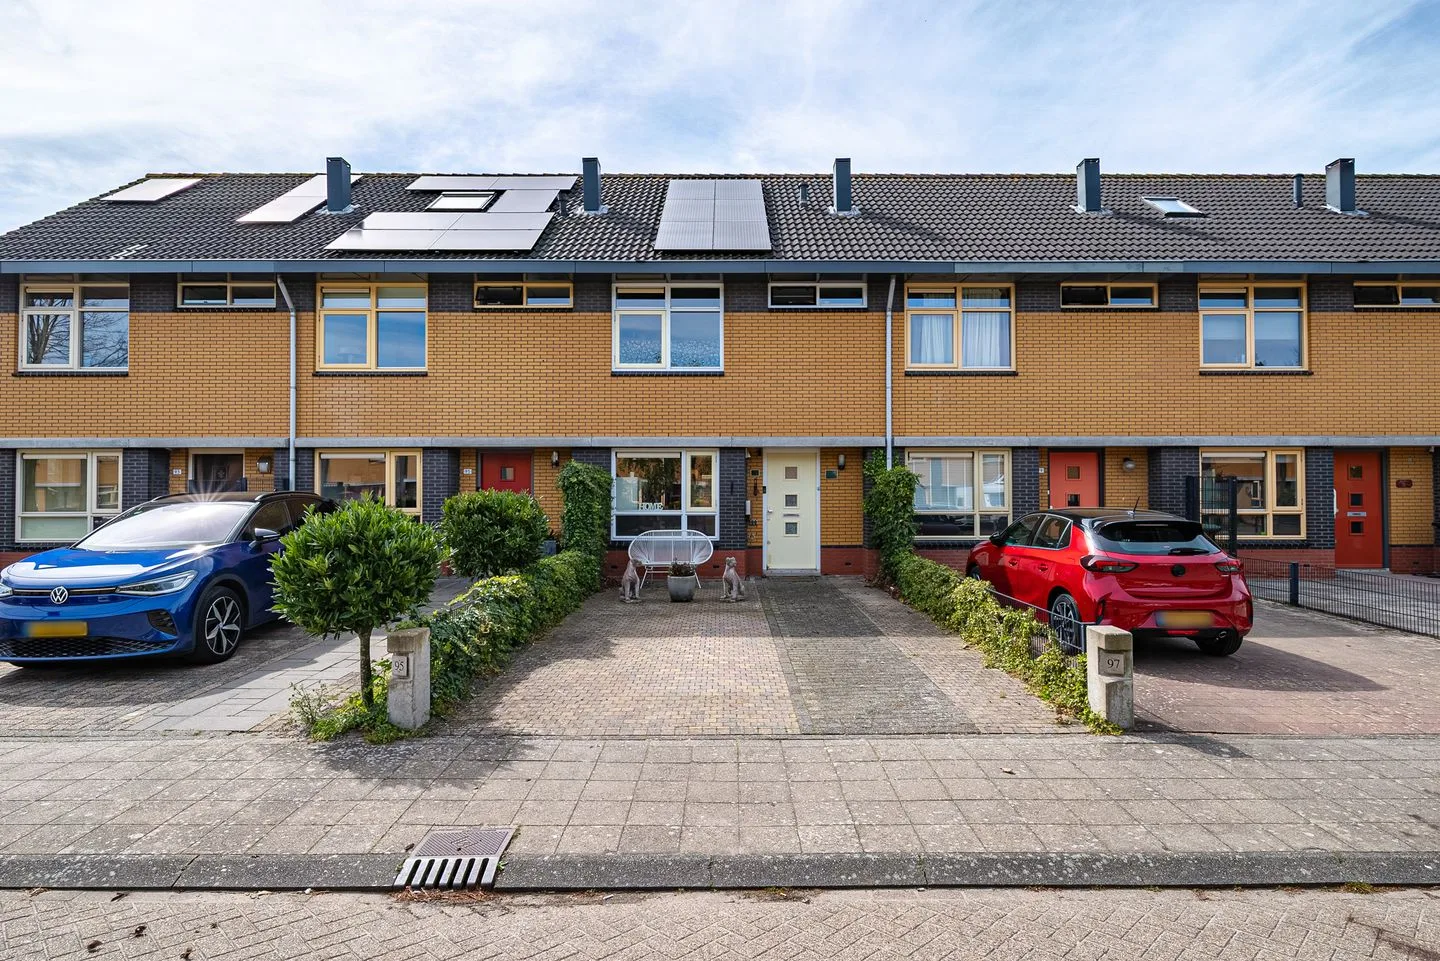
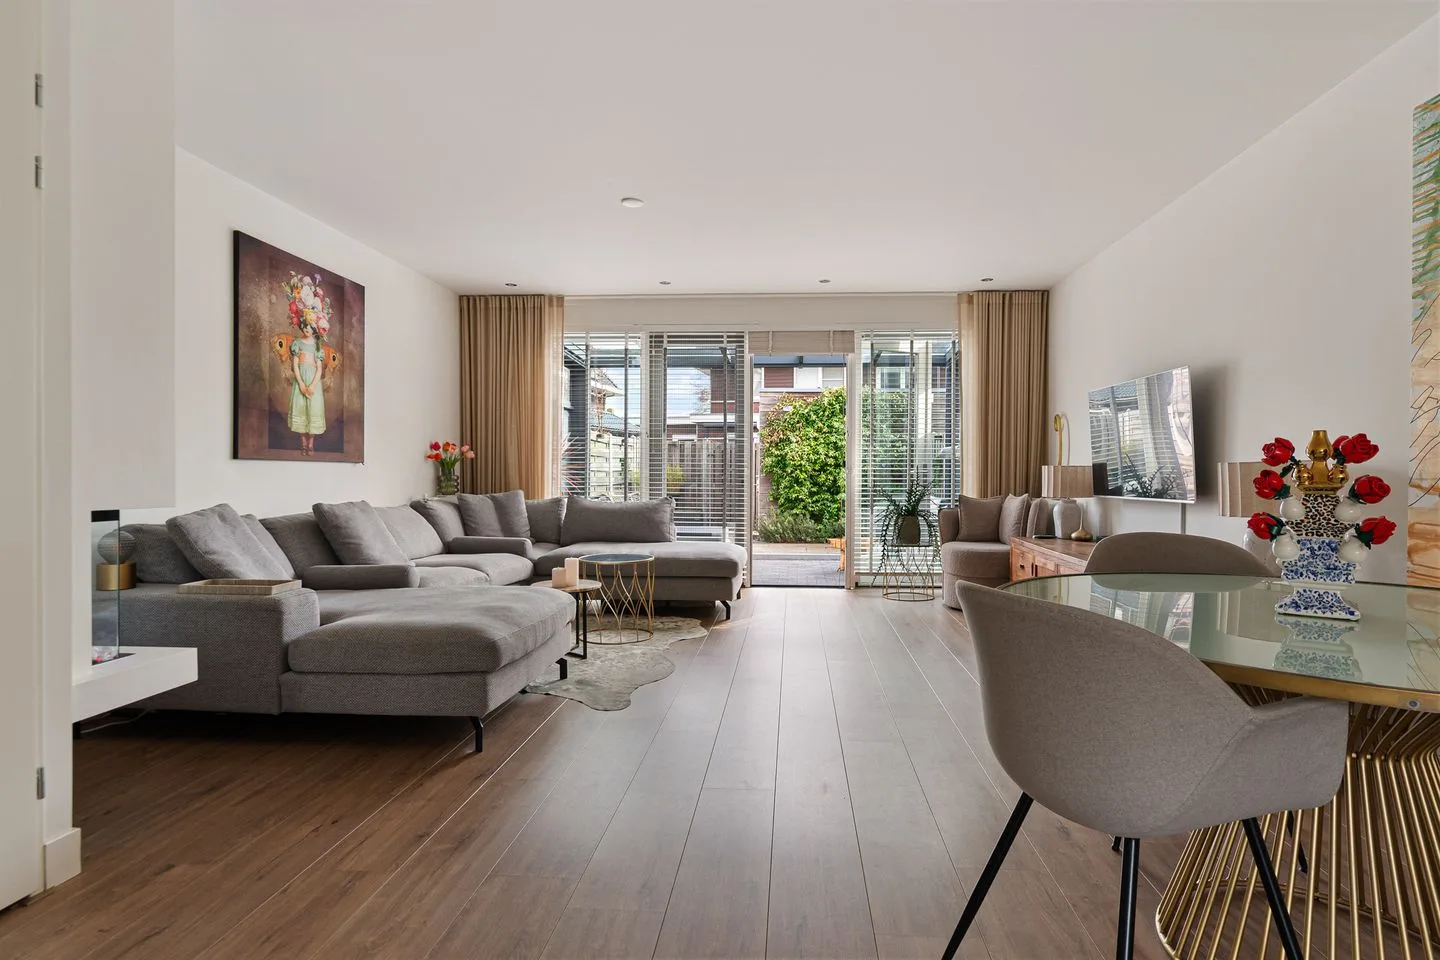
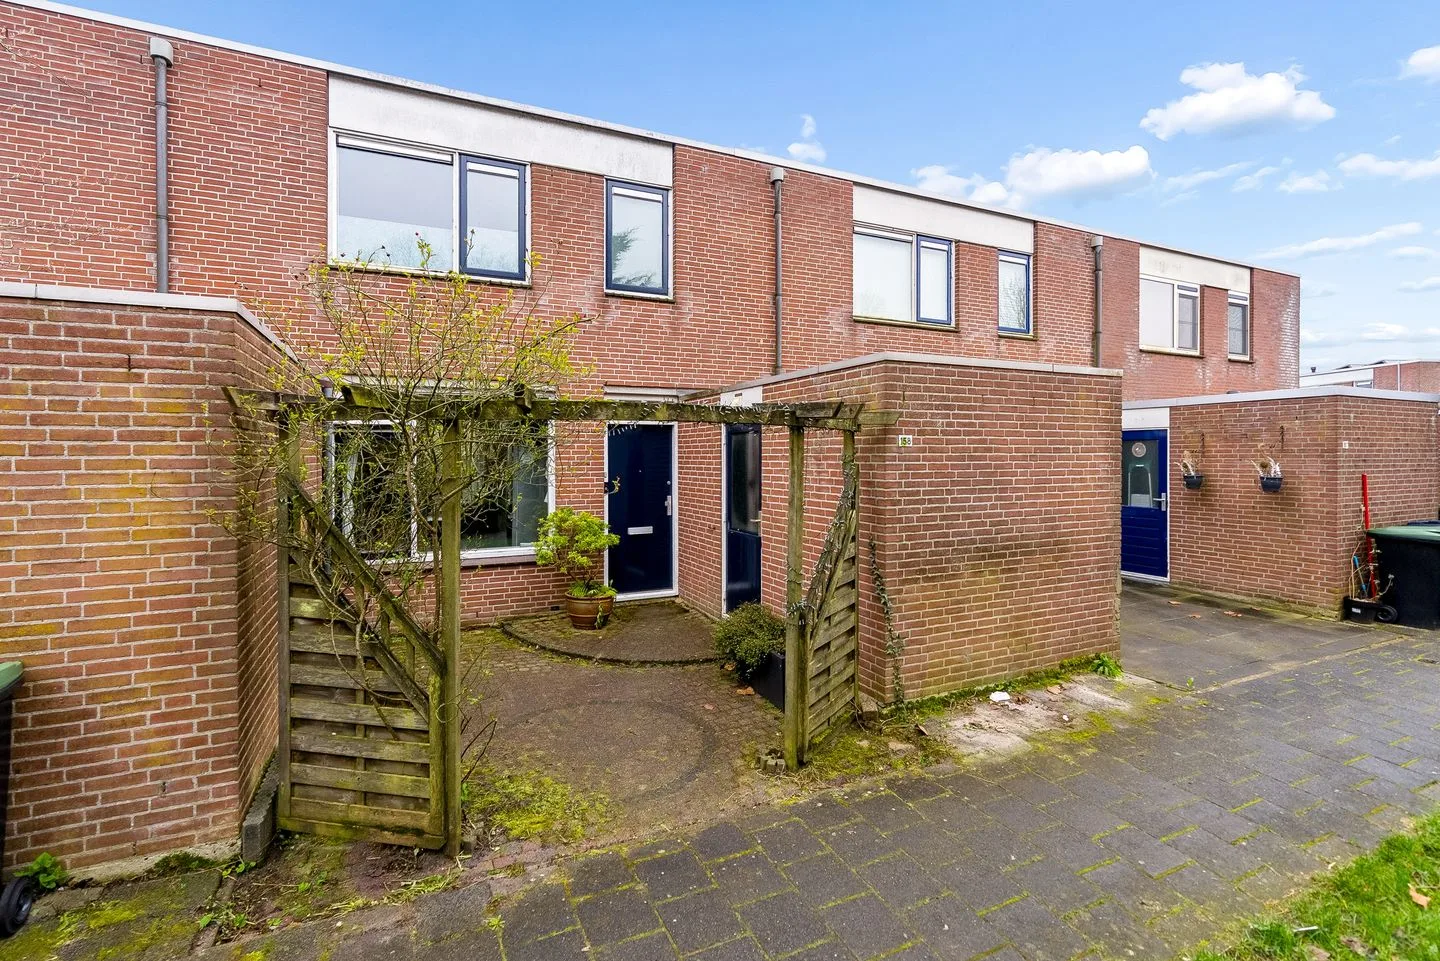
Oldewierde 158
1353HS Almere
€ 375.000 k.k.
€ 3.641/m²
Save as favorite- Living area
- 103 m²
- Land area
- 133 m²
- Bedrooms
- 3
-
- Available
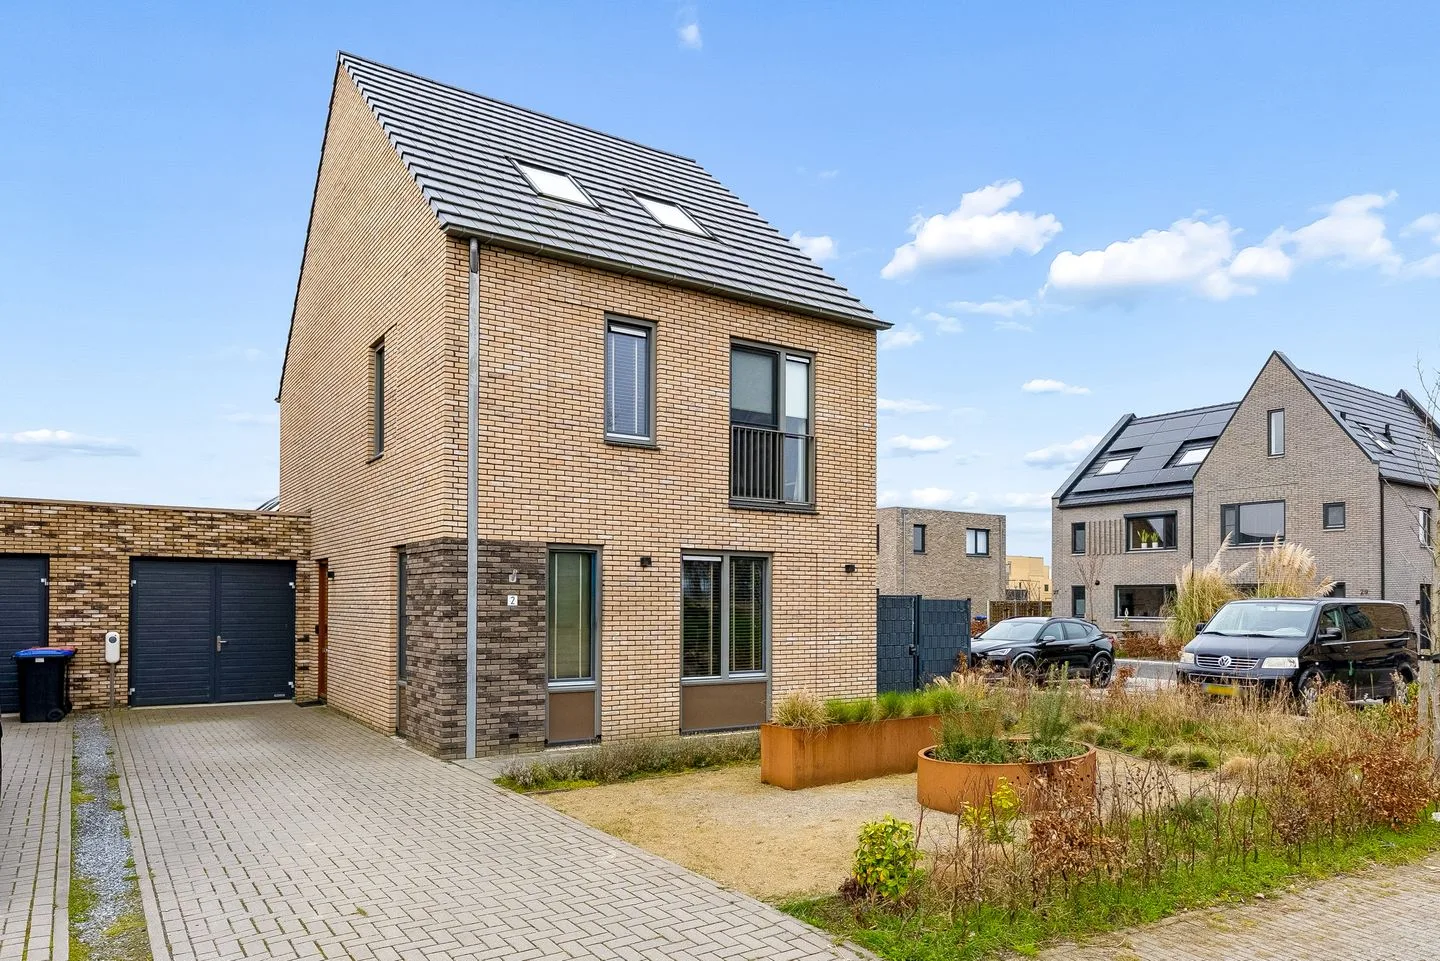
Zwenkgras 2
8245HS Lelystad
€ 685.000 k.k.
€ 4.363/m²
ASave as favorite- Living area
- 157 m²
- Land area
- 356 m²
- Bedrooms
- 5
-
- Available
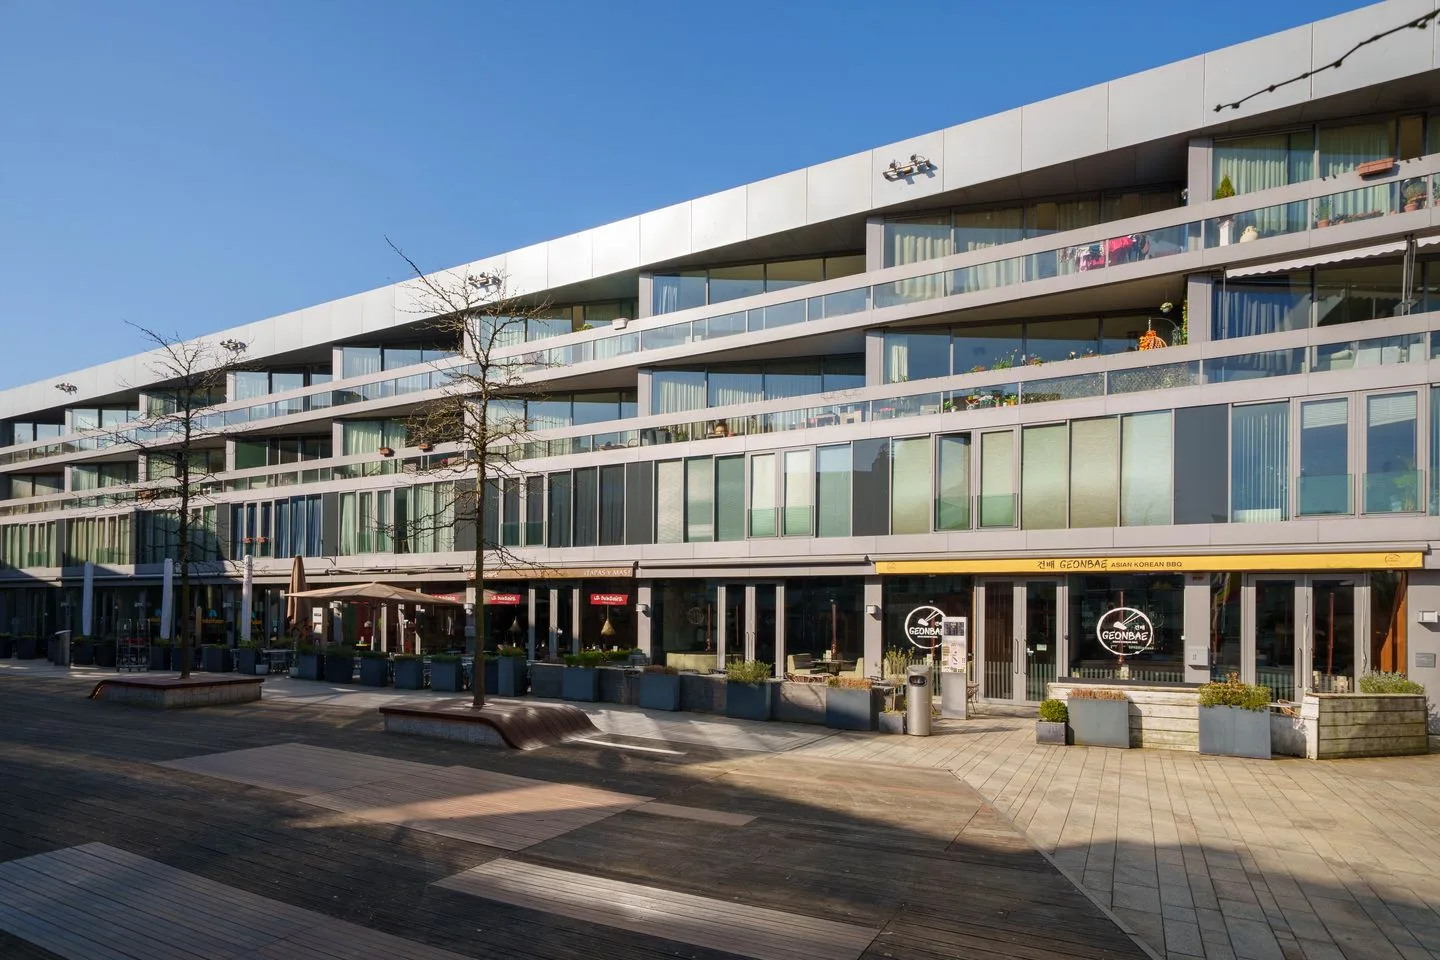
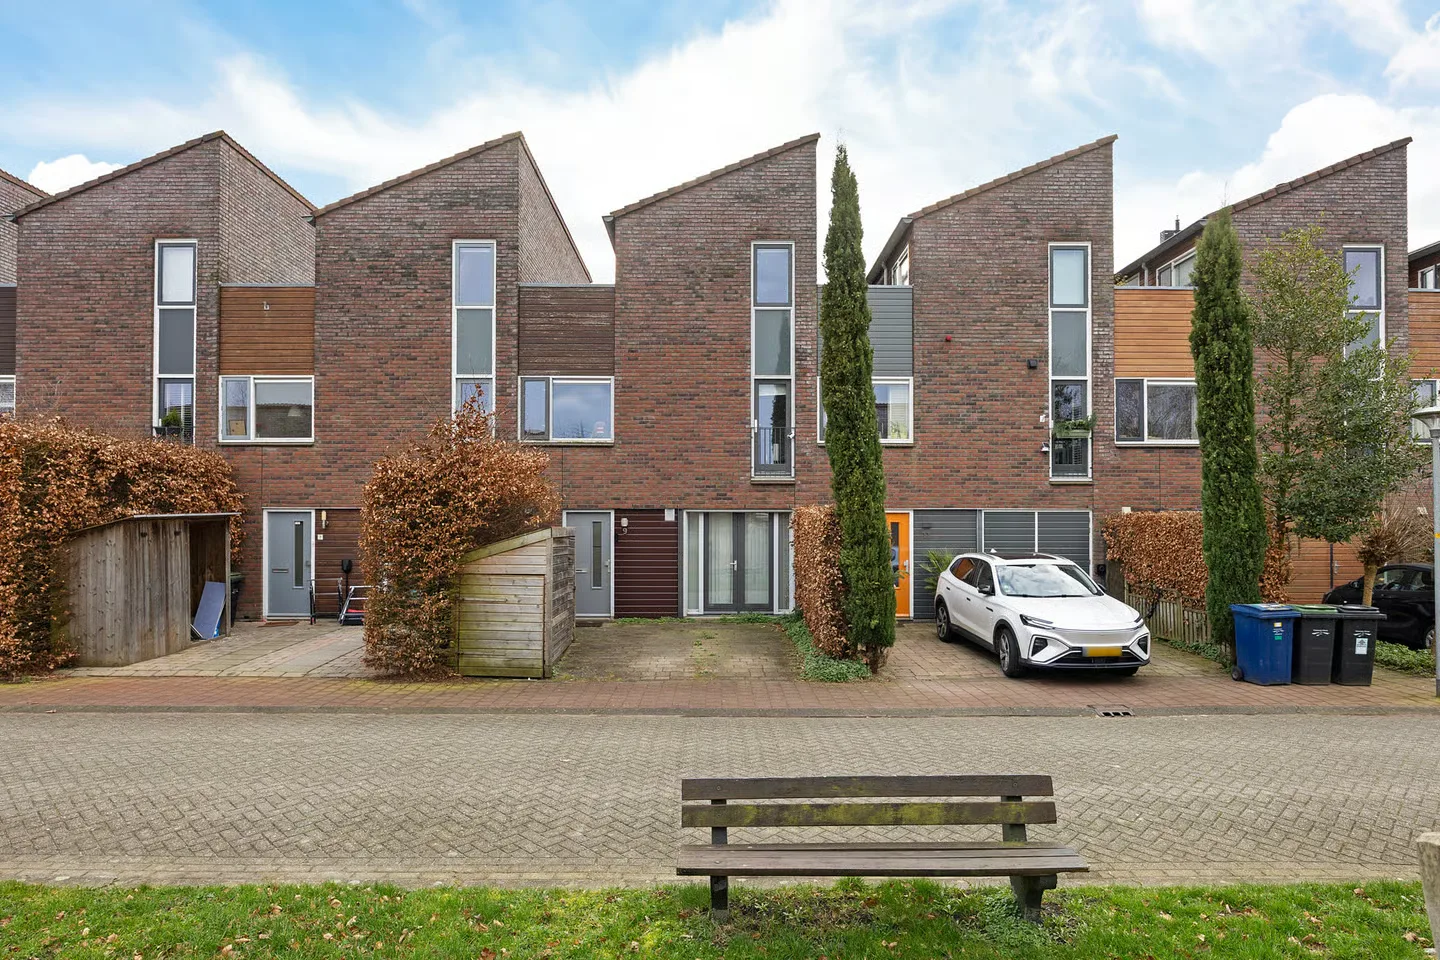
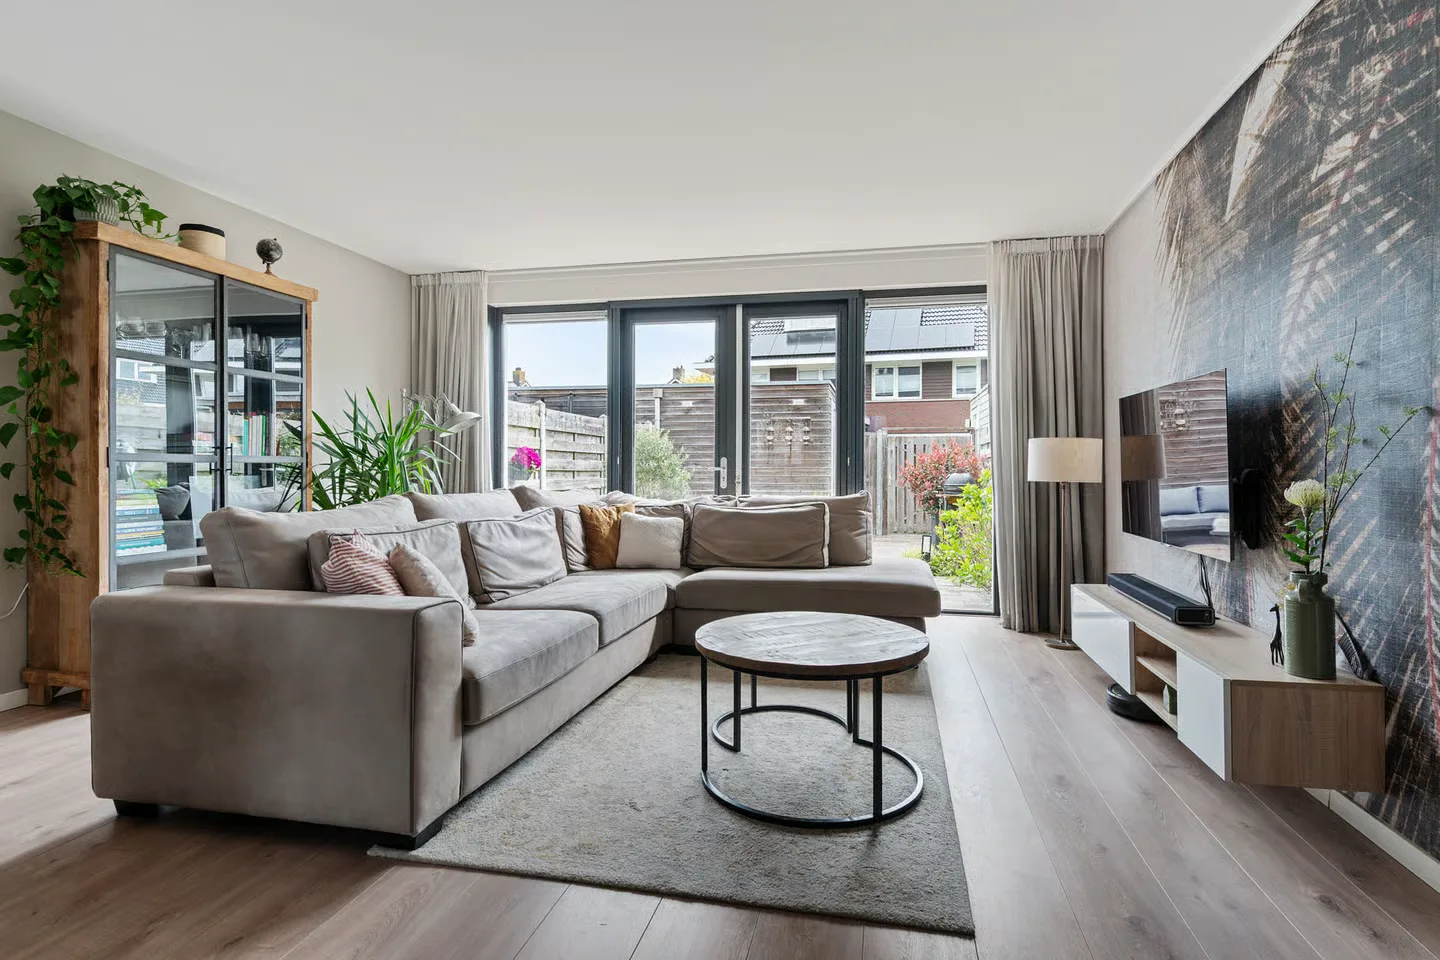
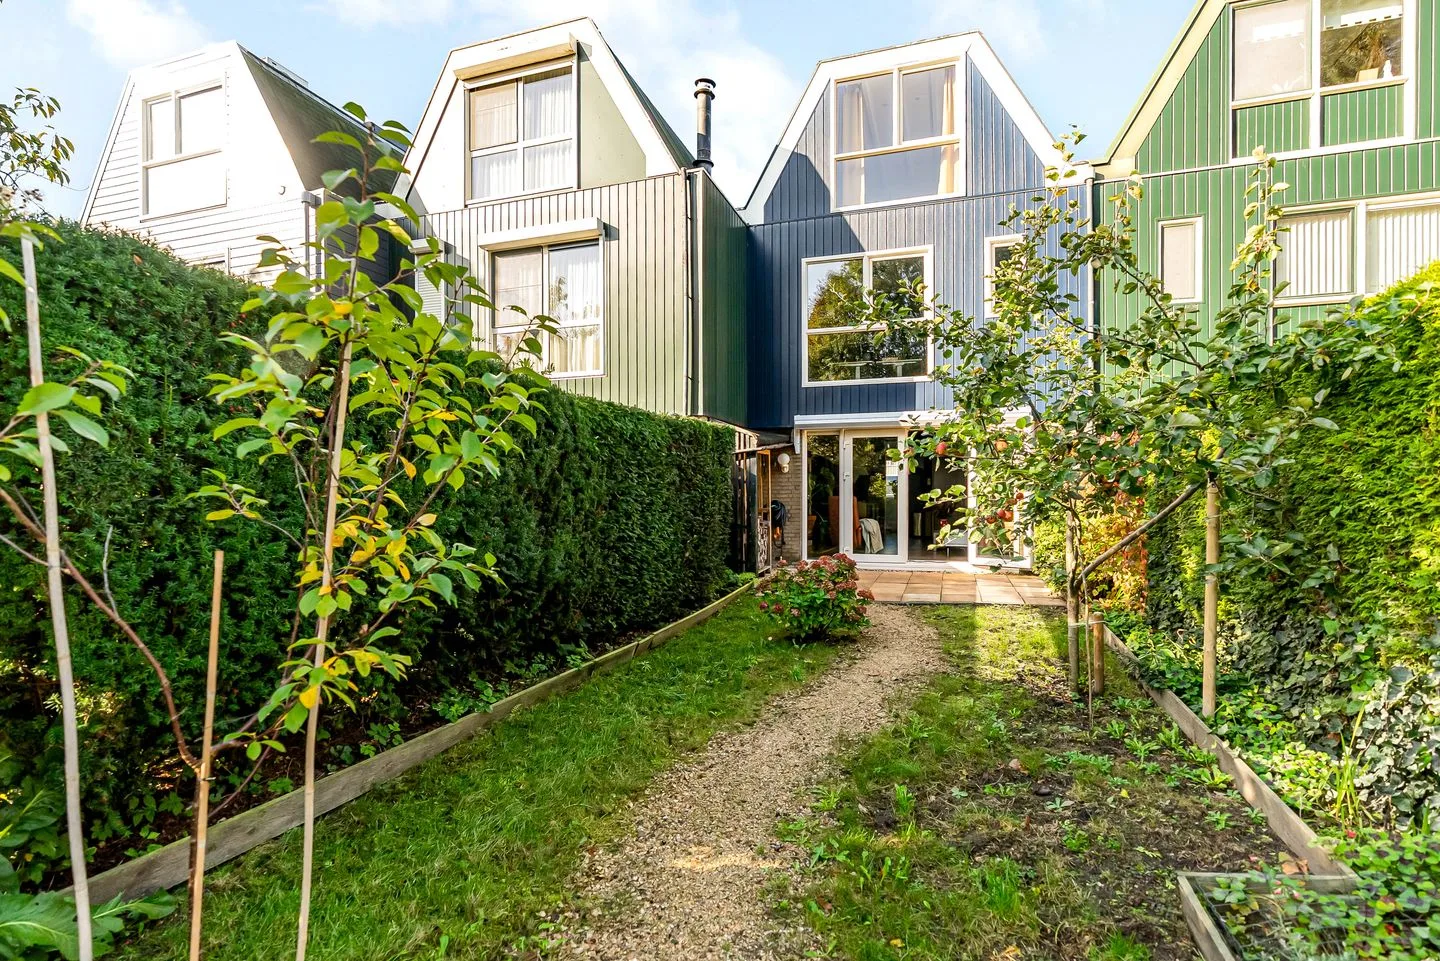
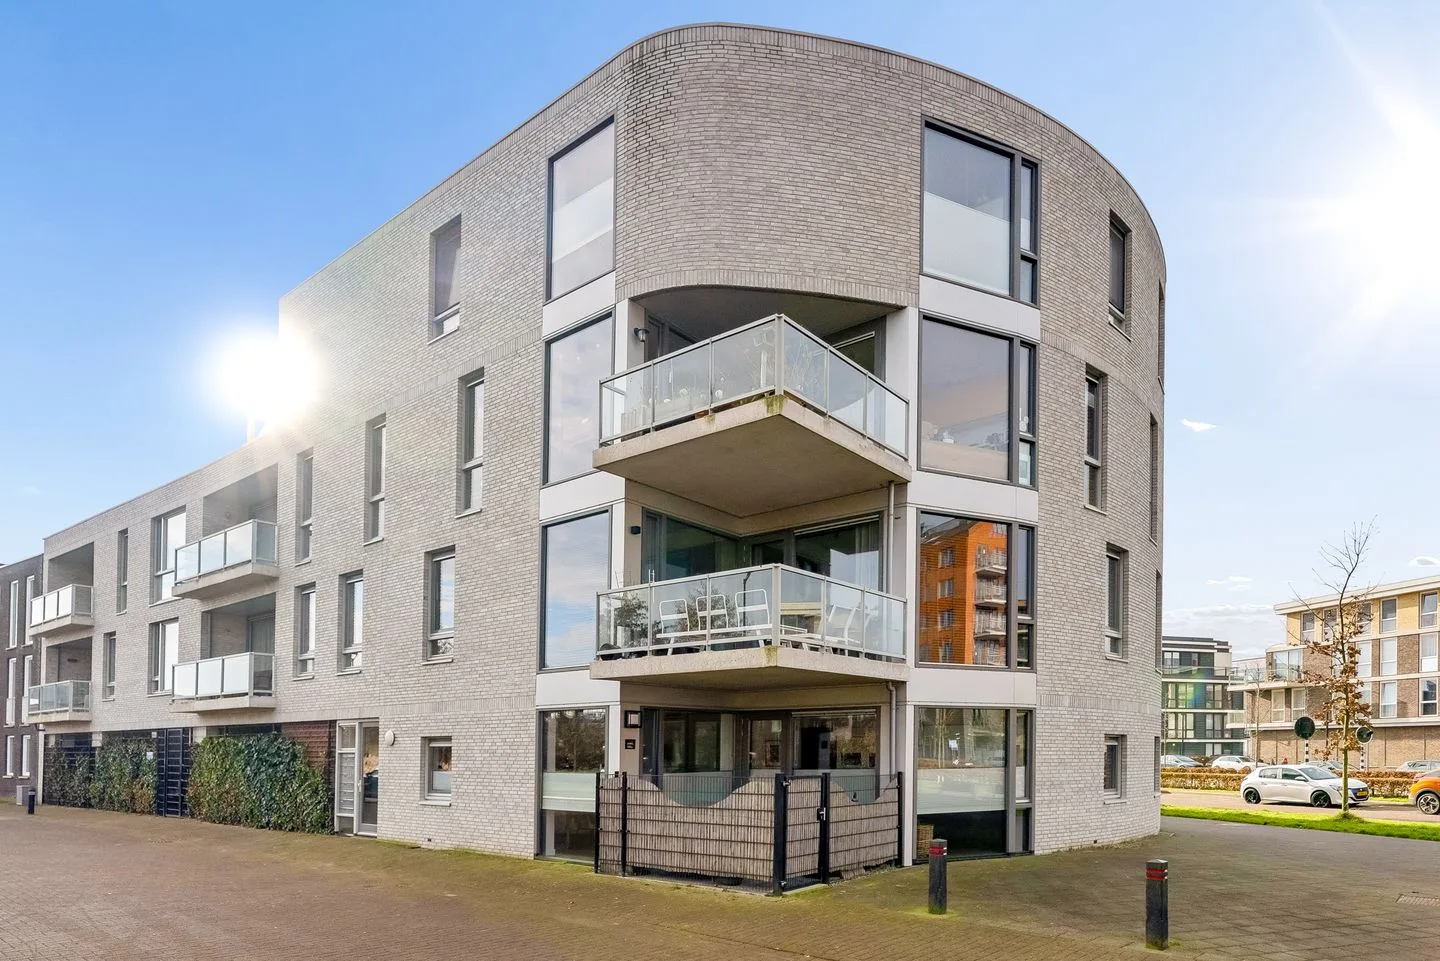
Scandinaviëkade 179
1363DJ Almere
€ 475.000 k.k.
€ 5.278/m²
ASave as favorite- Living area
- 90 m²
- Land area
- —
- Bedrooms
- 2
-
- Available
Bezaan 43
1319EP Almere
€ 940.000 k.k.
€ 5.193/m²
ASave as favorite- Living area
- 181 m²
- Land area
- 309 m²
- Bedrooms
- 5
-
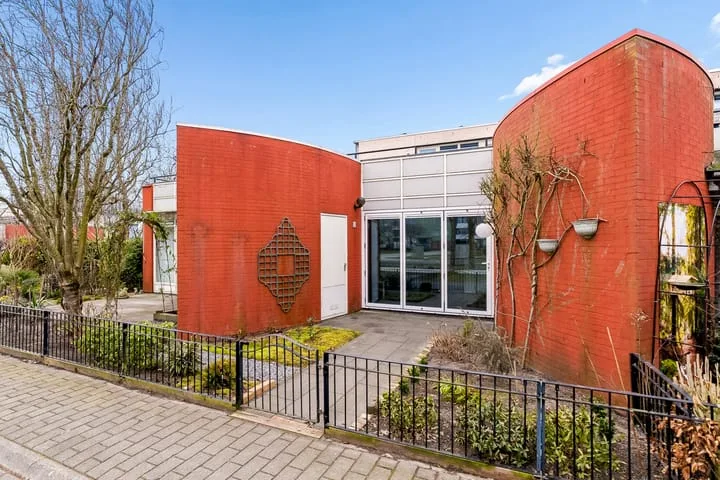
- Sold
Hennahof 32
1339EC Almere
€ 350.000 k.k.
€ 4.268/m²
ASave as favorite- Living area
- 82 m²
- Land area
- 153 m²
- Bedrooms
- 2
Reviews (58)
Review platforms
BronscoresTotal score
58 total reviews

Funda
27 reviews on Funda

31 reviews on Google
-
Ronald Van Hensen
10 -
Richard
10Translated by AIBaar Real Estate hired for a valuation report. The next day Wendy could already come by and 2 days after that I had the valuation report at home. Super fast service.
-
Kolkgriend 21
10Translated by AIContact with our real estate agent was very pleasant, they thought along well and we were well advised also regarding what we should all pay attention to and what we need to take into account... even regarding the additional matters such as purchasing our new home and regarding financing. I can recommend BAAR real estate agency to everyone, very good service!!
-
Eemplein 4
10Translated by AIWe had first engaged Wendy as a buyer's agent and were extremely satisfied. Therefore, we later also asked her to act as a seller's agent, and again she did that very well and professionally. We are super happy with her! She is highly knowledgeable, professional, and also has a nice sense of humor.
-
Terschellingstraat 57
10Translated by AIThe communication was really good. Good explanation of what the real estate agent could mean for us. Very friendly and thinks with us.
-
Burgvliet 113
10Translated by AIVery personal, no nonsense & highly professional. The only keywords that certainly fit BAAR Real Estate. The contact was very pleasant, businesslike but also certainly with the fine personal touch! In short BAAR Real Estate knows how it works, but even better also how it should be! Definitely BAAR is a recommendation! It's just that we still hope to continue living in our (purchased by BAAR Real Estate) dream home, otherwise we would certainly have BAAR Real Estate in our hands again …
-
Freyjaplantsoen 3
10Translated by AIContact with Wendy has always been very smooth. She is friendly, easy to reach and keeps you well informed of all developments. Just nice, normal and honest. If I ever need a real estate agent again, I will definitely go back to Wendy!
-
Meidoornstraat 21
10Translated by AIFrom the first appointment there was a good click, got also good tips from her. She also always called to report the progress
-
Casper Smit
10Translated by AIWe had a super fine experience with BAAR Makelaardij for the purchase of our new home. From our very first conversation, Wendy was professional yet relaxed, and she really listened to our wishes. She immediately understood what we were looking for and showed us only houses that perfectly matched our wishes. Throughout the entire process, her communication was excellent, clear, and realistic, making everything for us completely stress-free. Thanks to Wendy, we found and bought our dream house, and felt throughout the entire process fully in good hands. Absolutely a recommendation!
-
Rietganslaan 18
10Translated by AIWe had a super fine experience with BAAR Makelaardij for the purchase of our new home. From our very first conversation, Wendy was professional but relaxed, and she really listened to our wishes. She immediately understood what we were looking for and showed us only houses that perfectly matched our wishes. Throughout the entire process, her communication was excellent, clear, and realistic, making everything for us completely stress-free. Thanks to Wendy we have our d…
-
Karin Gooijer
10Translated by AIA very nice realtor, very professional and friendly without excessive fuss. She responds quickly to your questions and is involved both with the seller and the buyer.
-
Suut Kong
10Translated by AIWe engaged Wendy Baar as a buyer's agent and were extremely satisfied. She works quickly, smoothly, and spontaneously, which allowed us to purchase our house very quickly. She also has a sense of humor. Due to the pleasant collaboration, we immediately hired her as a sales broker as well!
-
Dettifossstraat 256
10Translated by AIIt was very easy to work with Wendy. Everything was perfectly arranged while I was on vacation and I also received good offers.
-
Stormzeil 52
10Translated by AIThanks to Wendy's expertise of the local housing market, we were able to purchase our new home. She helpfully assisted during negotiations and provided clear and pleasant advice. We could also count on her help when preparing all documents. It was very nice to have Wendy on our side in this special housing market. We hope never to move again, but hope that Wendy can help many other people in this way to find their dream home.
-
Jean Perrinstraat 15
10Translated by AIWe are incredibly happy with how Wendy helped us with the sale of our home. Her expertise, enthusiasm, personal contact, quick responses, beautiful photos and videos ensured that we had a very positive experience regarding the sale. Wendy also dedicated a lot of time to contacting interested parties for our property. A real estate agent we will recommend to everyone!
-
Arturo Toscaninistraat 21
10Translated by AIWe haven't always had consistently good experiences with real estate agents in the past, but Wendy completely turned that around for us. Wendy is very skilled, understands not only the market but also her clients. She helped us to get started simply by being very positive in her approach. We both felt very comfortable and there was immediately complete trust in Wendy's qualities. The result was accordingly good. But also the small things, being available voo…
-
Madernastraat 5
10Translated by AIWe engaged Wendy Baar as a buyer's agent and were extremely satisfied. She works quickly, smoothly, and spontaneously, which allowed us to purchase our house very quickly. She also has a sense of humor. Due to the pleasant collaboration, we immediately hired her as a sales broker as well!
-
De Eenvoud 15
10Translated by AIWe've known Wendy for a while now. She also sold our previous house. She is very customer-friendly, expert and experienced. We knew that we were in good hands!
-
Guadeloupestraat 97
10Translated by AIIt's not the first house Wendy has helped us with selling. So, the choice for Baar real estate was obvious as far as we were concerned. The contacts were always good. By our neighbors, Wendy was described as 'Your always cheerful realtor'. And we can only confirm that. Wendy is skilled, enthusiastic and knows what she's doing. If there were any questions or potential problems, they were resolved immediately in good consultation. We wholeheartedly recommend Baar real estate. Kees…
-
Prinses Margriethof 20
10Translated by AIFast and good contact via WhatsApp group. We were kept up to date and all sales technical matters were carried out perfectly.