Residents
26.678
Last year: 2026
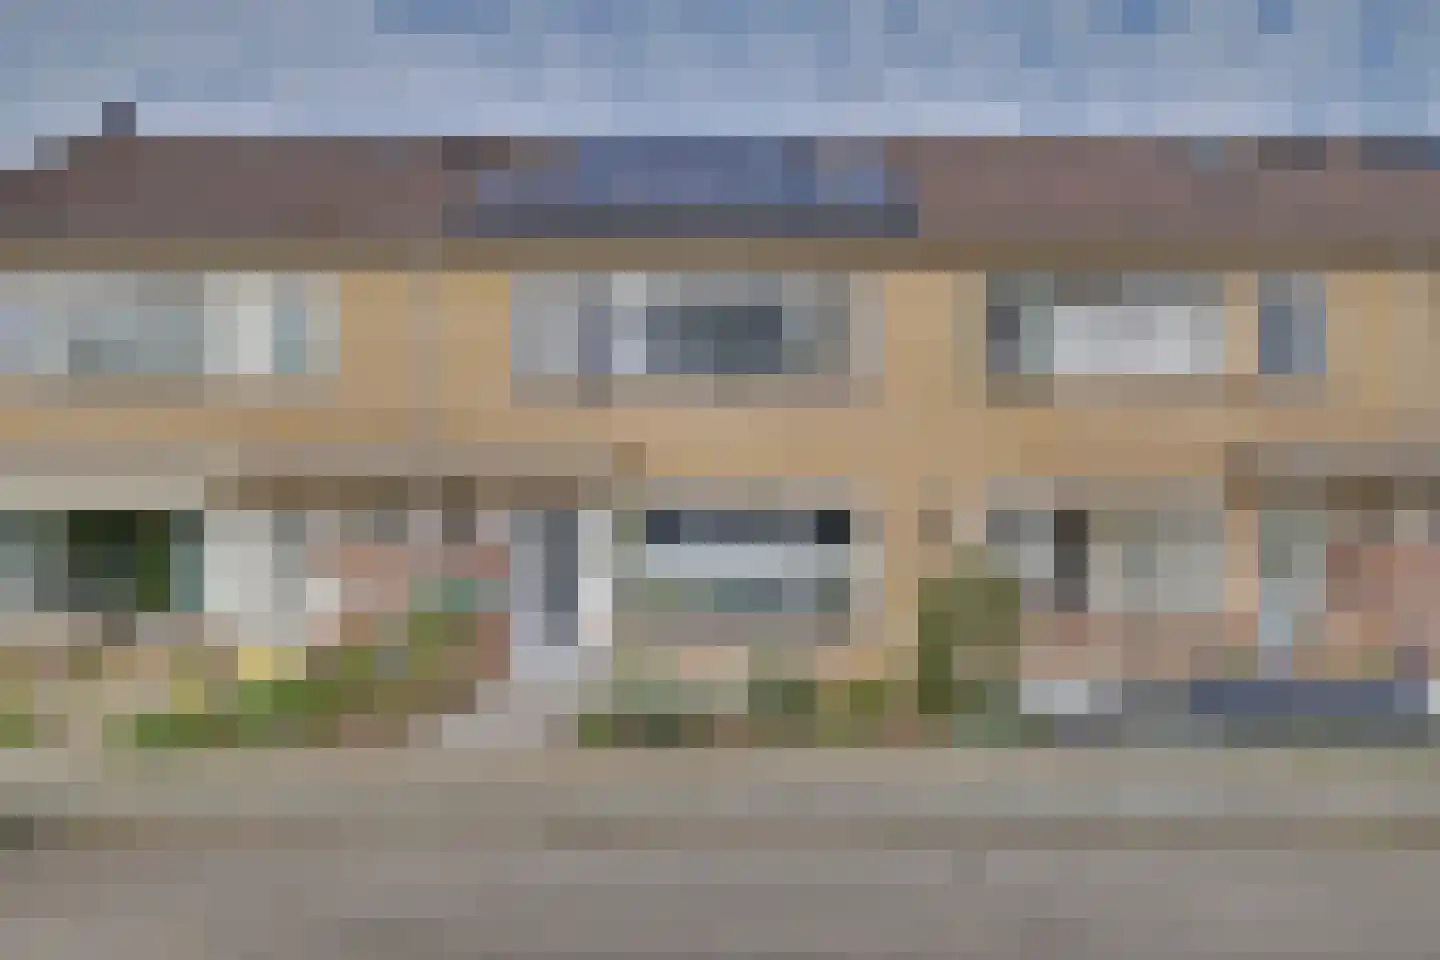
6902AR Zevenaar • Gelderland
€ 369.000 k.k.
Cost of copper (estimated): € 9.230
2% transfer tax (€ 7.380) + notary (€ 1.150) + valuation (€ 700)
Total incl. VAT: € 378.230
Purchase price /m²: € 3.050
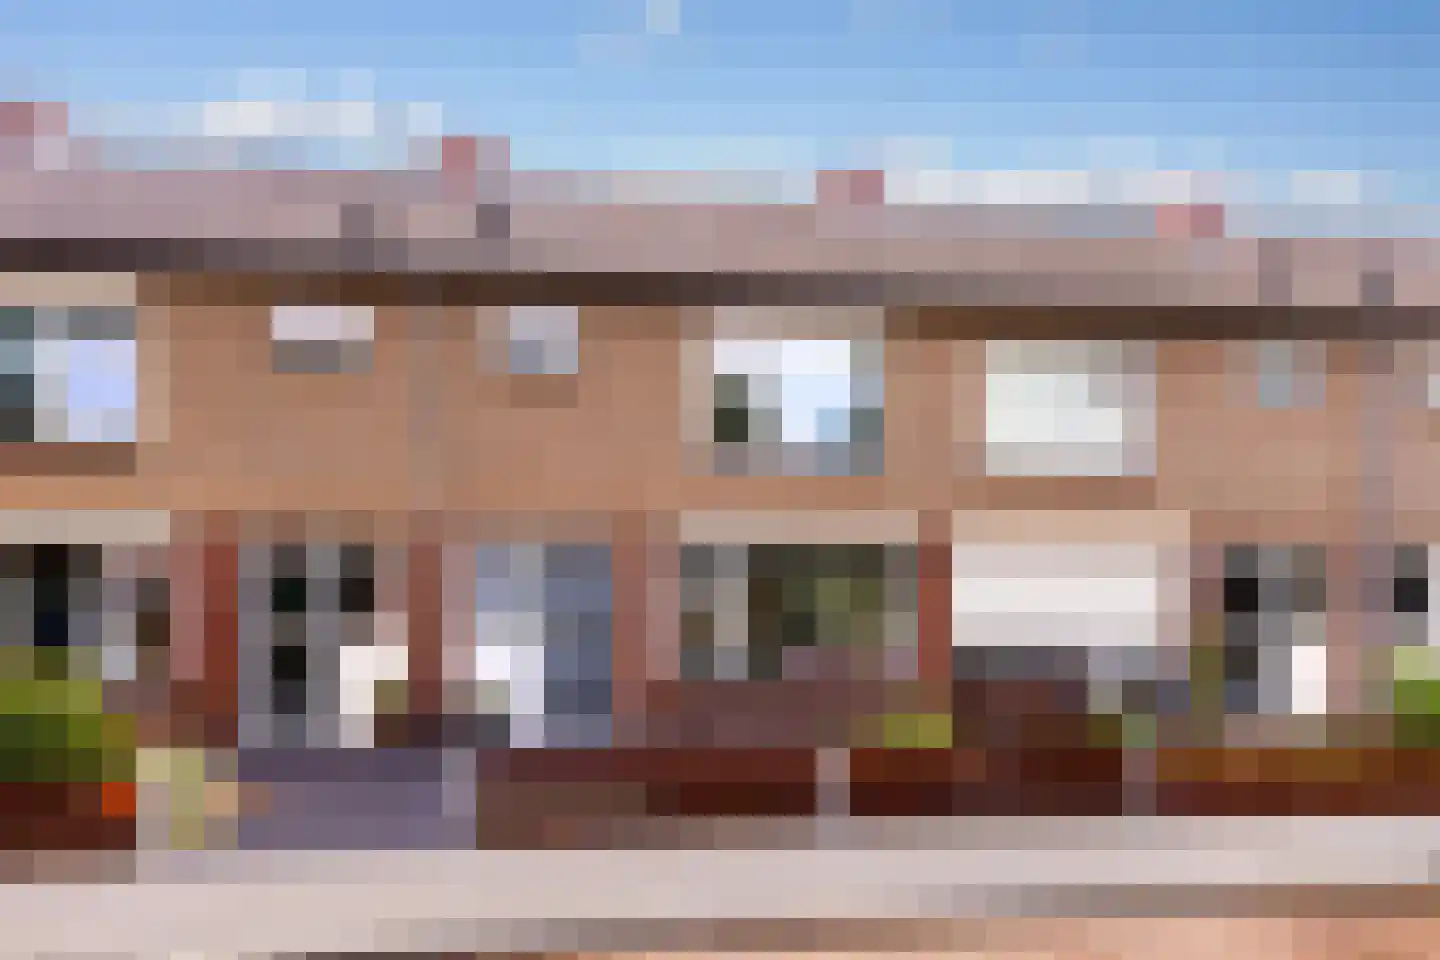
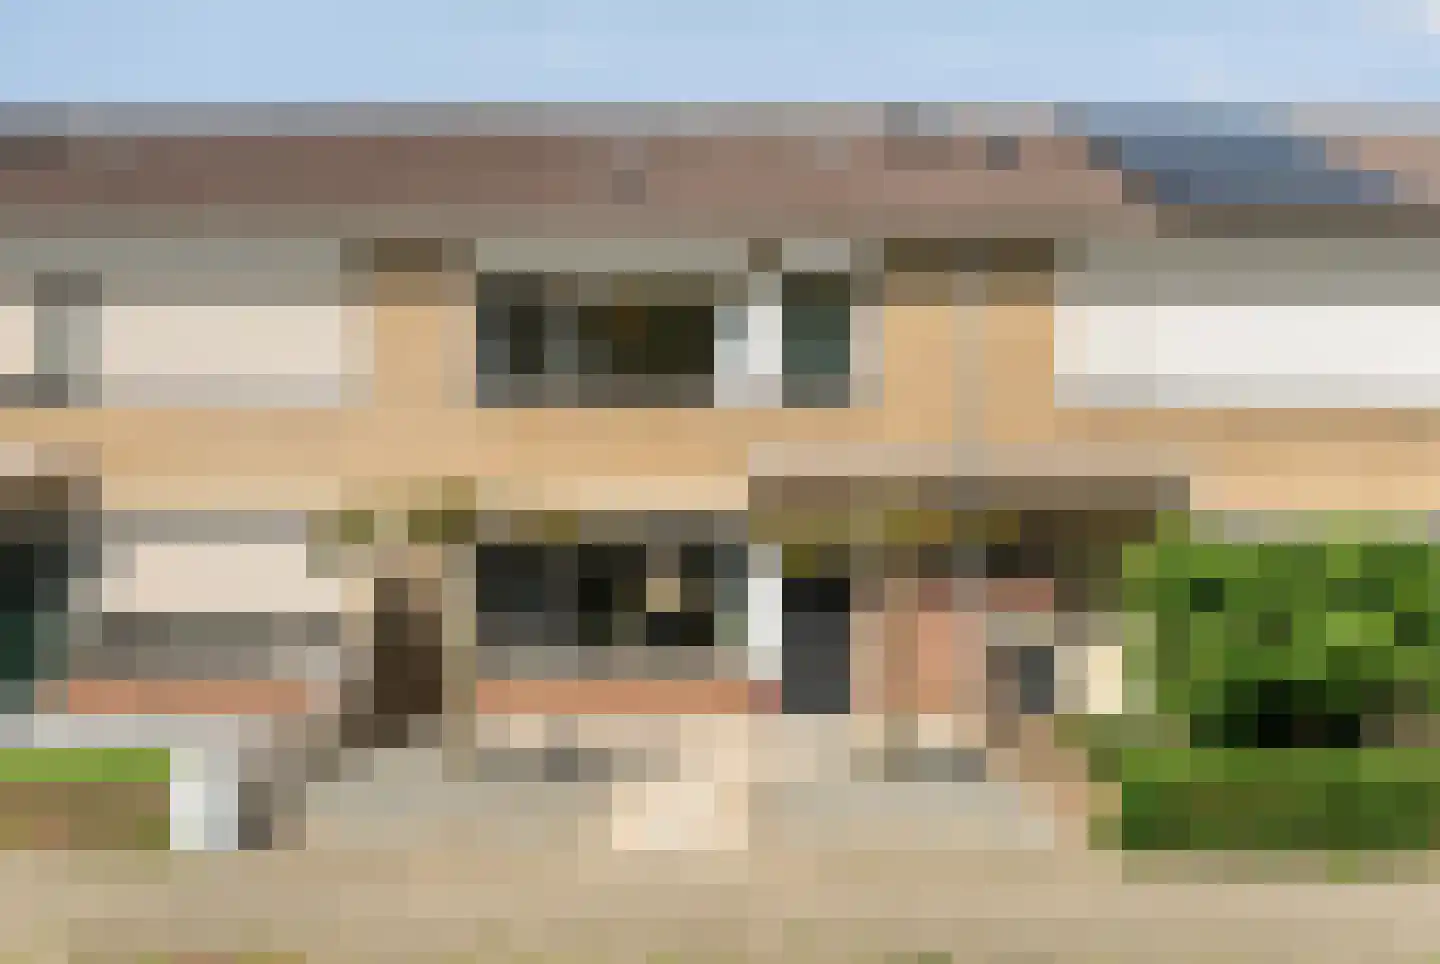
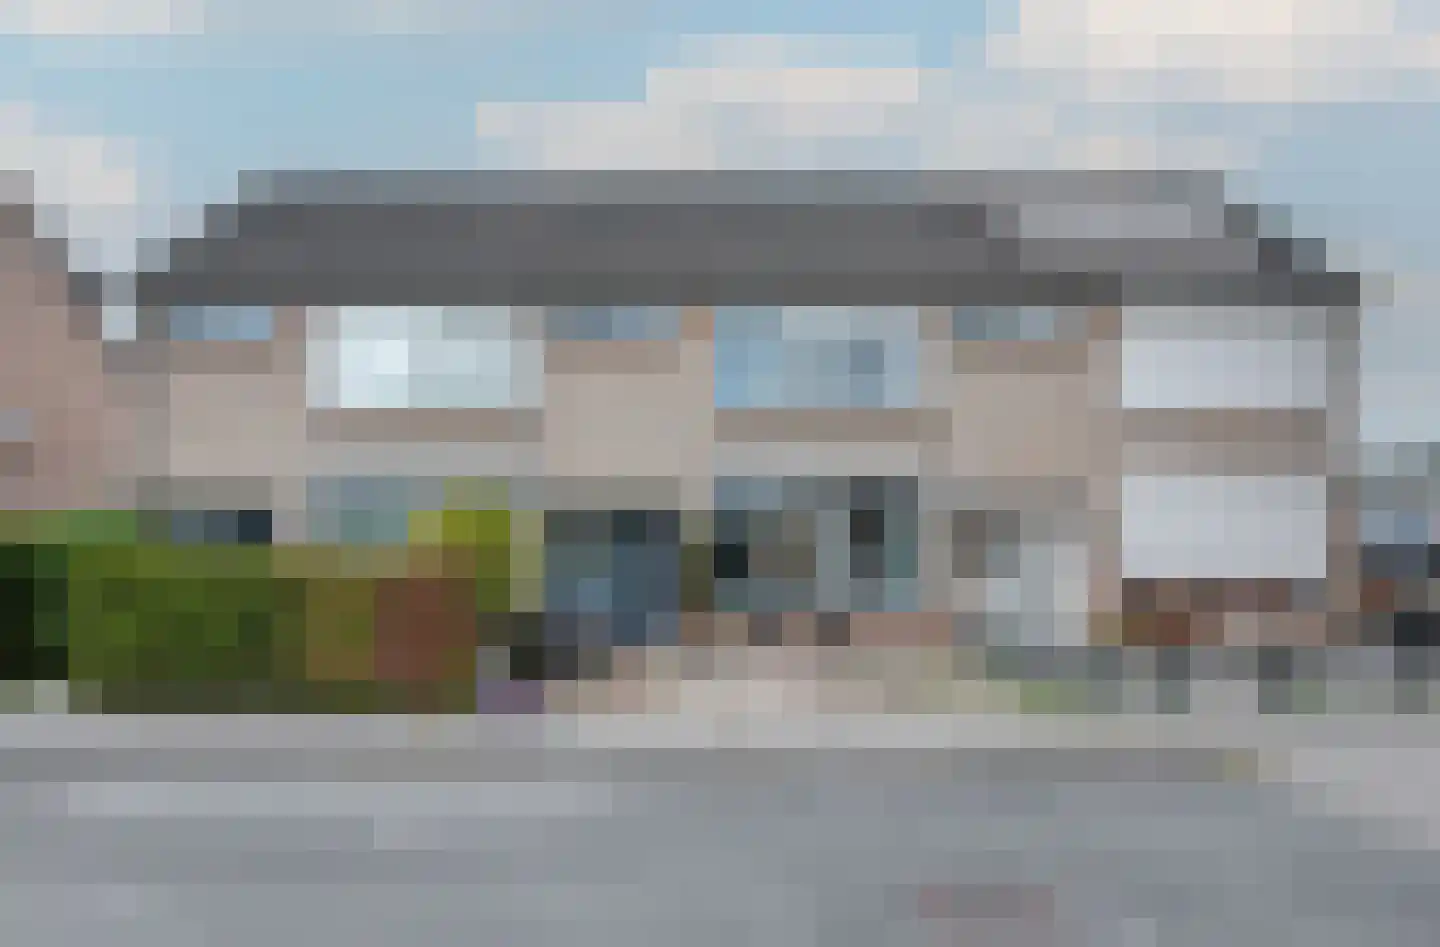
Instapklare tussenwoning aan een kindvriendelijk hofje! Welkom aan de Schepershof 27, een fijne eengezinswoning uit 1972. Met een comfortabel woonoppervlak van 121m2 en vier slaapkamers, schikt deze woning zich uitermate voor (jonge) stellen of gezinnen. Door de jaren heen is er volledig me gegaan in de tijd en zijn zowel de gevel, als het dak en de vloer na-geïsoleerd. Daarnaast zijn de kozijnen grotendeels uitgevoerd in kunststof én zijn er 12 zonnepanelen geplaatst (na het opstellen van het energielabel)! Daarnaast zijn zowel de badkamer, als keuken in keurige staat en is de volledige begane grond gestuct. De Horst is een kindvriendelijke woonwijk, welke bestaat uit verschillende, autoluwe hofjes. Het gezellige stadscentrum van Zevenaar is op enkele fietsminuten afstand gelegen en biedt een divers aanbod in winkelvoorzieningen en horecagelegenheden. Verder bevinden zich in de nabije omgeving van de woning o.a. een basisschool, sportverenigingen en verschillende speeltuinen. Kortom, een heerlijke woning op dé perfecte locatie! Indeling Entree via hal met trapopgang, vernieuwde meterkast en recent vernieuwd toilet v.v. fontein. Lichte woonkamer met glasvezelaansluiting en houtkachel (ter overname). De keuken is aan de achterzijde gelegen en uitgerust met diverse inbouwapparatuur zoals een vaatwasser, oven, 4-pits gaskookplaat en losstaande koel-vriescombinatie. Via de keuken kom je uit in de zonnige op het westen gelegen achtertuin, welke is te bereiken via een achterom en met vrijstaande stenen berging v.v. elektra en overkapping. Eerste verdieping Overloop met toegang tot de drie volwaardige slaapkamers, allen voorzien van kunststof kozijnen. De recent vernieuwde badkamer beschikt over een ruime inloopdouche, wastafel en een tweede toilet. Tweede verdieping Voorzolder met bergruimte en aparte stookruimte v.v. cv-installatie en wasmachine-/drogeraansluiting. Vierde, ruime slaapkamer met dakkapel en kunststof kozijn. Bijzonderheden Algemene informatie: - Bouwjaar 1972; - Woonoppervlakte 121m2; - Externe bergruimte 9m2; - Inhoud 454m3; - Perceeloppervlakte 148m2; - Energielabel C. Bijzonderheden: - Volledig na-geïsoleerd; - Grotendeels kunststof kozijnen; - 12 zonnepanelen aanwezig; - Keurige keuken en badkamer; - Wanden begane grond gestuct + vloeren vernieuwd; - Gelegen aan een rustig hofje.
€ 369.000
Cost of copper (estimated): € 9.230
2% transfer tax (€ 7.380) + notary (€ 1.150) + valuation (€ 700)
Total purchase (incl. p.p.): € 378.230
3,02%
Yearly
€ 18.450
Direct available
Estimated mortgage
Indicative gross monthly cost
Based on annuity and 30 year term
Indicative net monthly cost
iDisclaimer: this mortgage calculation is a simplified indication based on general assumptions. No rights can be derived from the results shown. Calculated with 10-annual interest (met NHG), automatically determined based on the price limit € 470.000. Source: 10-jaars rente uit mortgage_rates (08-06-2026 03:45).
Inloopdouche, toilet, en wastafel
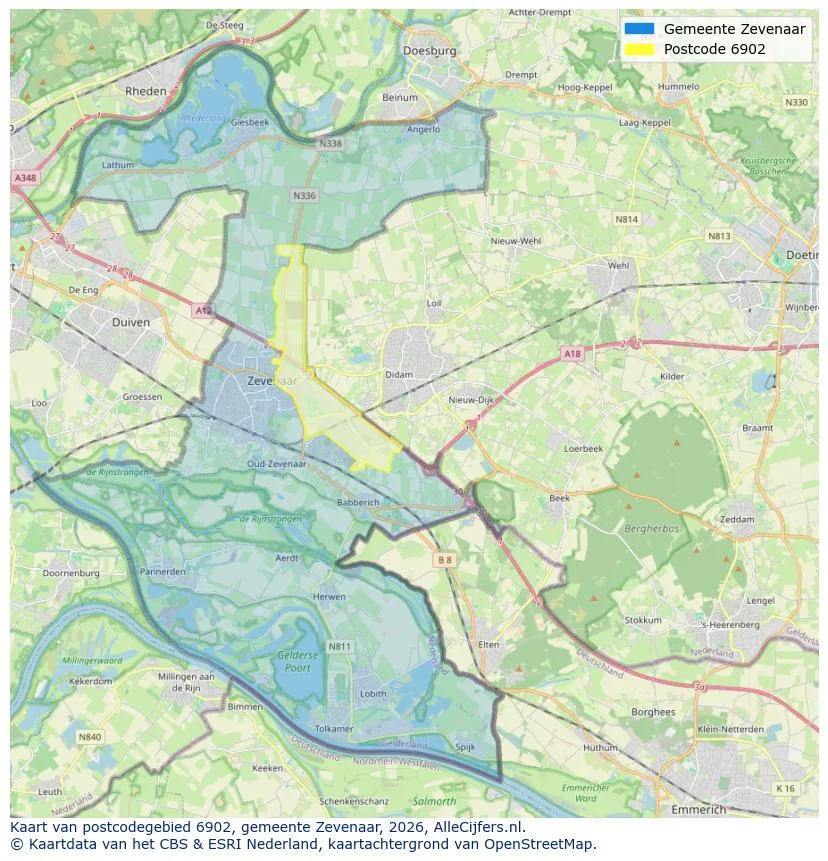
View the location and discover the brokers in this region
View current location data on residents, WOZ development, housing stock, energy consumption, business activity and safety in Zevenaar. In 2026 were there 26.678 residents. The average WOZ value in 2025 is EUR 323.000.
Residents
26.678
Last year: 2026
Average WOZ
EUR 323.000
Last year: 2025
Average income per person.
EUR 32.000
Source: AllNumbers
Crimes (current year)
820
Total registered
| Year | Residents |
|---|---|
| 2021 | 25.500 |
| 2022 | 26.020 |
| 2023 | 26.315 |
| 2024 | 26.370 |
| 2025 | 26.475 |
| 2026 | 26.678 |
| Year | Average WOZ |
|---|---|
| 2021 | EUR 227.000 |
| 2022 | EUR 255.000 |
| 2023 | EUR 292.000 |
| 2024 | EUR 309.000 |
| 2025 | EUR 323.000 |
Hoger
5.230
Praktisch
5.010
Middelbaar
8.840
Europa
1.925
Nederland
21.265
Buiten Europa
3.285
Label C
3.834
Label A
3.336
Label B
1.873
Label D
1.789
Label E
674
Label F
556
Label G
410
Label A+
257
Label A+++
231
Label A++
97
Label A++++
18
Label A+++++
14
| Year | Gas (m3) | Electricity (kWh) |
|---|---|---|
| 2020 | 1.100 | 2.830 |
| 2021 | 1.230 | 2.840 |
| 2022 | 960 | 2.680 |
| 2023 | 790 | 2.570 |
| 2024 | 790 | 2.640 |
Hoekwoning
Gas: 850 • Electricity: 2.680
Huurwoning
Gas: 690 • Electricity: 2.090
Koopwoning
Gas: 860 • Electricity: 2.860
Appartement
Gas: 570 • Electricity: 1.950
Tussenwoning
Gas: 780 • Electricity: 2.500
Vrijstaande woning
Gas: 1.180 • Electricity: 3.870
Twee-onder-één-kap woning
Gas: 900 • Electricity: 2.970
Total number of company establishments: 2.975
| Period | Crimes |
|---|---|
| jan 2026 | 72 |
| jul 2025 | 60 |
| jun 2025 | 65 |
| mei 2025 | 76 |
| mrt 2025 | 100 |
| mrt 2026 | 95 |
| nov 2024 | 65 |
| nov 2025 | 79 |
| okt 2024 | 73 |
| okt 2025 | 77 |
| sep 2024 | 77 |
| sep 2025 | 64 |
These figures give an indicative picture of safety trends in the living environment of Zevenaar.
Short answers based on current local statistics, handy for a quick comparison of the living environment.
Zevenaar telt in 2026 ongeveer 26.678 inwoners.
De gemiddelde WOZ-waarde in Zevenaar is in 2025 circa € 323.000.
Het gemiddelde inkomen per inwoner in Zevenaar ligt rond € 32.000 per jaar.
Voor het huidige jaar gaat het om ongeveer 820 geregistreerde misdrijven. Gebruik deze cijfers als indicatie en vergelijk trends per periode.
In Zevenaar komt vooral "Tussenwoningen" veel voor, met ongeveer 5.087 woningen.
View more homes in this location.
6904NT Zevenaar
€ 465.000 k.k.
€ 3.974/m²
6901LE Zevenaar
€ 275.000 k.k.
€ 2.778/m²

6901DG Zevenaar
€ 425.000 k.k.
€ 3.829/m²
6901ED Zevenaar
€ 375.000 k.k.
€ 3.571/m²

6903CN Zevenaar
€ 950.000 k.k.
€ 3.393/m²
6902BA Zevenaar
€ 375.000 k.k.
€ 3.125/m²

6905BH Zevenaar
€ 775.000 k.k.
€ 4.613/m²
6904BA Zevenaar
€ 335.000 k.k.
€ 2.617/m²
