
RMW Makelaars is a personal and professional office with locations in Wolvega and Drachten. Our team is active in multiple regions, including Oost- en Weststellingwerf, Heerenveen, Smallingerland and Opsterland. We offer you assistance with the purchase, sale or rental of a property and are ready to assist you with validated appraisals, such as those from NWWI. In addition, we mediate in new build projects within the region. Our office...
Current housing stock
-

- Available
Bosbes 1
8471ZJ Wolvega
€ 485.000 k.k.
ASave as favorite- Living area
- 140 m²
- Land area
- 220 m²
- Bedrooms
- 4
-

- Available
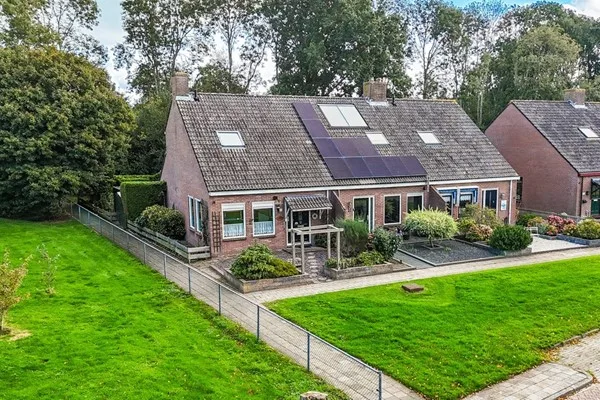
Steenwijkerweg 42
8471LC Wolvega
€ 654.000 k.k.
€ 3.737/m²
ASave as favorite- Living area
- 175 m²
- Land area
- 1041 m²
- Bedrooms
- 4
-

- Available
Kruistraat 12
8471HH Wolvega
€ 385.000 k.k.
€ 2.750/m²
CSave as favorite- Living area
- 140 m²
- Land area
- 496 m²
- Bedrooms
- 4
-

- Available
Haulerweg 22
8471AL Wolvega
€ 385.000 k.k.
€ 5.133/m²
FSave as favorite- Living area
- 75 m²
- Land area
- 405 m²
- Bedrooms
- 3
-

- Available
Atalantastraat 15
8448EZ Heerenveen
€ 495.000 k.k.
€ 3.300/m²
A+Save as favorite- Living area
- 150 m²
- Land area
- —
- Bedrooms
- 2
-

- Available
Mauritsweg 3
8391KC Noordwolde
€ 595.000 k.k.
€ 2.975/m²
ASave as favorite- Living area
- 200 m²
- Land area
- 500 m²
- Bedrooms
- 5
Reviews (68)
Review platforms
BronscoresTotal score
68 total reviews

Funda
60 reviews on Funda

8 reviews on Google
-
Heerenveenseweg 44
10Translated by AIGood preparation, lots of knowledge and easy and quick contact. I was kept well informed and top supported during the sale.
-
Hoofdstraat Oost 46
10Translated by AIA real estate agent with a clear vision. Works quickly and is especially clear and comes to all appointments directly after.
-
de Fortuin 235
9Translated by AIThe real estate agent was friendly and gave a sense of familiarity. Has a lot of experience in the region so that made the advice reliable.
-
Ir.Lelylaan 56
10Translated by AIGood contact with both real estate agent(s) and staff members. Frequently kept informed about the progress. All in all, an office to do business with.
-
Wilhelminastraat 11
10Translated by AIThe contact was quick and smooth. There was a quick switch, good listening and expert handling. The expectations were clear in advance and therefore the process from taking photos to sale went quickly and transparently.
-
Sportlaan 21
9Translated by AIWe sold the house with very good satisfaction. The contact between us and the real estate agent was experienced as very pleasant. Because of this good experience, we would recommend this real estate agent to everyone.
-
Eikenlaan 3
9Translated by AIThe agent's performance was very good. The agent showed a lot of drive and went out of their way to do extra work.
-
Raadhuisstraat 37
9Translated by AIFound the contact with the real estate agent pleasant. Clear and businesslike. Has done an excellent job.
-
Lycklamaweg 160
9Translated by AIExtensive contact, we were kept informed about the viewings, the number of registrations. After completion of viewing evaluation. Very pleasant and good contact with both the real estate agents as well as the team at the office.
-
Lindenoord 2
10Translated by AIFirst real estate agent expert always optimistic all time for you and more I don't know but still need some characters have
-
Keiweg 53
9Translated by AIExcellent real estate agent, always had good contact. Ronald has also helped well with the purchase of our new home.
-
Blomslaan 1
9Translated by AIThe contact was open, pleasant and professional. The entire process from registration to sale has been experienced by me in a professional manner. No hiccups have occurred. The sale also took place in a short time.
-
Raadhuisstraat 10
10Translated by AIFirst-class real estate agent. Competent and pleasant to deal with
-
De Brogge 34
10Translated by AI* Short-term appointment possible; * Complete and clear story; * Short lines and clear communication; * Fine team that is accessible and keeps appointments. Appointment is appointment!
-
Kerkstraat 54
9Translated by AIThe contact went well and everything was arranged and handled to full satisfaction. Only done business with this real estate agent and therefore can't say anything about the work of other agents.
-
Heideblauwtje 24
9Translated by AIVery good guidance and thinking along, also everything was arranged very quickly to put the house online and also during the sale everything was handled quickly and well, for which our thanks!
-
Sylvia Hartendorp
2Translated by AIRegarding project 'Beautiful Noordwolde', I cannot describe their approach any differently than: - Unreliable; - Misleading; - Careless; - Sloppy; - Slow. Withholds information and lies, for example, about the large garden. Gardens that border on the ditch / main waterway come out very unfavorably. From the ditch goes 5 m of garden away. Half, then. You are expected to pay for these meters including the meters of the talus against a cost price of build-ready land. You only pay €42000,- for land that you have to maintain and with which you cannot do anything and may not even put up a fence. In our first conversation, we specifically asked how many meters would go from the garden. His answer: takes into account about 2 meters. You can place a few mobile planters there. Okay, that is still acceptable for us. When we wanted to buy the house (subject to financing), we received additional documents and of course the purchase contract. From this it became clear that we had been misled. It was a conscious choice not to provide all documents in advance. They play on your emotions and make clever use of them. When we confronted him with this, he lied about everything. This explains why so many interested parties drop out. This is just one argument. The rest I will leave aside otherwise the message becomes too long 🤨 Additionally, the cost price per square meter is not transparent in comparison to the other plots. Ultimately, we decided against the purchase.
-
Dahliastraat 18
9Translated by AIGood advice that led to the house being sold quickly. The communication was clear and good. A pleasant real estate agent.
-
Sportlaan 5
9Translated by AIGood and expert guidance during the sale of the property. The contact moments were pleasant and professional.
-
Heerenveenseweg 77
10Translated by AIFantastic guidance. The sale of my parents' house went very well. We were completely taken care of. Thank you very much, Ronald!