Dichtbij Vastgoed
Close to Real Estate in Voerendaal stands for personal and committed real estate service in a region with lots of living space and quality. We are actively working in regions such as Bocholtz, Heerlen and Vaals, where we focus on finding the right match for our customers. Our promise is to help with care and professionalism in the sale, purchase or valuation of homes. We offer services such as sales, purchases and valuations, with a foc...
Current housing stock
-
- Available
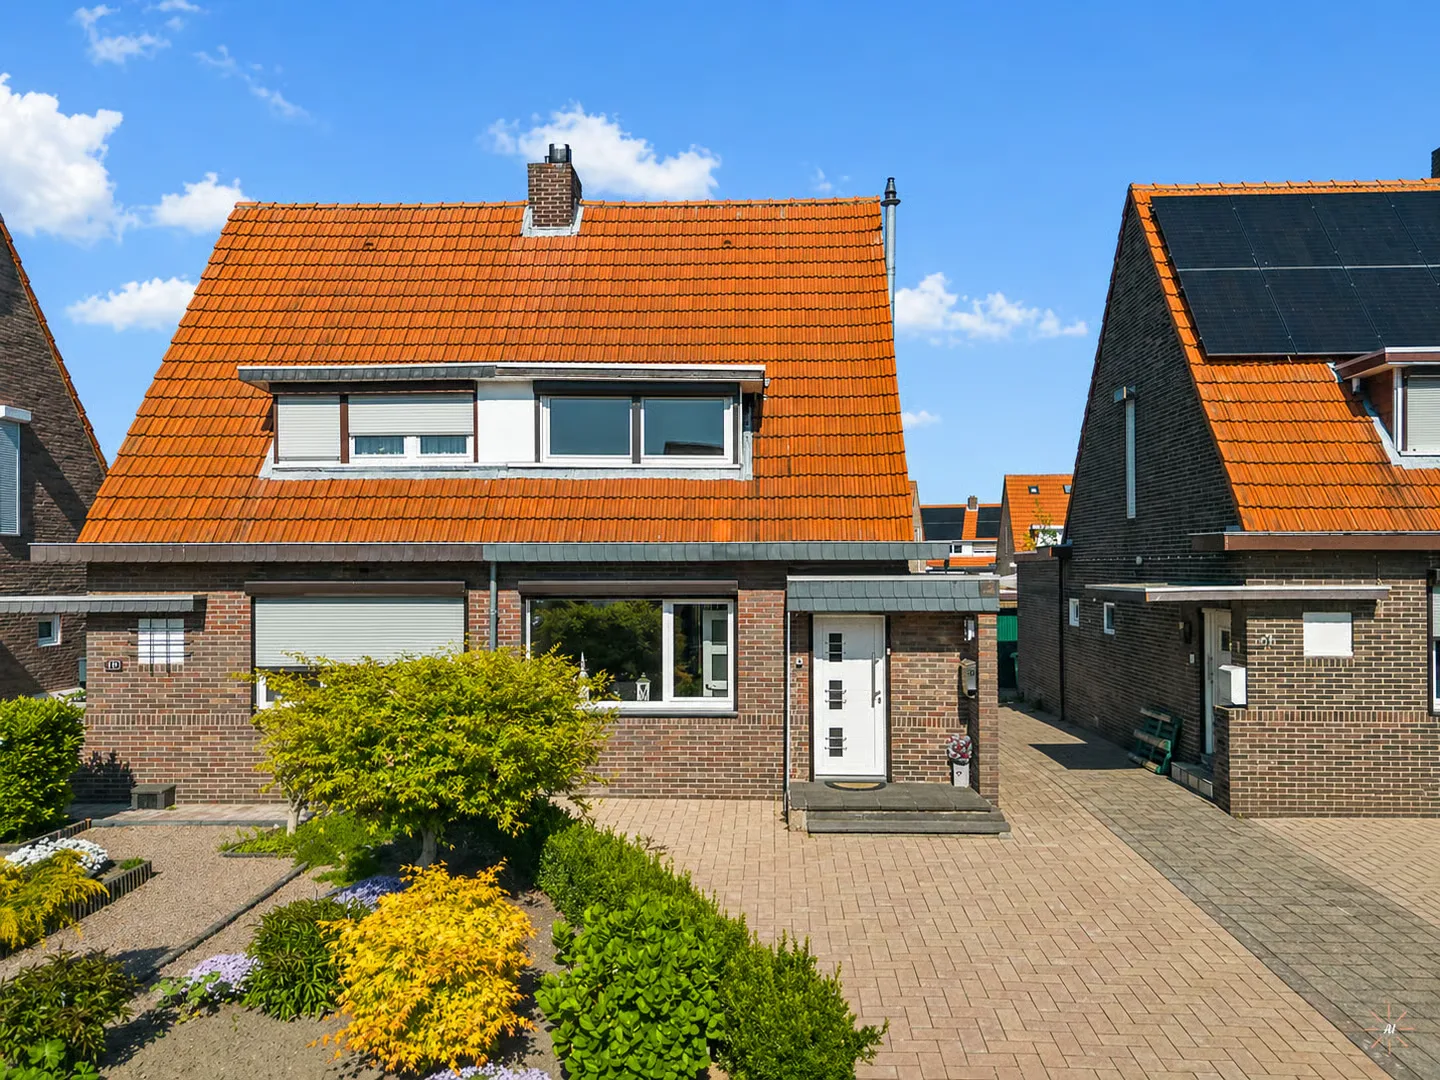
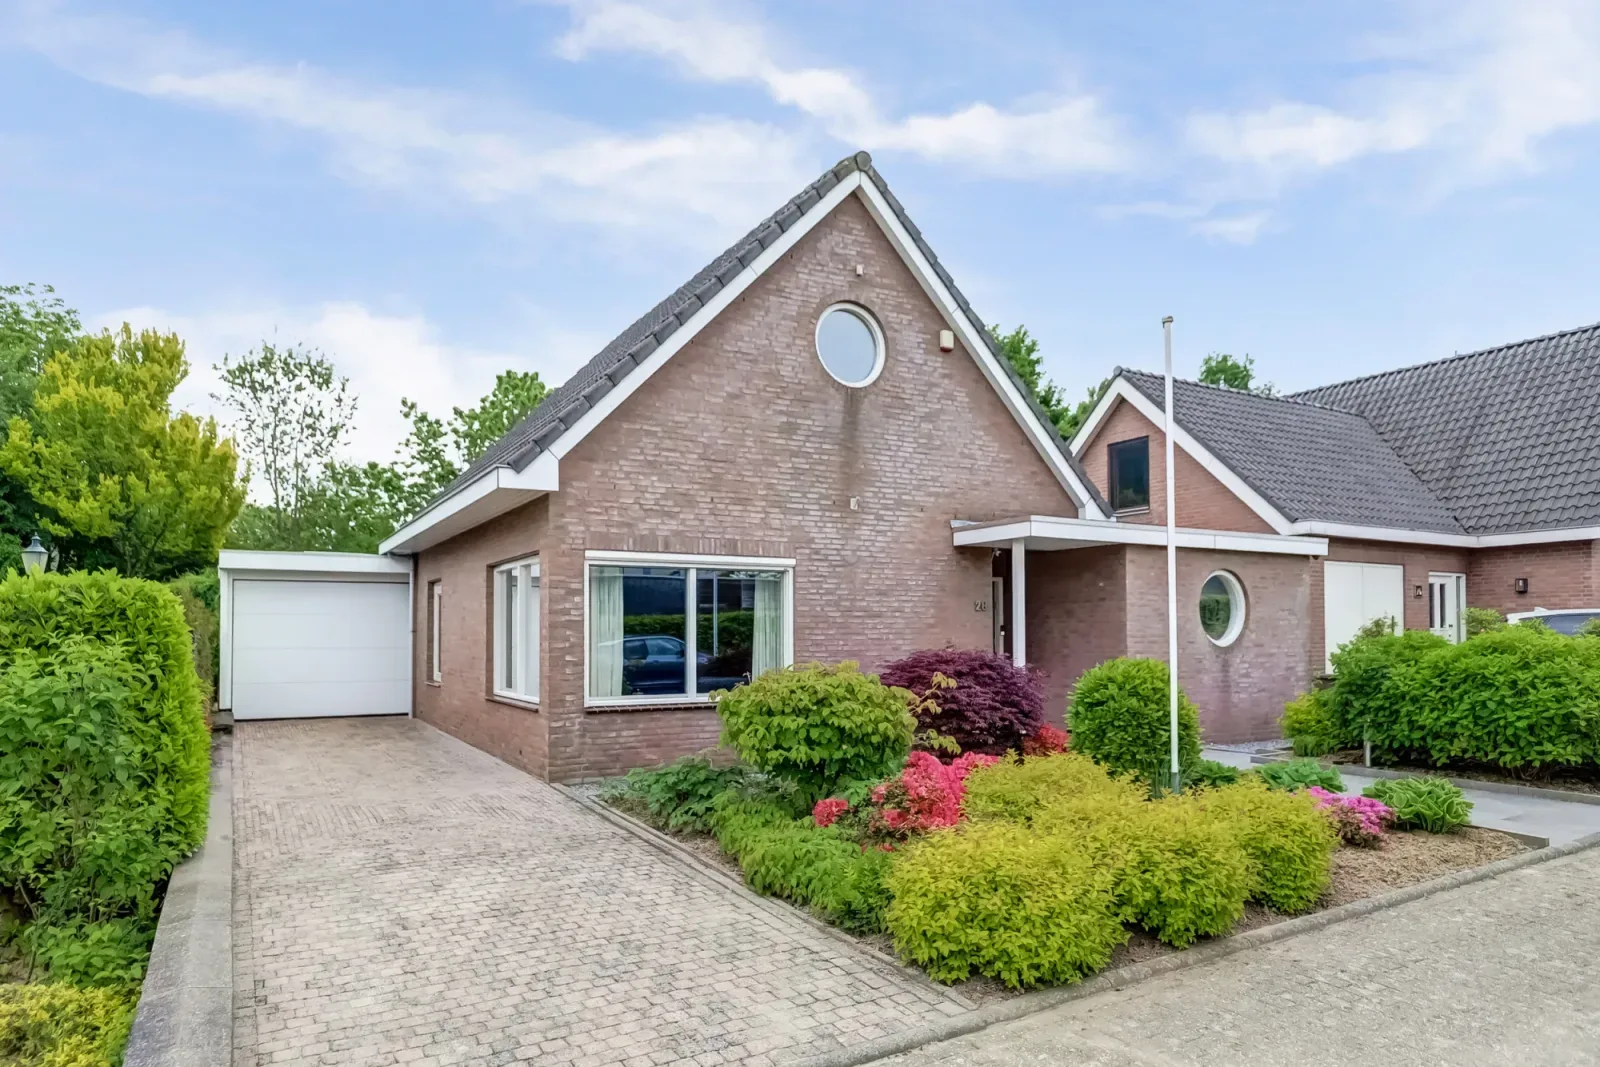
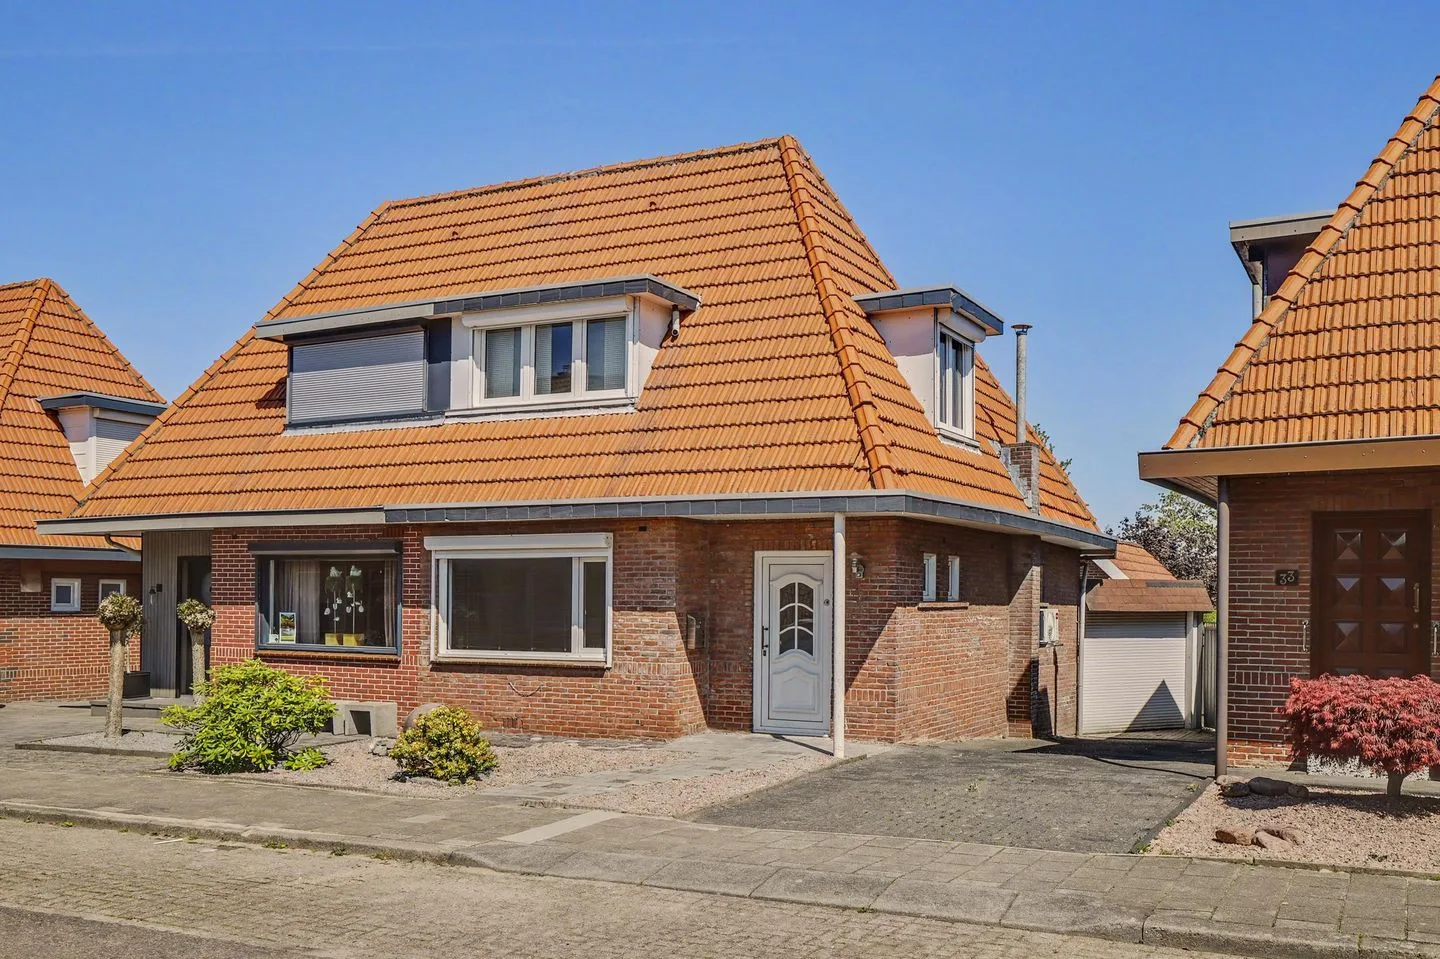
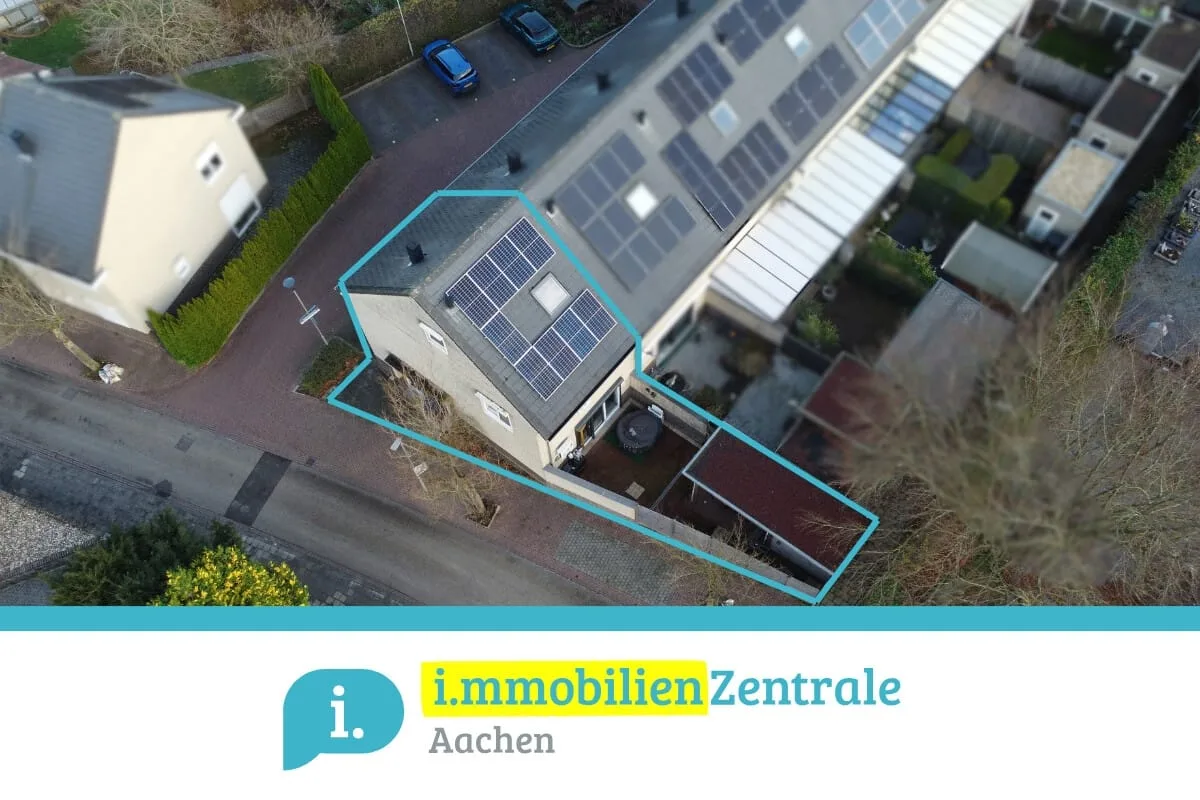
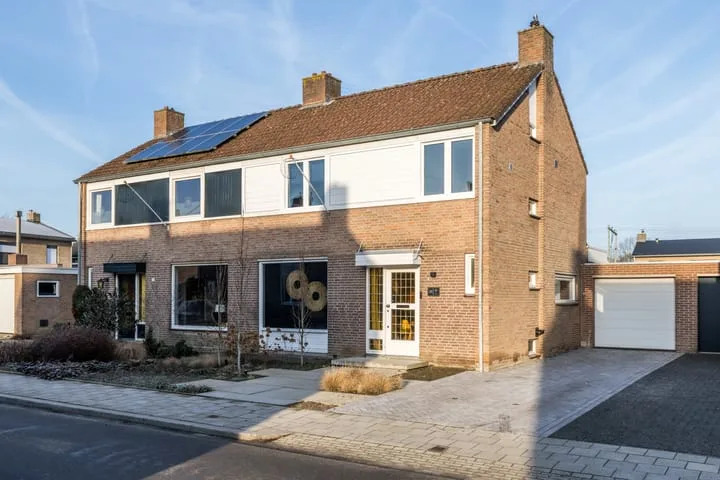
Nagelbeek 53
6365EJ Schinnen
€ 269.000 k.k.
GSave as favorite- Living area
- 103 m²
- Land area
- 450 m²
- Bedrooms
- 2
-
- Available
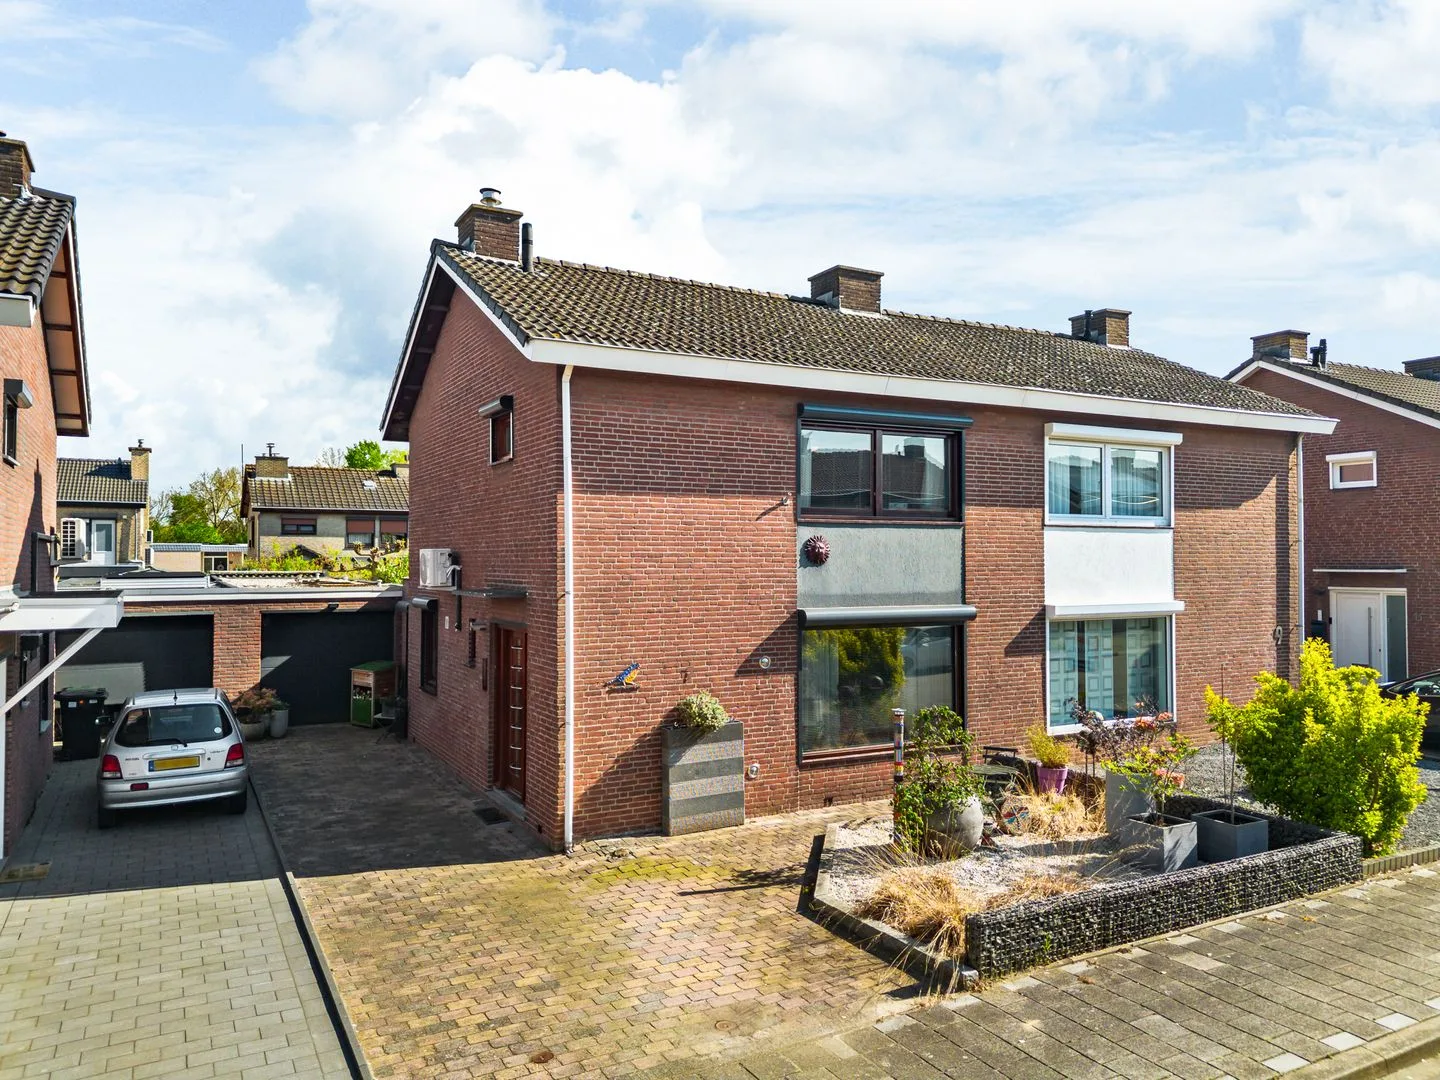
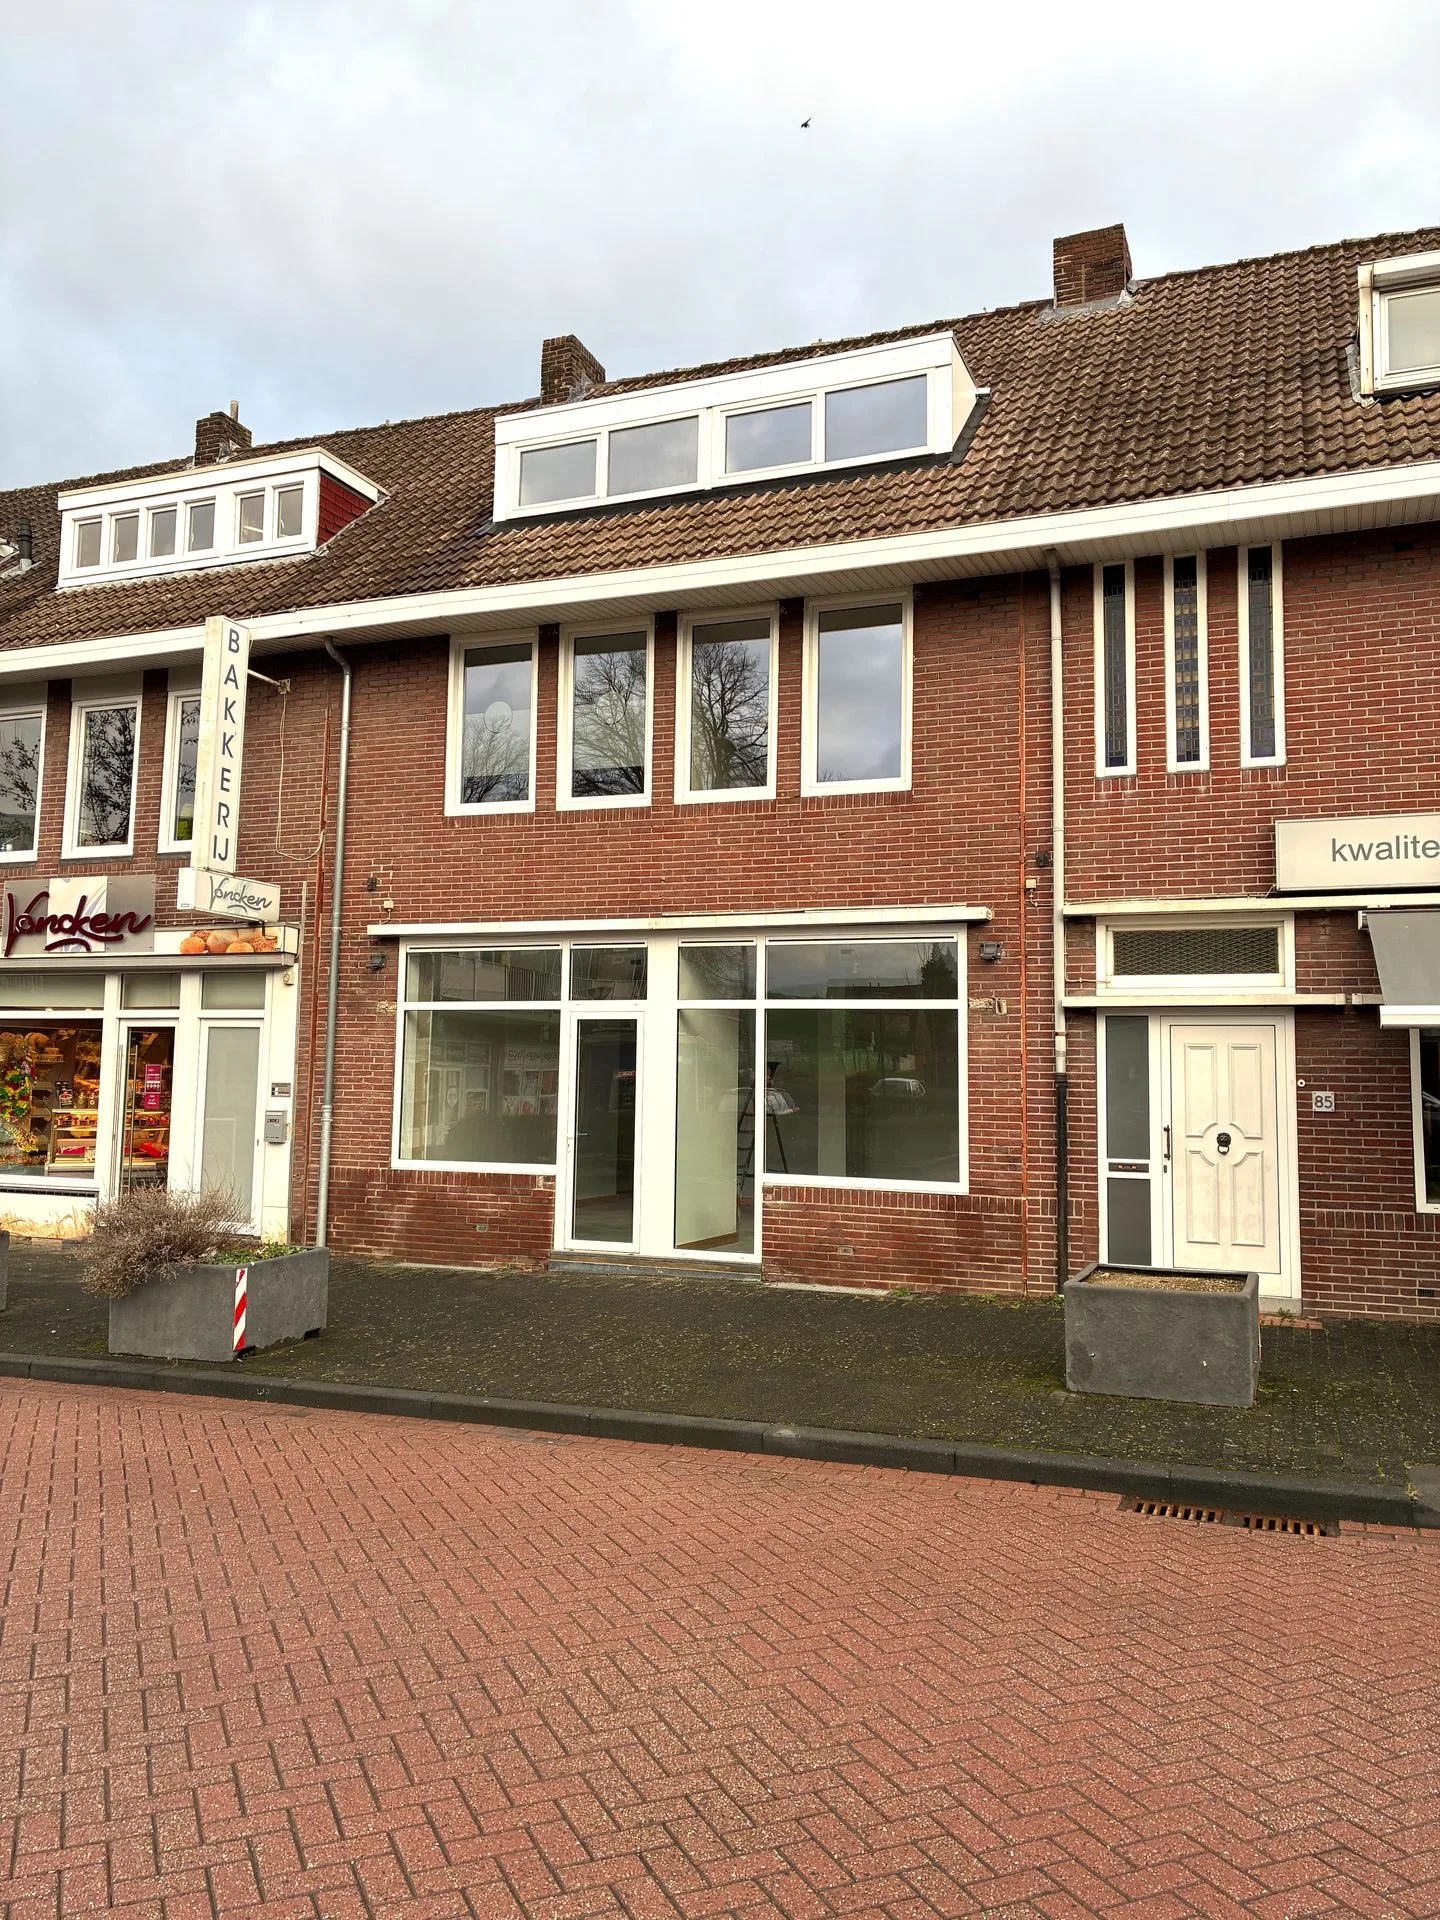
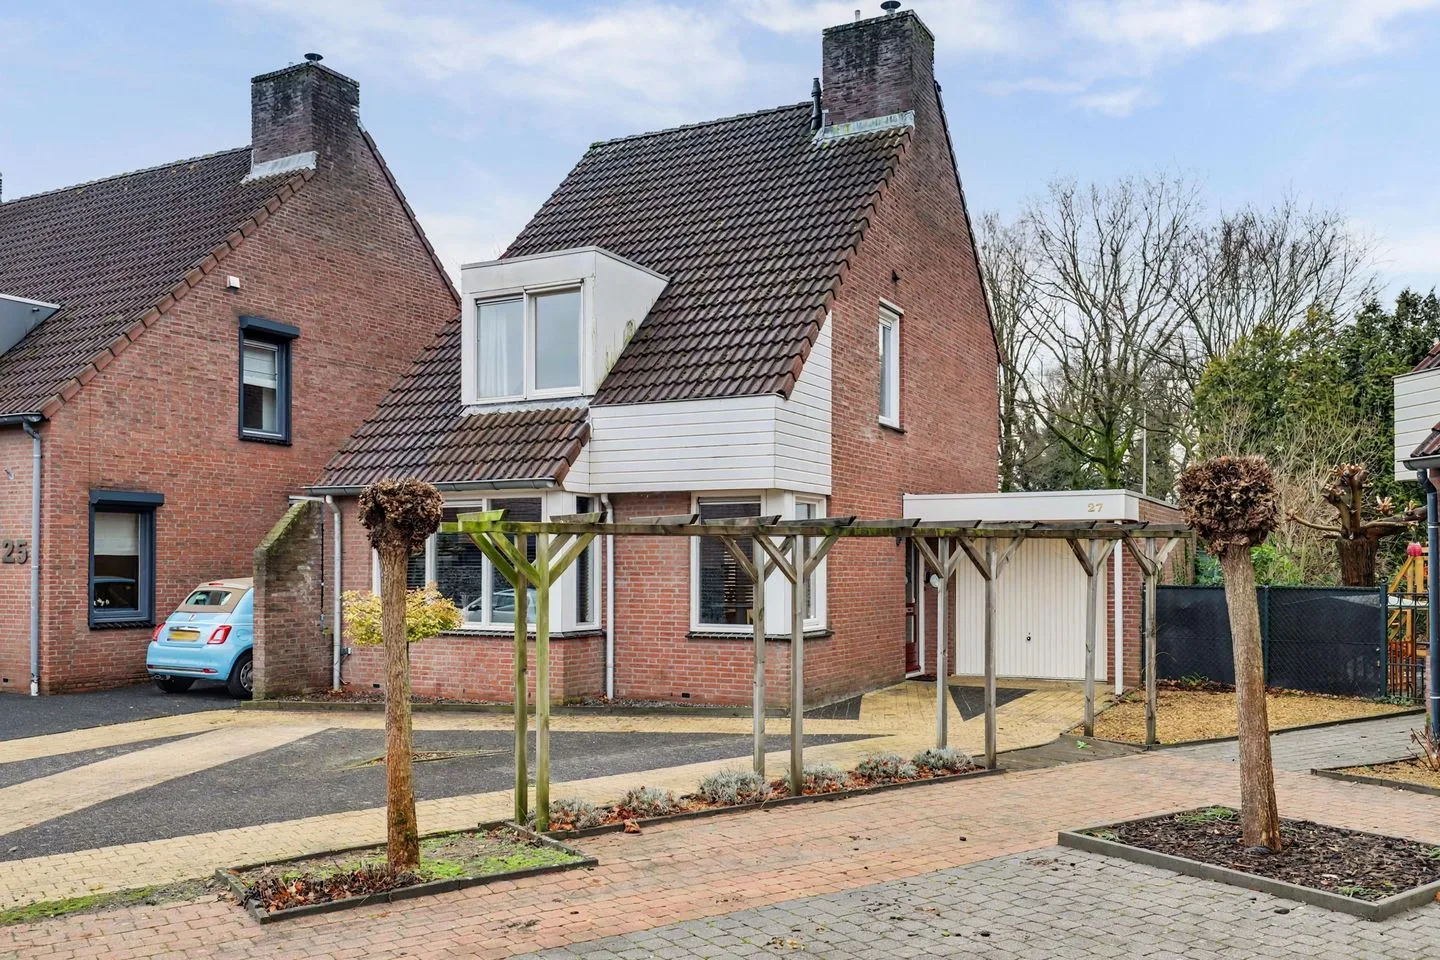
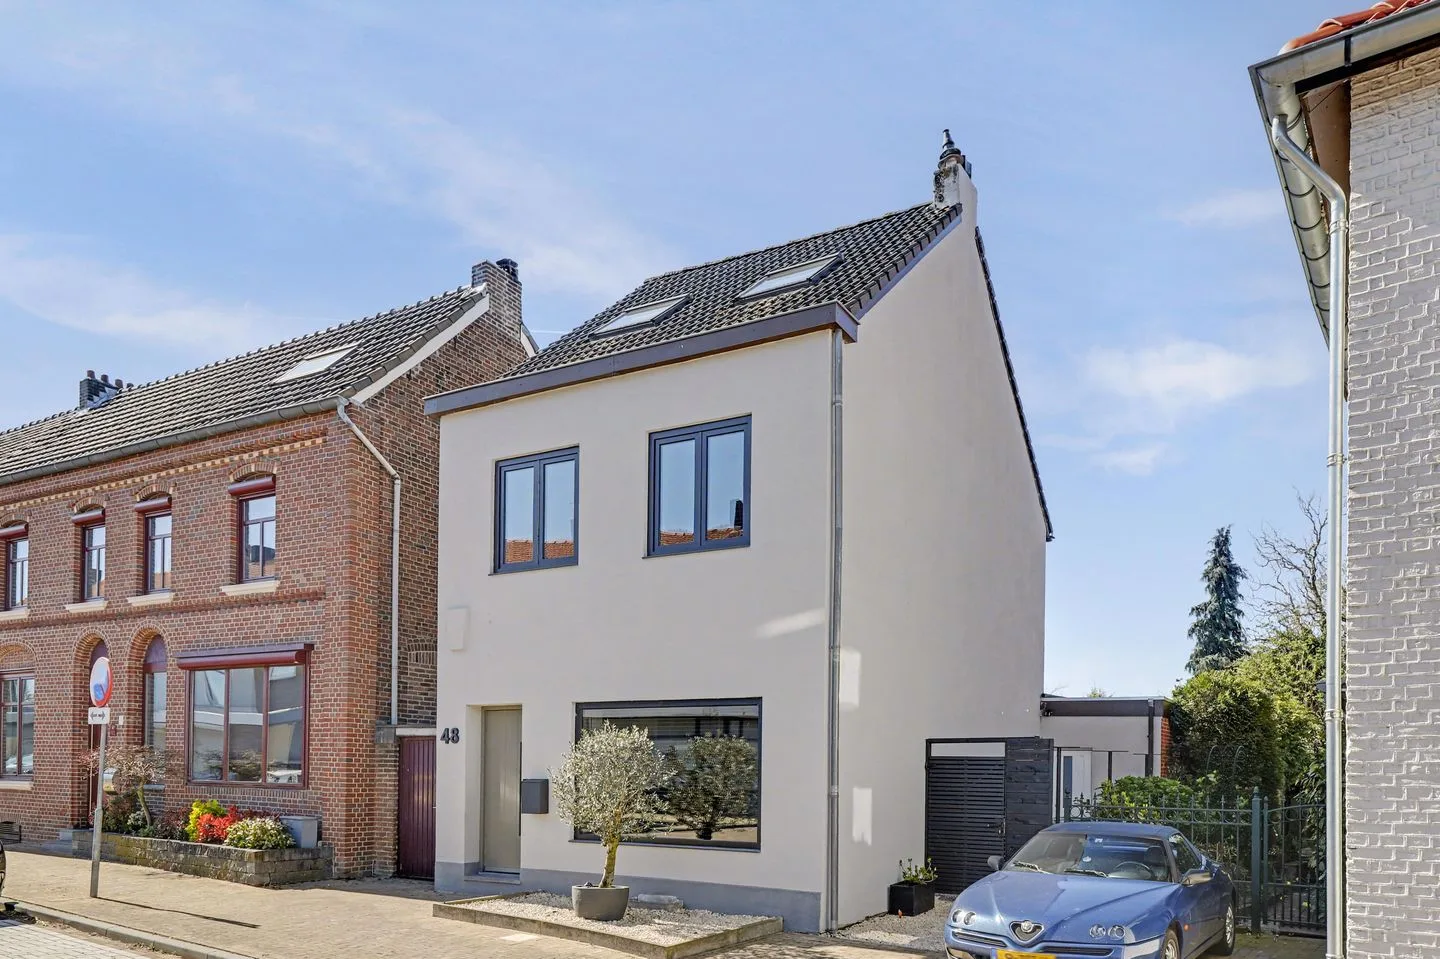
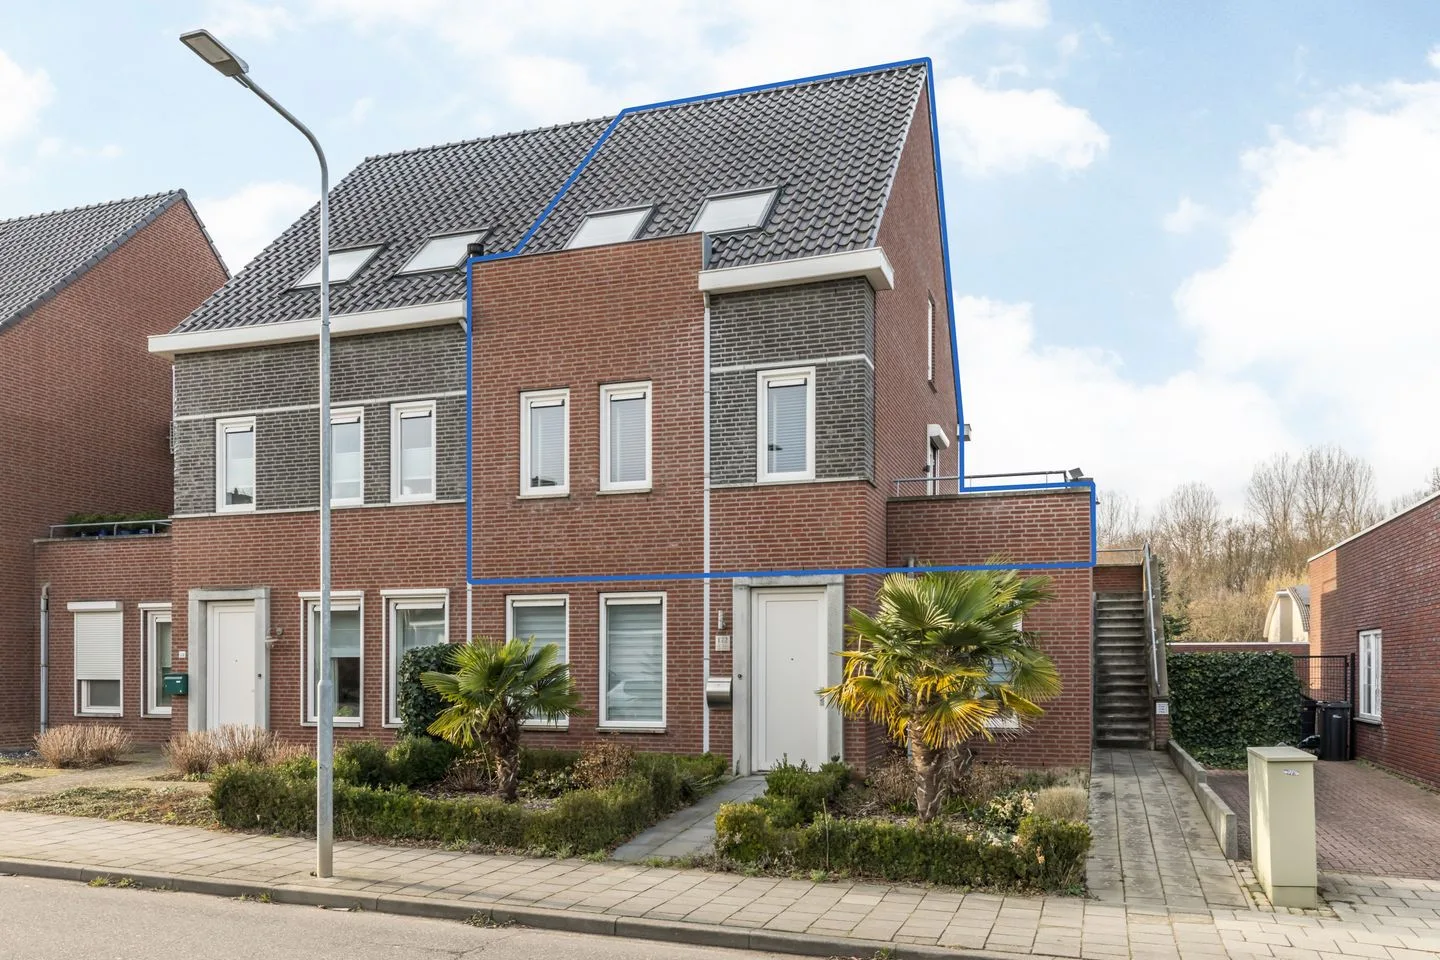
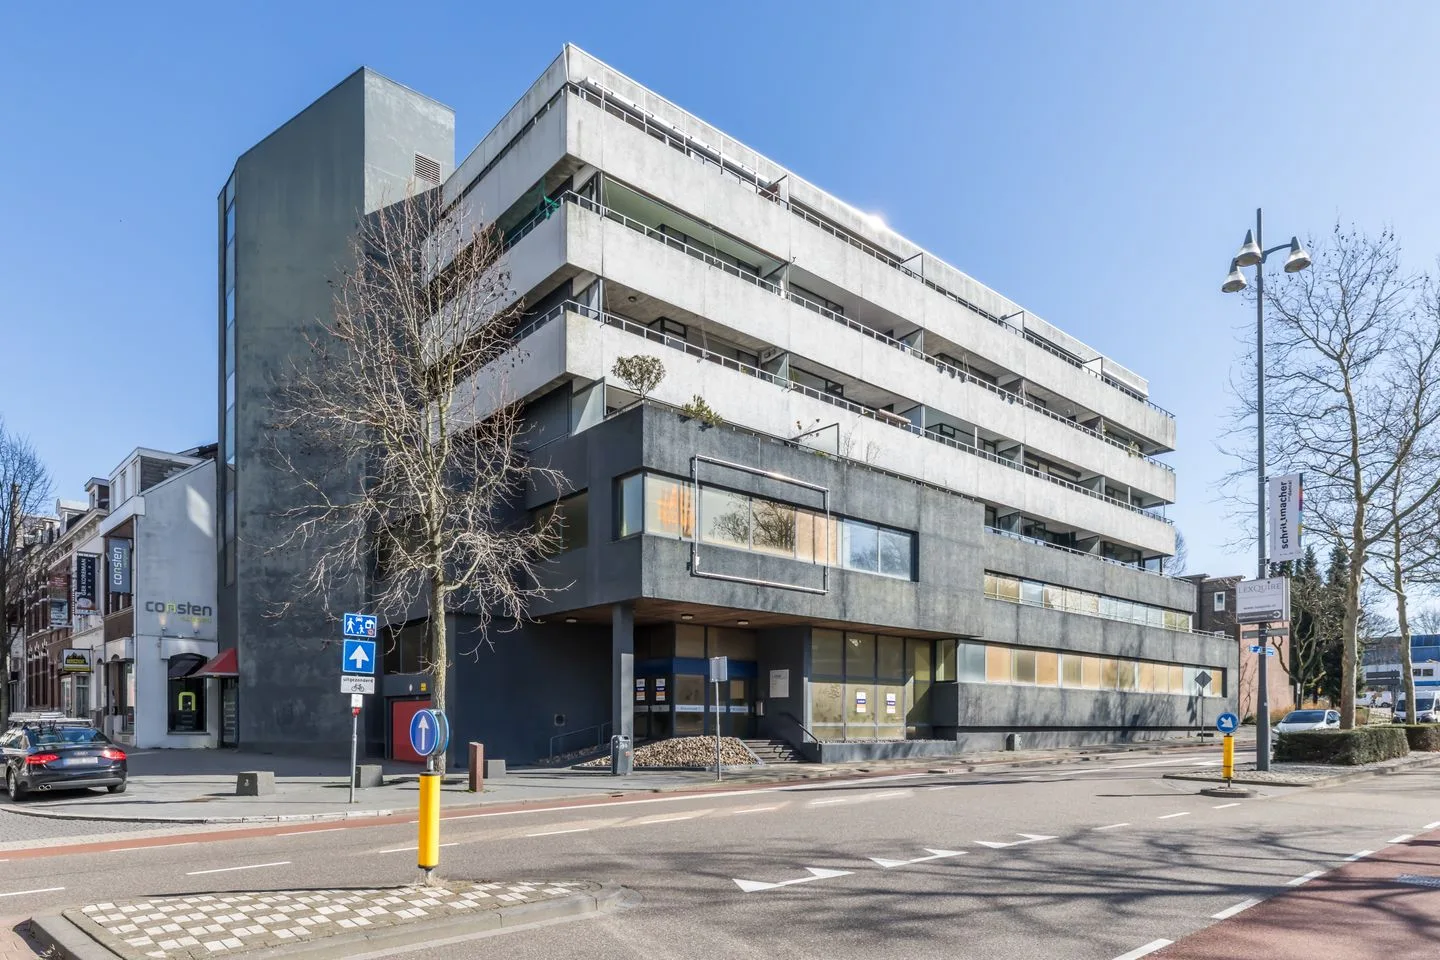
Tenelenweg 172 A
6367VZ Voerendaal
€ 235.000 k.k.
€ 2.733/m²
ASave as favorite- Living area
- 86 m²
- Land area
- —
- Bedrooms
- 2
-
- Available
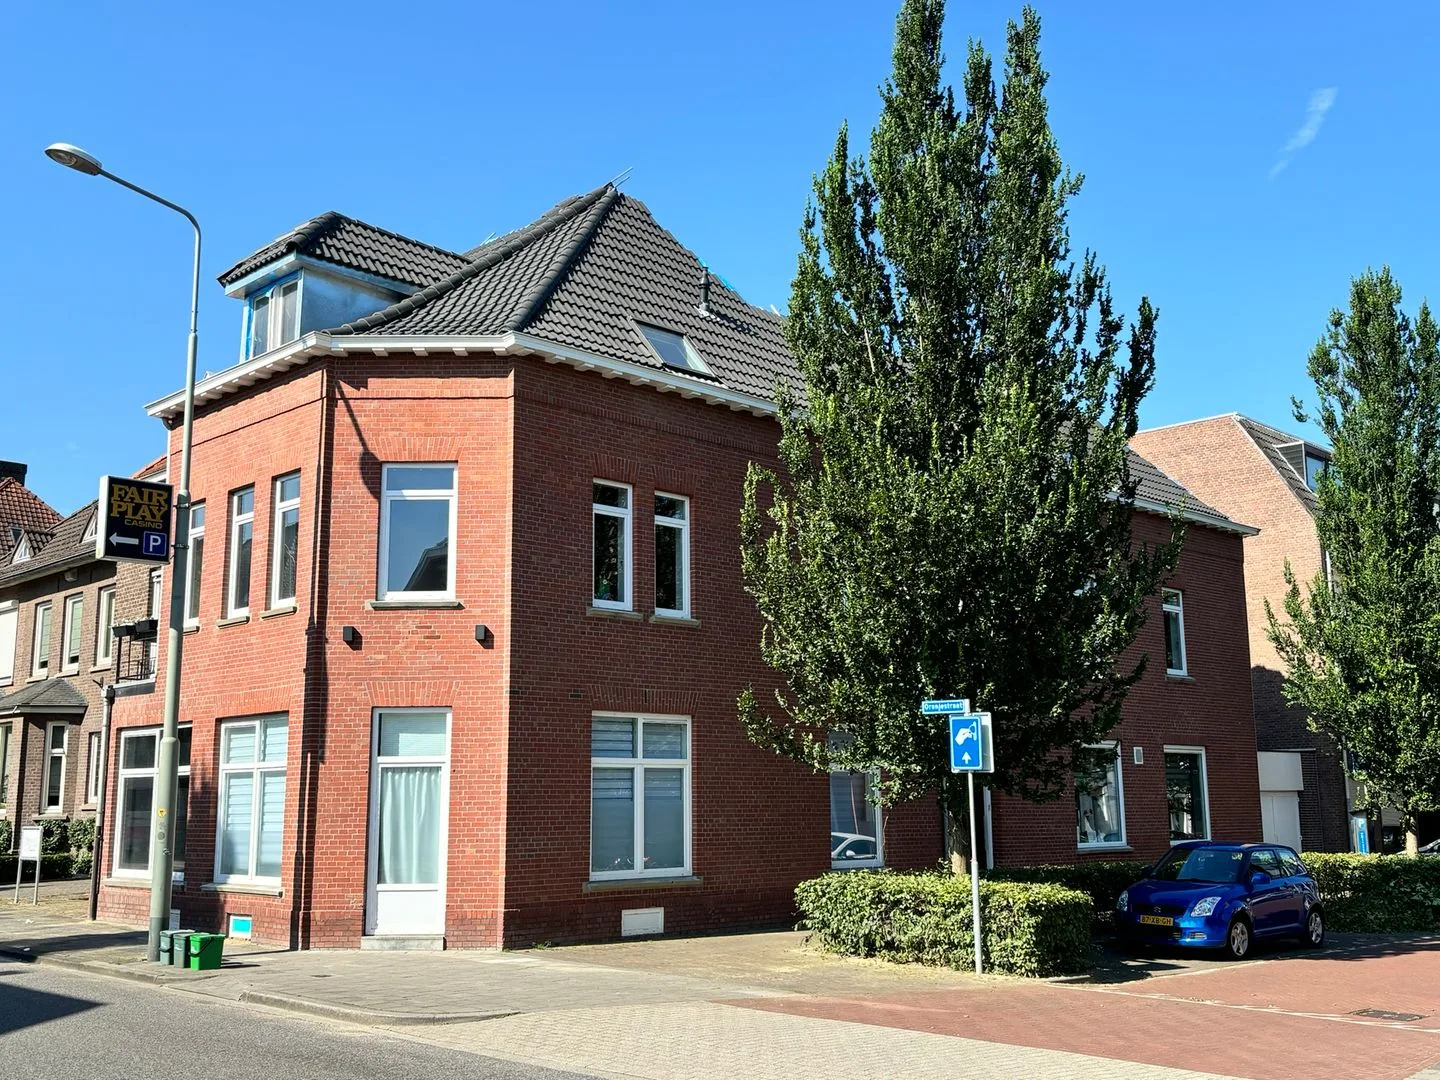
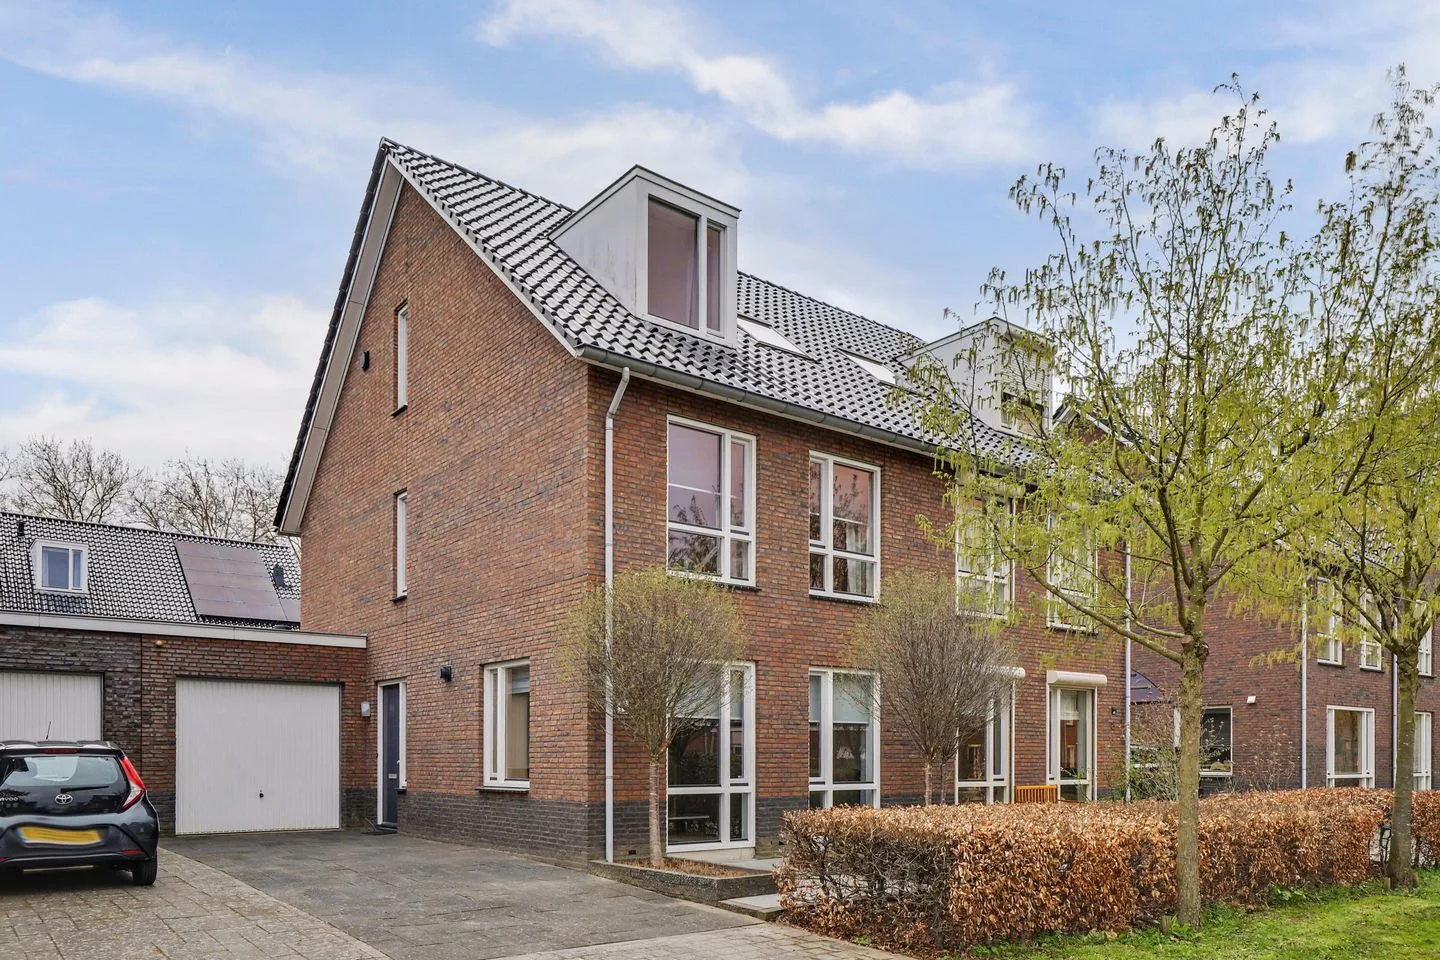
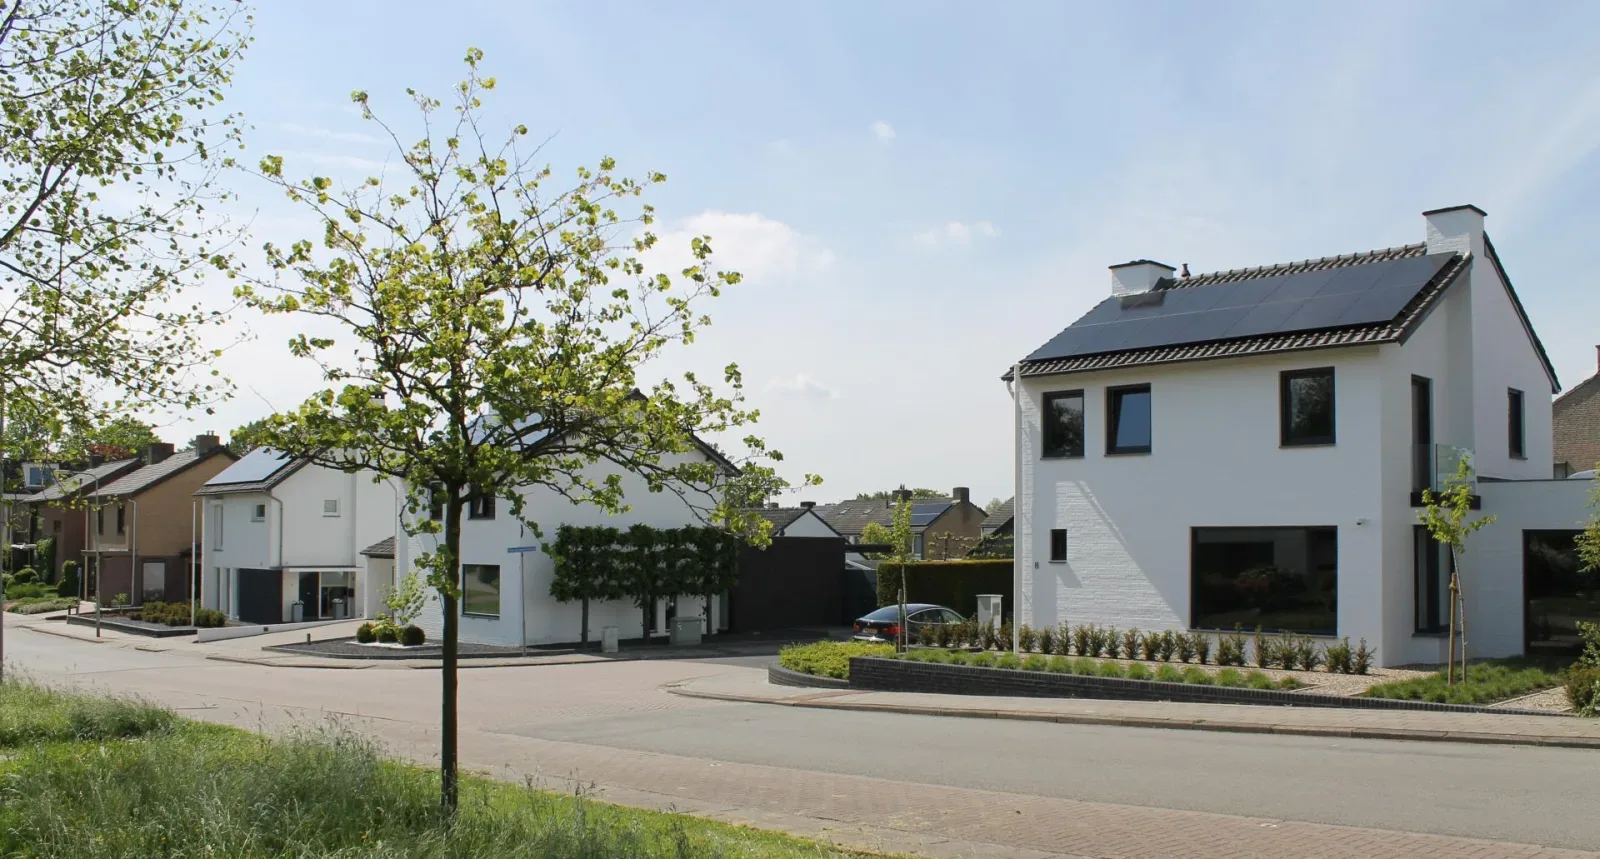
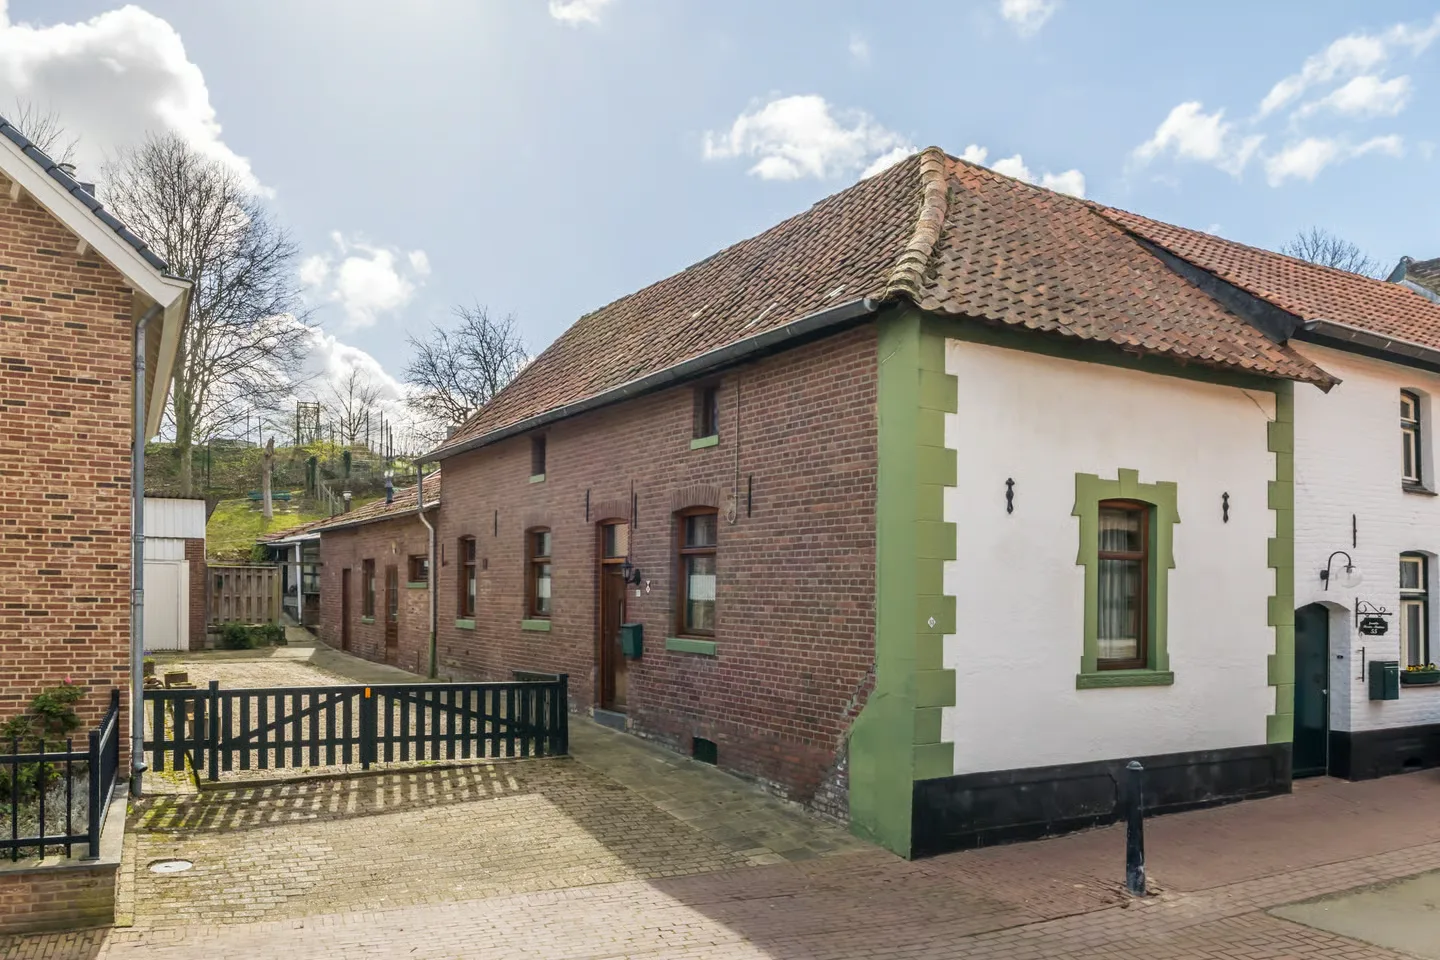
Seffenterstraat 41
6291GB Vaals
€ 299.000 k.k.
€ 2.282/m²
ASave as favorite- Living area
- 131 m²
- Land area
- 111 m²
- Bedrooms
- 3
-
- Available
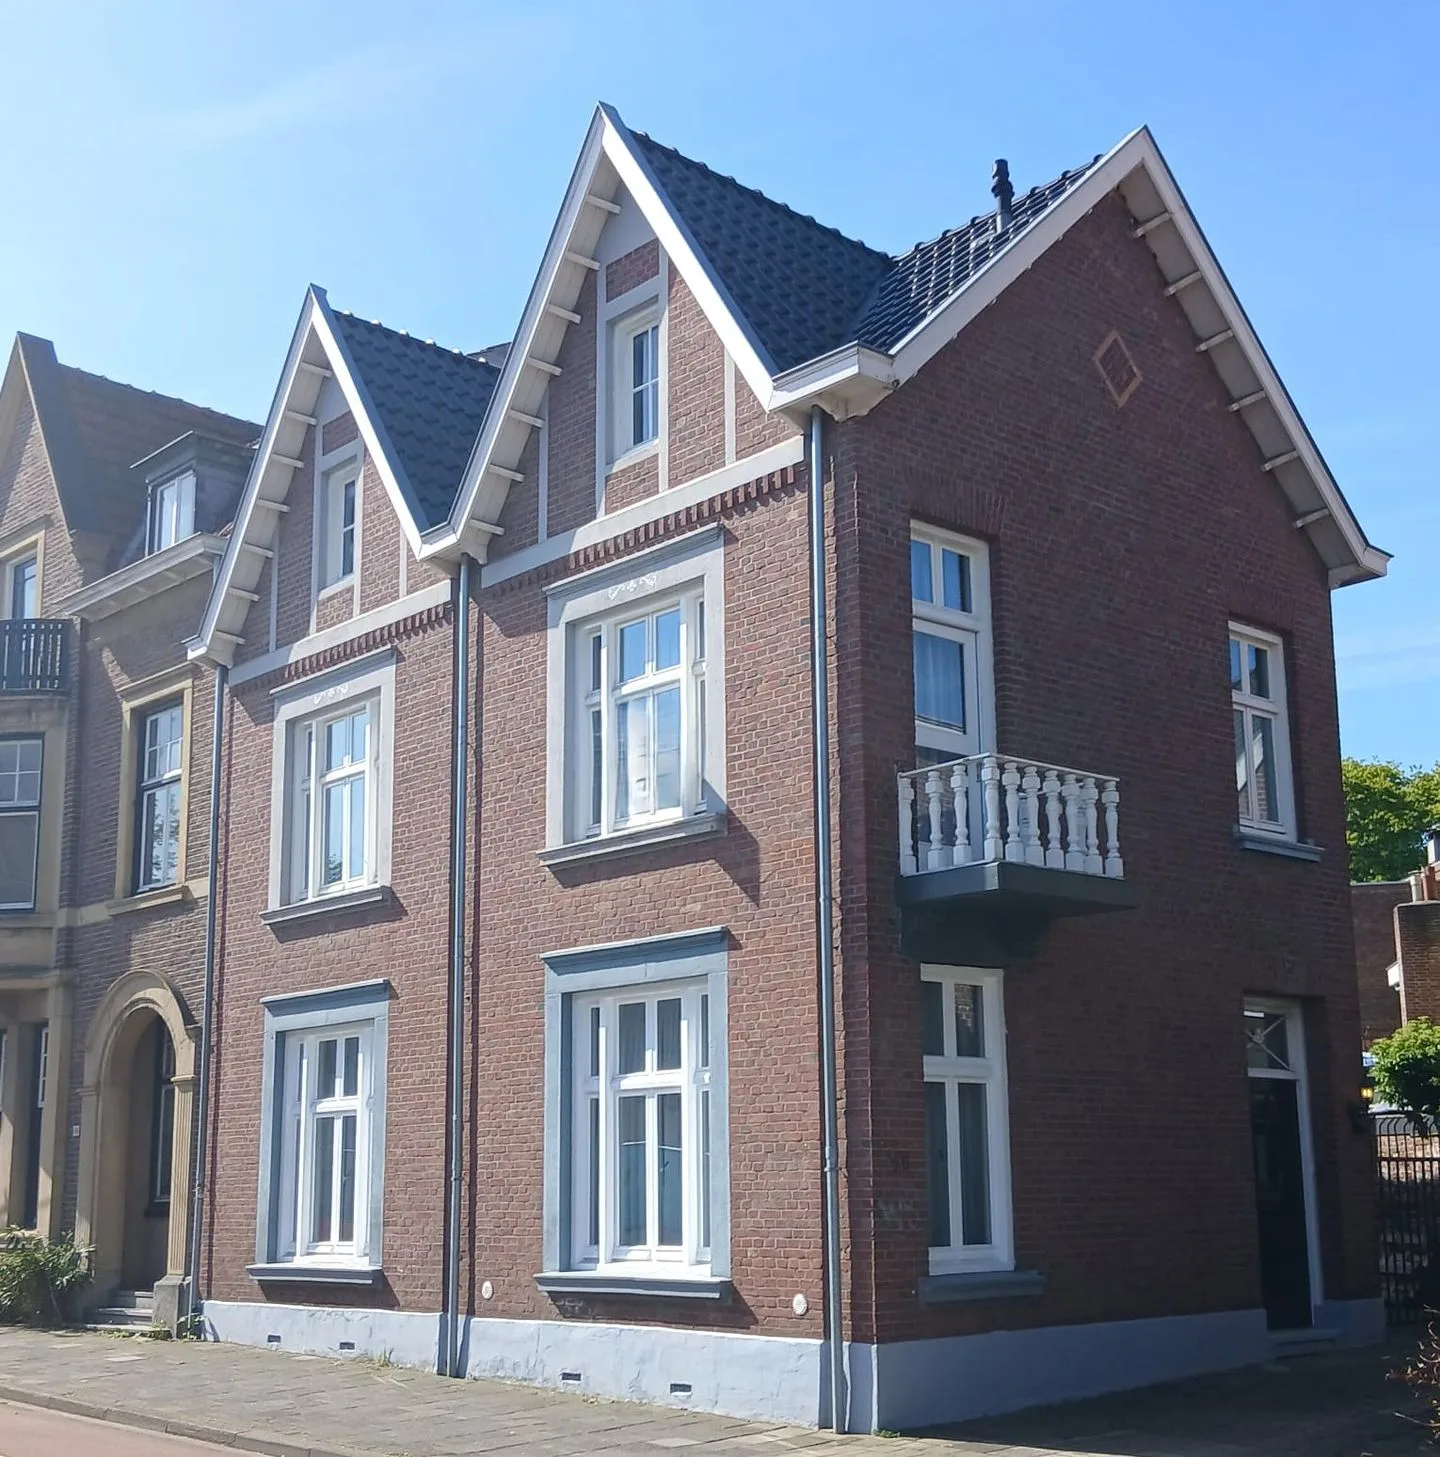
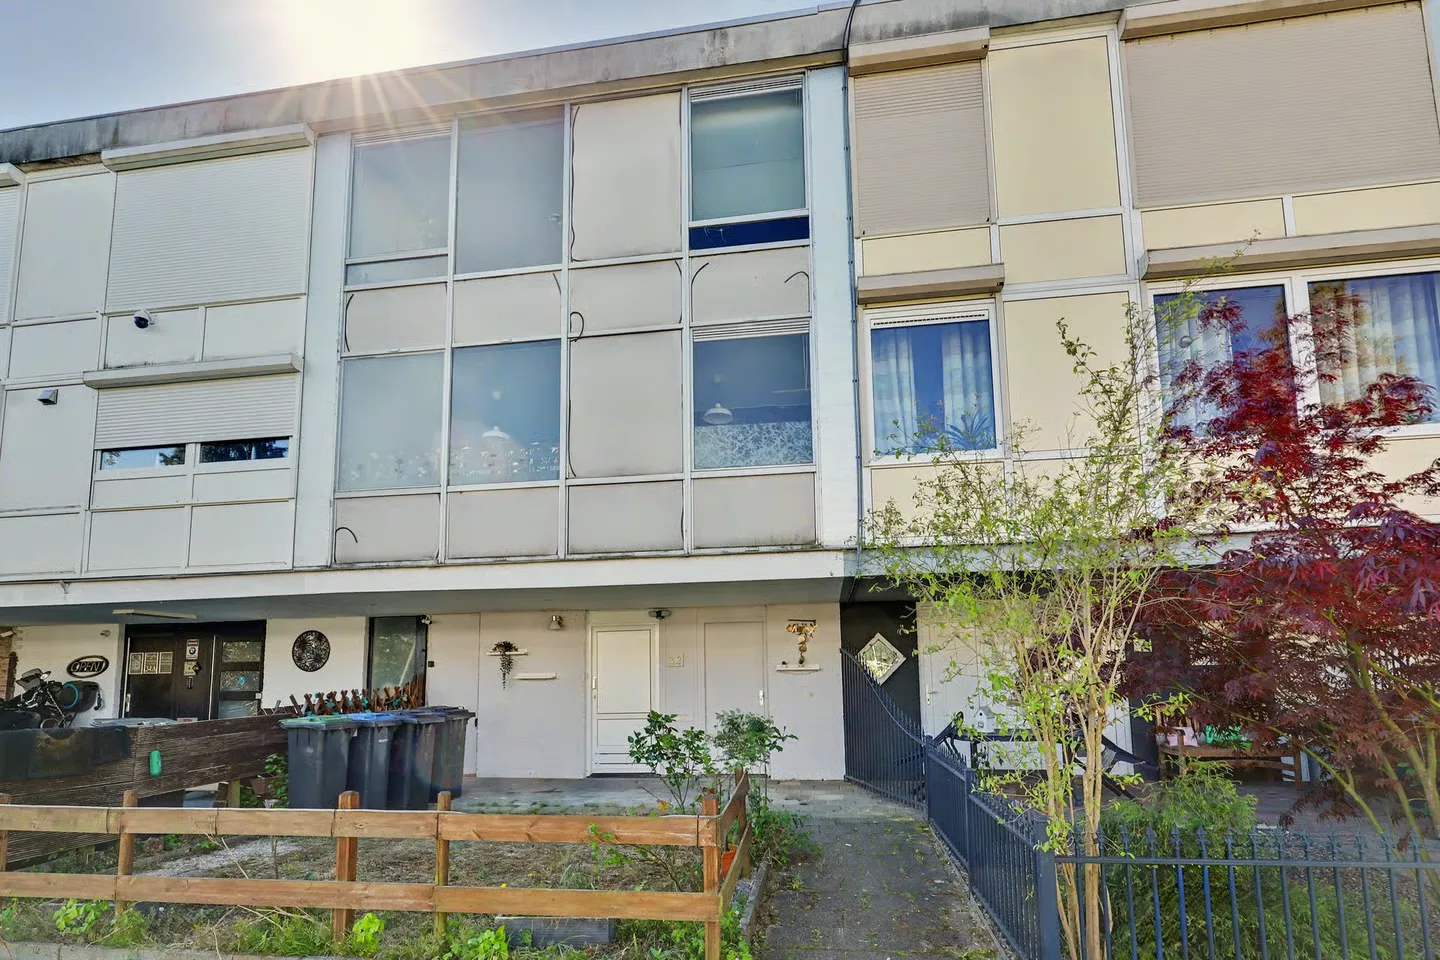
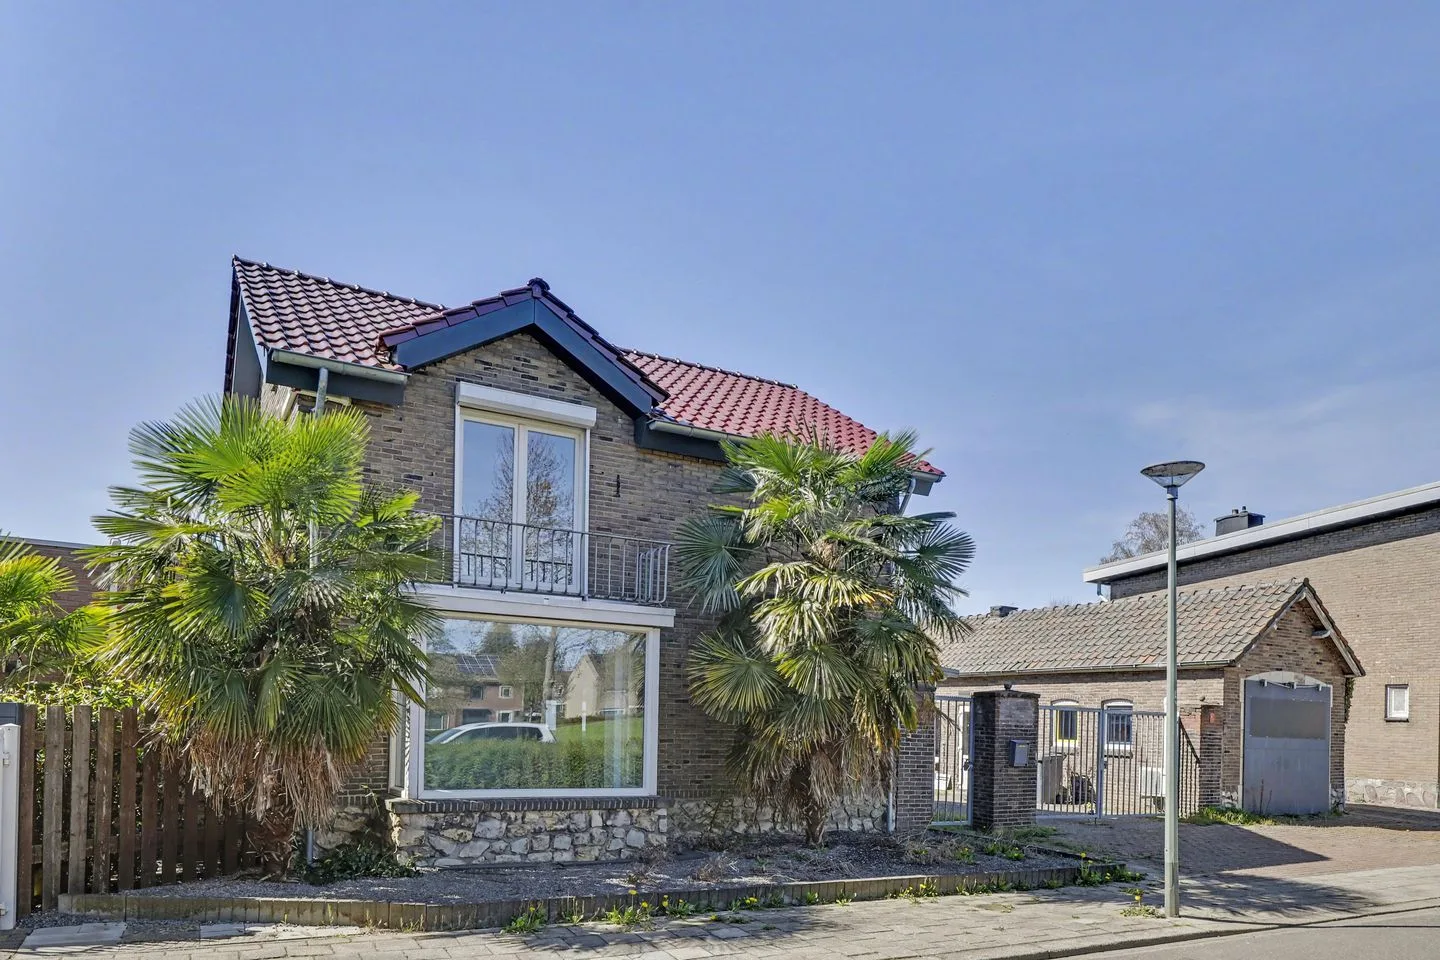
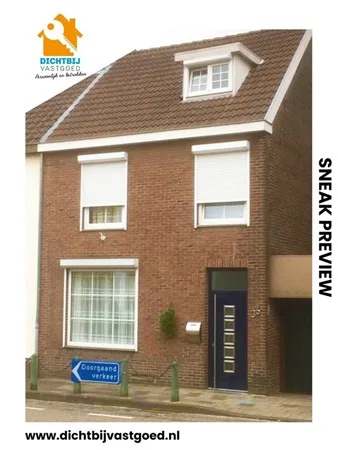
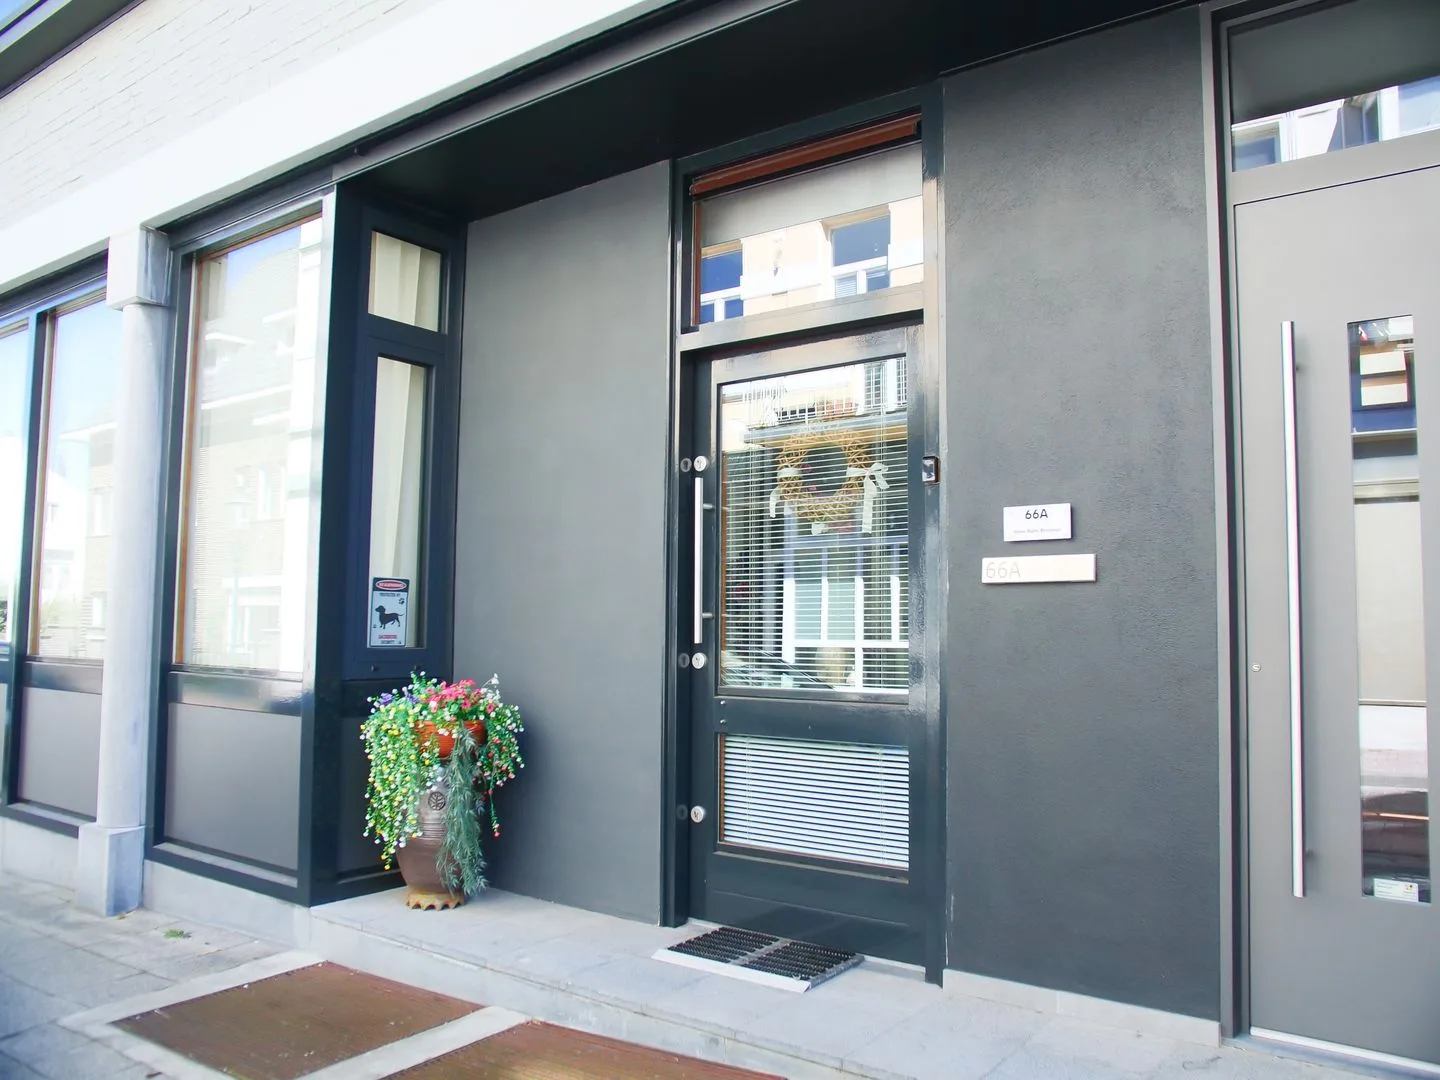
Kerkstraat 66 a
6291AD Vaals
€ 294.990 k.k.
€ 3.278/m²
DSave as favorite- Living area
- 90 m²
- Land area
- —
- Bedrooms
- 1
-
- Sold
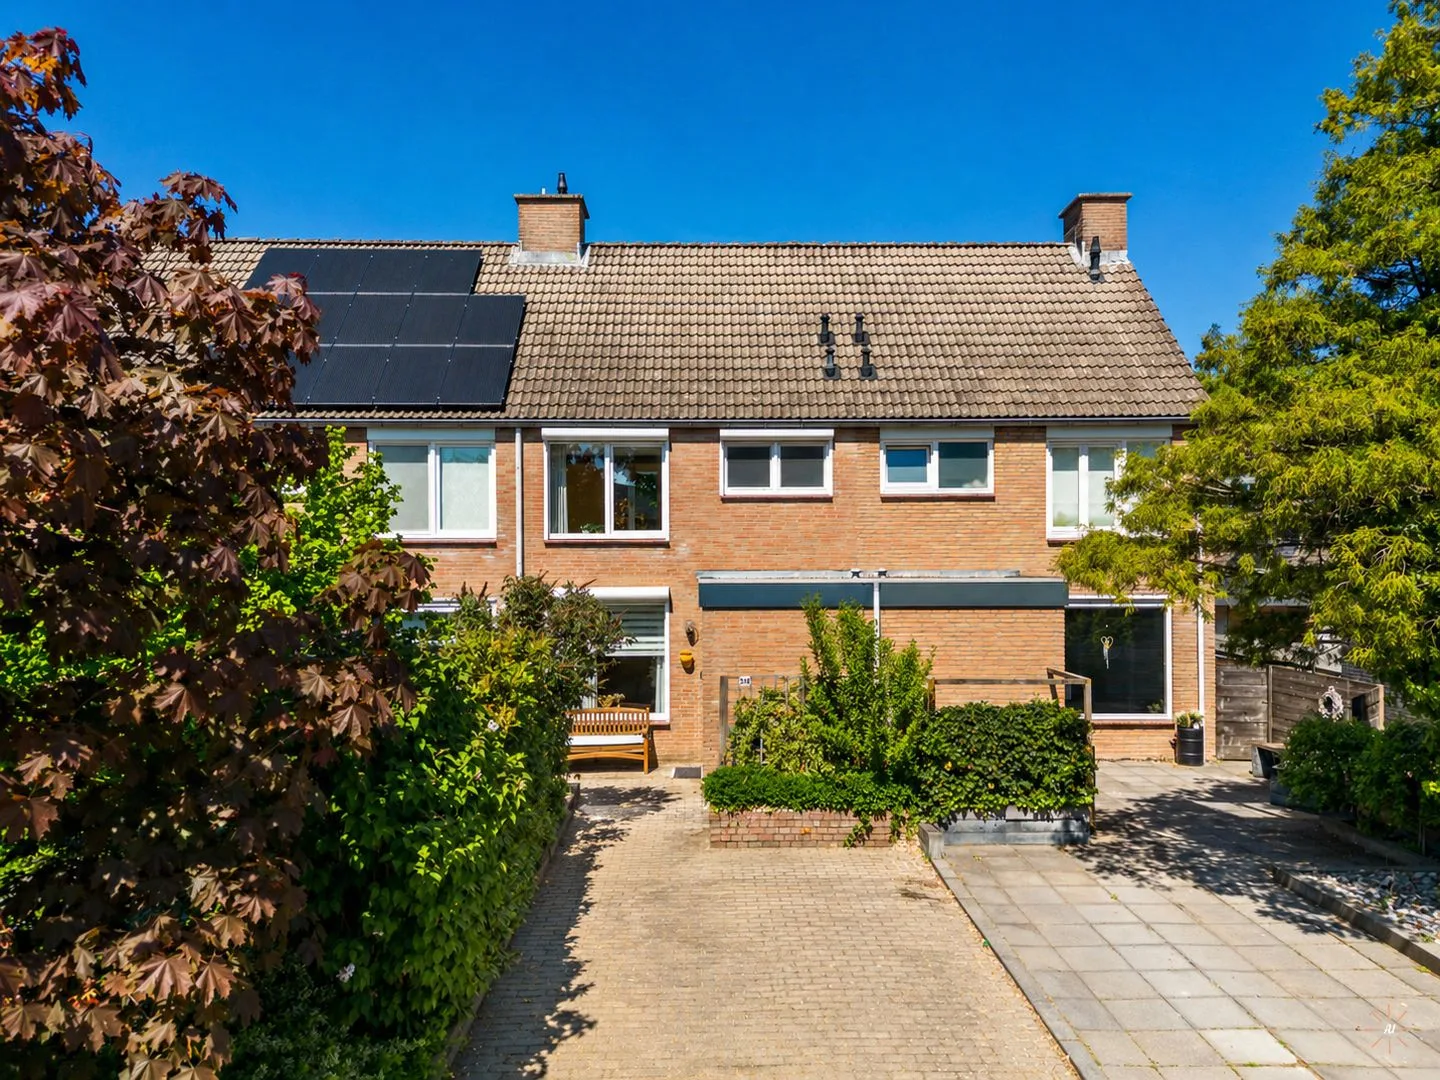
Dijkstraat 38
6367XV Voerendaal
€ 429.000 k.k.
€ 3.635/m²
DSave as favorite- Living area
- 118 m²
- Land area
- 280 m²
- Bedrooms
- 3
-
- Sold
Geleenstraat 71
6411HX Heerlen
€ 205.000 k.k.
€ 3.306/m²
ASave as favorite- Living area
- 62 m²
- Land area
- —
- Bedrooms
- 2
Reviews (348)
Review platforms
BronscoresTotal score
348 total reviews

Funda
56 reviews on Funda

292 reviews on Google
-
Ginger Raaijmakers
10Translated by AITom van Dichtbij Vastgoed has helped us enormously well in our search for our first house as a real estate agent. He was available for us at all times and quickly coordinated with our mortgage advisor, which ensured that the lines were kept short and the process moved along quickly. Tom is honest, makes sure we have not made any wrong choices, and went through it all with us until we had found the perfect house.
-
Bostenstraat 2
9Translated by AIFor the preparation for sale, e.g., taking care of the photo reportage, floor plan and putting it online, Tom has arranged everything very neatly. He also sorted out the energy label for the house perfectly. Very involved in the sale viewings with a real advisory role. All in all, very satisfied with the entire process by Tom from Dichtbij Vastgoed 👍🏻
-
Sanne Janssen
10Translated by AIAs a first-time buyer, purchasing a house is not easy. Tom helped us as a real estate agent. We found the contact very pleasant. Even outside of working hours and during his vacation, Tom was reachable and gave us good and quick advice and helped us.
-
Joeri Rademaker
10Translated by AIduring my search for a home I came across an apartment offered by Dichtbij real estate. during the viewing I immediately had a good feeling about the property and Tom's honesty. afterwards we were able to arrange everything quickly thanks to Tom's direct approach, which made everything run smoothly. a top real estate agent
-
Christa Changeln
10Translated by AII asked Tom to help me with the purchase of a house as a real estate agent. Tom immediately understood what I was looking for. He always took the time to answer my questions, gave excellent advice and was always full of energy and enthusiasm for our project! I have to thank him (almost) entirely for having bought the house I fell in love with! He gave me excellent advice, always protected my interests and ultimately made sure that I could buy the house for a good price. I would hire him without hesitation again and can recommend him 100%! Thanks, Tom!
-
Monique Breukers
10Translated by AITom has helped me incredibly well with the purchase of my house. He is professional, gives good advice, reacts quickly and acts quickly. Because of this, I was able to buy a suitable home in a short time, which I am very happy with.
-
Celine Lousberg
10Translated by AIInitially, we came into contact with Tom for a valuation. However, soon there was a feeling of mutual trust and a click, which led Tom to also take on the role of buyer's agent for us. During this process, he was honest, straightforward and involved, and helped us buy our dream home. The sale of our property also went smoothly, professionally and with a lot of passion. Tom is an honest and sincere person, who always has a good word ready and was standing by for us day and night to answer questions. What struck us most is the passion he radiates for his profession. This gave us a sense of familiarity and ensured that we continuously felt in good hands. Tom, once again thank you for all your dedication. We are very grateful to you!
-
Norbertijnenstraat 12
10Translated by AIInitially, we came into contact with Tom for a valuation. However, soon there was a feeling of mutual trust and a click, which led Tom to also take on the role of purchase agent for us. During this process, he was honest, straightforward and involved, and he helped us buy our dream home. The sale of our house also went smoothly, professionally and with a lot of passion. Tom is an honest and sincere person, who always has a good word ready …
-
Sint Hubertusstraat 24
10Translated by AIVery nice contact had in this process. There is talk of short lines, where the agent is helpful and cooperative! Thought along during the entire process in our interest. In short a pleasant cooperation.
-
Monacoplein 15
10Translated by AIVery pleasant and intense contact around the process. Being able to switch quickly and always being reachable was very valuable for us.
-
Veronic F
10Translated by AIAfter several disappointments in my search for the right house, I found it exciting to buy a house on my own. Close to Vastgoed, and in particular Tom van Houtem, then quickly and professionally took action. With the right strategy and guidance, everything accelerated, resulting in me now having found and bought my house. Everything was quickly and carefully handled, with consideration for my situation. Very satisfied with the approach and empathy. What I especially found very nice: Tom was always ready for me and responded to questions, even after working hours. That involvement gave me a lot of peace of mind and trust and really made the difference. As a result: my own house! ⭐⭐⭐⭐⭐
-
Ceintuurstraat 50
10Translated by AITom van Houtem is very involved and acts quickly, which has led to a nice and quick result.
-
Suzan Babajan
10Translated by AII'm really super helped. I was very worried because I was buying for the first time, but nearby real estate has taken all my worries away. Thanks to them, I was also able to buy my perfect first home! Definitely a recommendation.
-
Gilmaro Tol
10Translated by AIDuring my search for a home, I came across an apartment offered by Dichtbij Vastgoed. During the viewing, it felt right immediately. The real estate agent of the selling party was friendly, clear and took the time to explain everything. As a result, I immediately had the feeling that this could be a place where I would feel at home. The purchase process itself also ran smoothly. Even though he was not my real estate agent, the communication was fast and clear, and I always knew where I stood. Questions were answered properly and they simply thought normally with me. Overall, a super nice experience with Dichtbij Vastgoed during the purchase of my new home. Thank you for the pleasant cooperation!
-
Angelique Basten (Expat Housing Center)
10Translated by AIThis is certainly worth a bottle of bubbles! I recently made a purchase on Kapelaan Ramakersstraat, where I accompanied international buyers. This process did not always go smoothly from the buyers' side and required a certain amount of creativity and flexibility. Tom was available throughout the entire process and showed his willingness to think along and help where necessary. His solution-oriented approach, calmness, and involvement really made the difference. After being active in the industry for many years myself, it's heartwarming to see how a colleague real estate agent is so committed and dedicated to his clients. Tom, you're a top performer!
-
Eynattenstraat 9
8Translated by AITom has very well accompanied us during the sale of our house. Short lines which makes the communication very pleasant. Everything has been started quickly! Can Tom recommend everyone?
-
Sougnezstraat 8
10Translated by AIClose to Real Estate has already sold multiple houses for me. Every time, Tom is very involved and he puts everything on the line to make the sale as smooth as possible. Tom comes up with good ideas and is transparent in his communication. Thanks again!
-
Heerlerbaan 157 A
10Translated by AIJust good, fast and professional. Tom keeps you informed at every step and is quick as a flash. Via app and email, no hassle!
-
Rik Schots
10Translated by AIRecently purchased my new home in Eys with the help of Tom van Houtem (Dichtbij Vastgoed). What a relief! Tom is knowledgeable, responds super fast and has perfectly guided us through the entire process. His local knowledge and professional approach gave us a lot of confidence. An absolute must-recommend for everyone who wants to buy a house in the region!
-
Troereberg 23
8Translated by AIThe contact was good, clear agreements and clear what needed to happen. Pleased with the cooperation.