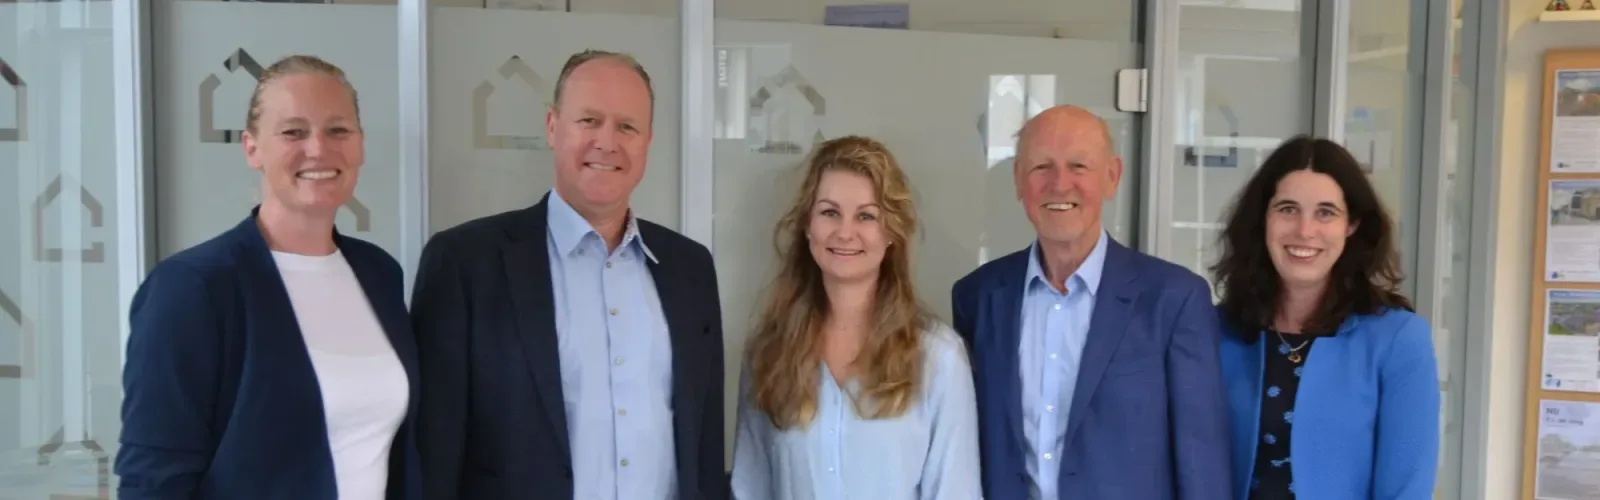

Real estate agency P.J. de Jong offers reliable and personal mediation in the buying and selling of homes and commercial property. With more than 40 years of experience in the Workum region, we are a trusted partner who helps you realize your housing dreams. Our team consists of certified and qualified staff who undergo annual education to support you as best as possible. We emphasize personal contact and adapt to your wishes and needs....
Current housing stock
-

- Available
Eesterich 13
8722HD Molkwerum
€ 327.500 k.k.
€ 4.043/m²
DSave as favorite- Living area
- 81 m²
- Land area
- 889 m²
- Bedrooms
- 3
-

- Available
Onderweg 46
8723AH Koudum
€ 329.000 k.k.
€ 2.912/m²
CSave as favorite- Living area
- 113 m²
- Land area
- 258 m²
- Bedrooms
- 3
-

- Available
Skelpebank 39
8711JK Workum
€ 470.000 k.k.
BSave as favorite- Living area
- 102 m²
- Land area
- 738 m²
- Bedrooms
- 3
-

- Available
Skelpebank 15
8711JK Workum
€ 565.000 k.k.
BSave as favorite- Living area
- 119 m²
- Land area
- 592 m²
- Bedrooms
- 3
-

- Available
De Traan Kokerij 4
8715EH Stavoren
€ 500.000 k.k.
ASave as favorite- Living area
- 106 m²
- Land area
- 257 m²
- Bedrooms
- 3
-

- Available
Fûgelikkers 21
8711DC Workum
€ 598.000 k.k.
€ 4.709/m²
A+Save as favorite- Living area
- 127 m²
- Land area
- 519 m²
- Bedrooms
- 4
Reviews (74)
Review platforms
BronscoresTotal score
74 total reviews

Funda
33 reviews on Funda

41 reviews on Google
-
Ds. Wilhelmus à Brakelstrjitte 17
9Fijn contact, altijd bereikbaar door de korte lijntjes! Een makelaar die de omgeving goed kent en aan te raden is.
-
Jacob Binckesstraat 14
9De makelaar is flexibel, goed bereikbaar geweest, persoonlijk, schriftelijk en telefonisch. Eveneens heeft de makelaar ons goed begeleid tijdens dit verkoopproces met adviezen en hiermee ons als verkopers ontzorgd.
-
Mirjam Lageweg
10Translated by AIWe are very satisfied with Makelaardij PJ de Jong. Andreas came along to the second viewing to give advice, which gave a lot of confidence. The sale of our house proceeded quickly and professionally, with clear communication and short lines. A careful and transparent real estate agent that we recommend 100%.
-
D Benschop-Putman
10Translated by AIThe sale progressed smoothly. The real estate agent and staff were professional and helpful.
-
Bûterikkers 16
9Translated by AIAll went smoothly and efficiently. What we had in mind regarding the selling price matched quite well with what we had in mind. A bit over, so very pleased
-
Raardaburren 2
10Translated by AIThe sale went very smoothly. The real estate agent and staff communicate clearly, they are helpful and friendly, and put themselves in the customer's shoes.
-
Popke de Boer
8Translated by AISmoothly run from start to finish.
-
Grovestinsstraat 29
10Translated by AIVery knowledgeable and extremely professional, on many areas where I myself got stuck or simply couldn't manage, I was quickly guided back onto the right track by the competent staff who are always ready to offer a helping hand.
-
Nieuwstad 4
10Translated by AIDe Jong has helped us fantastic with the sale of our house. No nonsense, just clear, reliable, very professional and always easy to reach. During the sales process there was excellent negotiation with a nice outcome. That made the difference for us. We would go into business with them again.
-
Smidstraat 13
9Translated by AINo discussion about the sale value, appraisal matched our expectations! excellent communication and clarity via the Move account!
-
Learmole 16
10Translated by AIExperience was excellent! Expert help and smooth contact. Actually everything you look for when choosing a real estate agent in the area.
-
Scharnebuursterweg 11
9Translated by AITook on almost all tasks and also carried them out to satisfaction, with a friendly team
-
Prins Willem-Alexanderstraat 43
9Translated by AIFine real estate agent. Friendly, helpful, easy to reach. First bought a house through the agent, then sold it myself.
-
Súd 96
10Translated by AIWe have experienced the communication and service of Andreas and his team as very pleasant, professional and expert. They respond quickly, actively think along about the best presentation of the house, and are fully committed to optimally safeguarding our interests.
-
Eesterich 14
9Translated by AIConsistent clear and regular communication / Good guidance and advice from start to finish.
-
Tademahof 15
9Translated by AIWe experience P.J. de Jong real estate as a very customer-friendly and professional realtor. They do everything to guide both the buying and selling party as well as possible through the entire process of selling and purchasing a home.
-
Marianne Poelstra
10Translated by AIExcellent real estate agent! Good service!
-
Ysgumerweg 1 A
10Translated by AIEverything was neatly arranged and communicated. There was good consultation and quick responses to email and the like.
-
Jack Vaartjes
10Translated by AII can wholeheartedly recommend this real estate agent to everyone. An agent who does everything possible – communication, presentation, expertise and much more – to ensure the sale proceeds as smoothly and quickly as possible.
-
Buren 52
10Translated by AIFrom the beginning to practically the end, handover June 20th, a perfect and constant guidance that certainly accelerated the sale, also partly due to the extensive professional presentation folder.