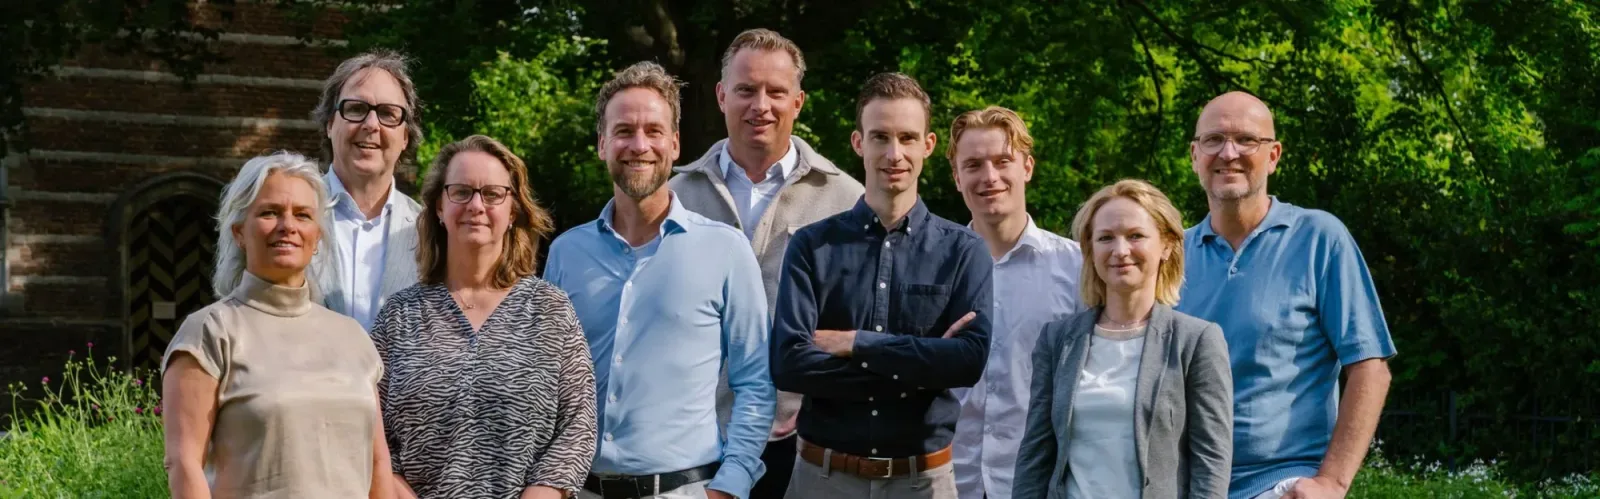
Beumer Nieuwegein

Beumer has been a reliable partner for real estate in the Utrecht region for 45 years. Our agents and staff are well-versed in the characteristics of the neighborhoods and offer personal advice at every step. With a strong focus on customer orientation and quality, we ensure a smooth process from start to finish. Our professionals are certified according to current NVM standards and remain actively involved in this area. Through years o...
Current housing stock
-

- Available
Brielseveste 23
3432RV Nieuwegein
€ 485.000 k.k.
€ 4.330/m²
ASave as favorite- Living area
- 112 m²
- Land area
- 236 m²
- Bedrooms
- 4
-

- Available
Otto van Asperenstraat 1 d
4125TE Hoef en Haag
€ 500.000 k.k.
€ 5.556/m²
ASave as favorite- Living area
- 90 m²
- Land area
- —
- Bedrooms
- 2
-

- Available
Vlierhoeve 58
3438MW Nieuwegein
€ 675.000 k.k.
ASave as favorite- Living area
- 145 m²
- Land area
- 153 m²
- Bedrooms
- 5
-

- Available
Korenbloemstraat 33
3434EA Nieuwegein
€ 450.000 k.k.
CSave as favorite- Living area
- 122 m²
- Land area
- 166 m²
- Bedrooms
- 4
-

- Available
Zwaardenburg 44
3437RP Nieuwegein
€ 450.000 k.k.
BSave as favorite- Living area
- 144 m²
- Land area
- 84 m²
- Bedrooms
- 4
-

- Available
Haanderik 26
3401ES IJsselstein
€ 525.000 k.k.
CSave as favorite- Living area
- 120 m²
- Land area
- 202 m²
- Bedrooms
- 3
Reviews (38)
Review platforms
BronscoresTotal score
38 total reviews

Funda
29 reviews on Funda

9 reviews on Google
-
Jossie Bossie
10Translated by AIFantastic company, helpful and helpful excellent
-
Van Leuffenpad 11
10Translated by AISuper real estate agent. Everything arranged down to the last detail. Very knowledgeable and helpful. Definitely recommend. Friendly people.
-
Vlierhoeve 41
10Translated by AIWe started with neighbors that we first had to help clean up the mess, the real estate agent should have clearly made it clear that the mess would negatively affect the sale. Because we started anyway, the beginning was very, very difficult.
-
Tristanlaan 8
9Translated by AIClear and friendly communication with real estate agents and support. And always answering our many questions.
-
Wielewaal 24
8Translated by AIGreat real estate agent! Clear and straightforward in communication overall. During the sale, there could have been better coordination with agreements.
-
Coltbaan 21 52
10Translated by AIVery friendly! And really trying to get the most out of everything. Everything is arranged and there's always someone available to answer questions! I say let's do it!
-
Pe La
2Translated by AII put my property in the higher segment in Hoef and Haag up for sale through Beumer Nieuwegein, but that turned out to be a big mistake. The house was initially priced too high. I then indicated myself that the price had to be lowered due to various reasons. Several months later, Beumer proposed lowering the asking price by more than one thousand euros (!) due to 'market conditions'. At the beginning, I was assured that there would be many viewings, but this turned out not to be the case at all. A requested viewing could only take place two weeks later because the real estate agent was on vacation. The secretary suggested doing it myself if necessary. For a property in this segment, I find this completely unprofessional. The presentation was also full of errors: for example, a sticker from another real estate agency visible on the photos, sloppiness in the sales text. Messages from interested parties were not or too late passed on. Moreover, every contact had to always come from my side. Despite me indicating multiple times that things needed to improve (and even having a conversation about it), there was no improvement at all. The entire process has been portrayed as better than it actually was right from the start. I therefore terminated the cooperation. For a property in this price segment, you expect expert advice, transparent communication and a professional approach. This is unfortunately not what I experienced with Beumer Nieuwegein. I cannot recommend this office.
-
Hoge Rijndijk 4 15
9Translated by AIHonest, no fancy sales pitches, realistic advice and negotiations. It was a long process because there are almost no senior housing options in our income bracket.
-
Meentwal 5 A
8Translated by AIUltimately, there was 10k oversubscribed on the bid below me. It did give more certainty though, so overall I am happy about it. It was particularly stressful to go from knowing nothing about buying a house to actually doing it. They helped me a lot at times, but sometimes the structure of what needed to be done could have been clearer (I kept hearing little by little 'oh and this also needs to happen'). Overall, I trust it, but I couldn't verify if I paid too much for something…
-
Roodmus 22
10Translated by AIDuring our initial meeting and introductory conversation, Bart immediately gave me a familiar and warm feeling through his appearance, knowledge of the subject matter, enthusiasm, and open and honest communication. Friendly, honest, empathetic, patient, interested, involved, and of course well-grounded and professional are the personal qualities/characteristics that come to mind first when I have to describe Bart. The communication regarding questions back and forth also went smoothly and quickly. Zow…
-
Sjanghaidreef 5
9Translated by AIIt was very pleasant to work together. A realistic and friendly approach, combined with expert advice and clear communication. Always professional and involved, which gives confidence in the entire process.
-
Polderhoeve 5
10Translated by AIBart is a pleasant agent, very accessible. Contact went very well and the agent was present at all important appointments. Keeps appointments and gives good advice. During the viewing days, we were always well informed. We recommend this agent to everyone.
-
Paukenlaan 16
10Translated by AIDuring the first conversation, Bart was immediately very enthusiastic. This gave us a lot of confidence, also in the way he would deal with potential clients during visits. During the viewings, he was able to convey his enthusiasm to the prospective buyers, which greatly contributed to the quick sale of our home. Excellent communication and good guidance from Donja (internal staff), the Beumer real estate team was always ready for us.
-
Eddy Buma
10Translated by AIHouse sold in Nieuwegein by Real Estate Agency Beumer. Very satisfied with the collaboration with realtor Bart. Friendly, honest, reliable and very expert, truly thinking along, always available well and quickly! Thanks again so much Bart and we will recommend you! Greetings from Eddy and Mary
-
Yaslin Jacobs
10Translated by AIBart van Beumer Nieuwegein purchased a property for us as well as sold two properties. The purchase and sale went perfectly, with excellent support where needed. Bart was always easily accessible for questions, and we were kept fully informed of everything necessary. Beumer Nieuwegein is definitely recommended!
-
Zeynep Kaya Güler
10Translated by AIBeumer sold our house. We were very well assisted by Bart. We definitely recommend everyone to Beumer realtor Nieuwegein! Bart arranged everything so well and the communication was excellent. If I could give more stars, I certainly would have done that!
-
Jeroen Versluis
10Translated by AIBart's guidance was great. I am very happy that I was able to buy a house through them. Bart, thanks again!
-
Lavendelhof 44
10Translated by AIOne word! TOP! Beuker offers a personal approach and service when selling your house! I would recommend it to everyone!
-
Serenadelaan 3
9Translated by AIWe had contact with Bart Muller from Beumer Makelaars. He acted quickly and expertly, paying full attention to our interests. And despite the fact that buyers were demanding, he managed to convince them with multiple viewings of the actual value of our house.
-
Wierselaan 30
9Translated by AIGood contact with the real estate agent and the nicest thing was that they provide all services needed such as determining energy label, interior expert, photographer and more. This makes their rate also very good and not high. Would definitely recommend them.