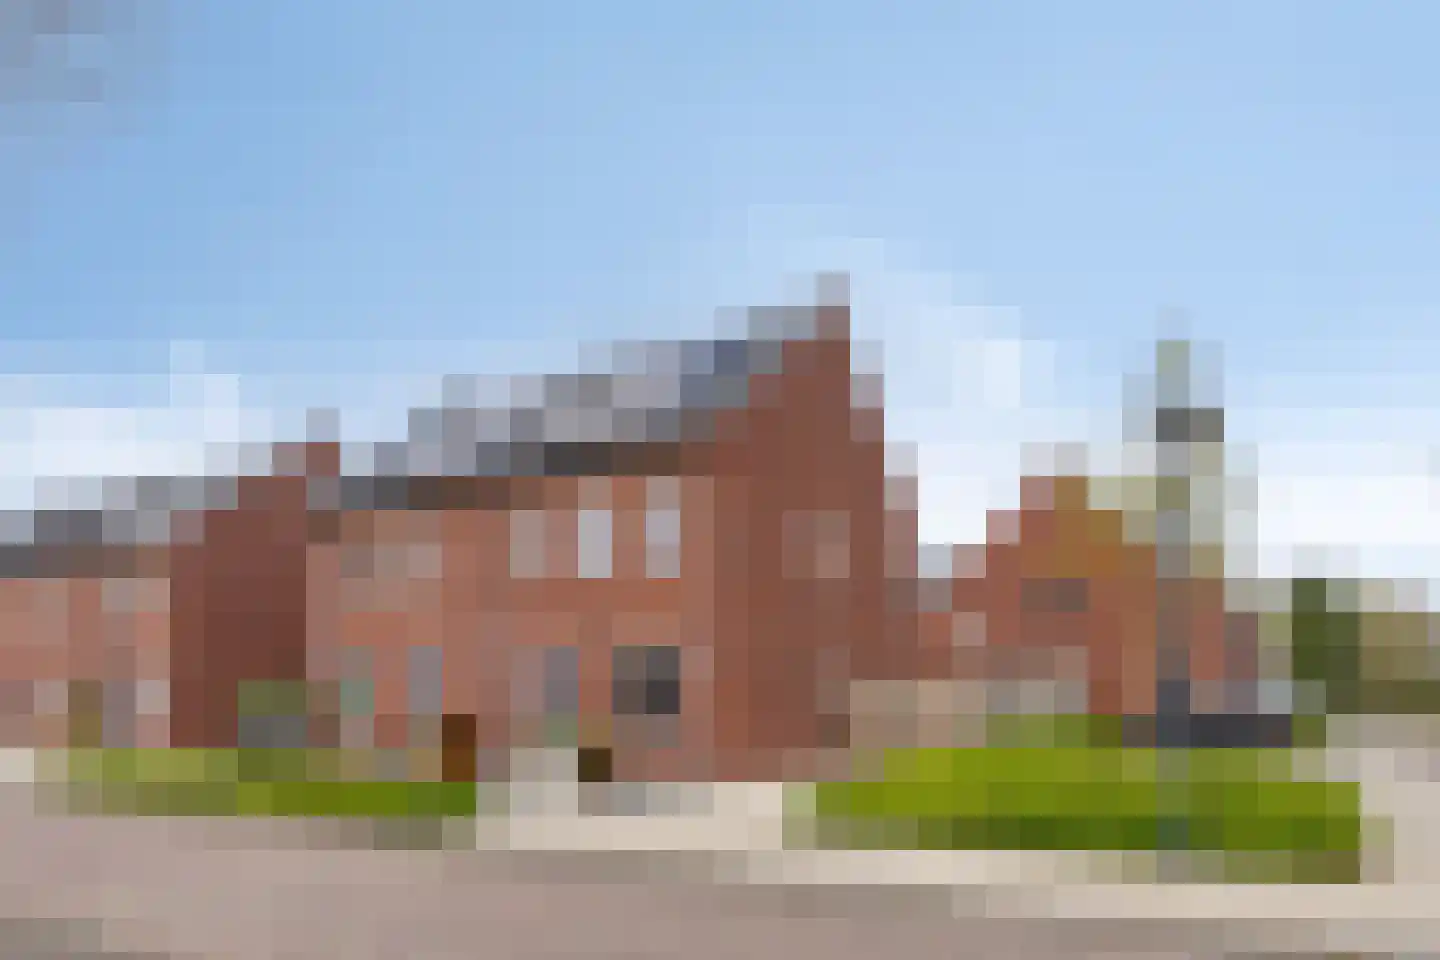
All brokers in Ommel

In Ommel are 36 real estate agents active

Connected to: Vastgoed Nederland NVM Makelaars

Uitgelichte makelaars in Ommel

Een korte selectie uit de lokale vergelijking. Bekijk de volledige lijst hieronder of vergelijk direct offertes.

Compare all brokers in Ommel

36 real estate agents in Ommel average a 8.9 out of 2.053 ratings! Bekijk de top 10 beste makelaars in Ommel

Welke lokale makelaar past bij jou in Ommel?

Gratis makelaarsoffertes vergelijken in Ommel

  • Quotes in Ommel
  • Non-binding
  • Personal
  • Gratis tarieven vergelijken
  • Gratis & vrijblijvend
  • Verkoop & aankoop
  • 36 real estate agents
  • 8,9 uit 2.053 reviews

Ontvang gerichte offertes: makelaars in Ommel maken scherpere voorstellen als ze weten dat ze worden vergeleken. Op basis van een paar korte vragen over jouw situatie ontvang je vrijblijvend offertes van een verkoopmakelaar of aankoopmakelaar. Komt jouw woning op Funda? Dan ontvang je daarbij gratis een speciale woningwebsite.

What does a real estate agent cost in Ommel?

Compare brokers in Ommel

Compare different brokers in Ommel to find the ideal balance between costs and quality. In a high-end housing market like Ommel, the right real estate agent is essential for optimal sales or purchase results. Due to the large competition between brokers in Ommel, attractive rates can be found. Start requesting quotes today and find the ideal real estate agent who fits your specific situation.

Broker fees in Ommel

With an average property value of €530.643 in Ommel, real estate agent fees for sale or purchase are usually between €3.700,- and €12.200,-. The fee structure for a buyer's agent or selling agent varies: some work with a combination of startup costs and commission (1-2% of the sale price), while others charge a fixed rate. By comparing different quotes, you will find the agent who offers the best price-quality ratio for your specific situation.

Business activity in Ommel

The activity in Ommel shows a broad and varied local economy, with room for both established entrepreneurs and new initiatives. With 19 NVM real estate agents in Ommel, the real estate market is professionally organized and active. In combination with the population structure and education levels, this gives a practical picture of the economic dynamics in the area.

Price trends in Asten

Current information about the housing market in Asten and surrounding areas

Average house prices in Ommel

Average house price last month

€530.643,-

In Ommel the housing market is currently very dynamic with prices well above the national average. Relevant for those who want to sell or buy a house. Based on 200 recent transactions with a high number of recent transactions in the region.

These averages are indicative and help with orientation when buying or selling a house.

Apartments

€371.450,-

Average price

Terraced houses

€477.579,-

Average price

Corner houses

€557.175,-

Average price

Bungalow

€795.965,-

Average price

two-under-one-roof

€726.981,-

Average price

Detached

€849.029,-

Average price

Comparison of brokerage fees in Ommel

Rates are based on the average house price of €530.643 in Ommel.

Agent type Startup costs Brokerage Total price
FSBO (self selling)
€0,- 0% €0,-
Internet broker
€1.595,- 0% €1.595,-
Freelance broker
€0,- 1,00% €5.306,-
Vastgoed NL real estate agent
€495,- 1,20% €6.863,-
NVM real estate agent
€695,- 1,35% €7.859,-

An online real estate agent does everything except viewings; you do those yourself.

The above prices are indicative and may vary by broker. Always request multiple quotes for an accurate price comparison.

All amounts are inclusive of 21% VAT.

Market information for sales & purchase brokers in Ommel

Current statistics for when you want to buy or sell a house and information about purchase & sale brokers in Ommel

How is the housing market in Ommel?

How much competition is there in Ommel?

How many brokers are active in Ommel?

In Ommel there are 36 active brokers available to help you as a buyer's agent or seller's agent with buying or selling a house. Finding the right broker can be a challenge, but by comparing brokers in Ommel on expertise, price and reviews, you can make an informed choice. Our platform provides an overview of all brokers in Ommel.

How many brokers are located in Ommel?

There are no brokers located in Ommel. These brokers often have extensive knowledge of the housing market in your region. Whether you want to sell or buy a house, a sales or purchase broker in Ommel can guide you through every step of the process. Easily compare brokers and receive quotes to see which broker best suits your needs.

What is the average rating of brokers in Ommel?

Real estate agents in Ommel average a score of 8.9 out of 2053 reviews. These high scores provide insight into the satisfaction of previous clients. When choosing a real estate agent, however, it is also important to pay attention to their specializations, experience and rates. On our platform you can compare real estate agents in Ommel and make the ideal choice based on your personal preferences.

What is the average asking price in Ommel?

The average asking price in Ommel is €530.643,- based on april data from 200 registered properties. This price is an indication of current trends in the housing market in Ommel. Whether you want to buy or sell a house, a purchasing or selling broker in Ommel can help you make the most of this market and achieve your goals.

How many NVM real estate agents are there in Ommel?

In Ommel there are 19 NVM real estate agents active. These agents offer a guarantee of quality and professionalism because they are bound by strict guidelines. By choosing an NVM agent, you benefit from extensive knowledge and experience in the housing market of Ommel. View and compare NVM agents on our platform to find your ideal match.

How many Real Estate Netherlands agents are there in Ommel?

There are 2 Real Estate Netherlands brokers active in Ommel. Real Estate Netherlands brokers are known for their flexible services and customer-focused approach. They offer expert advice and guide you through the entire process of buying, selling or renting. Discover which Real Estate NL broker in Ommel best suits your needs.

Frequently asked questions about brokers in Ommel

Important information about enabling brokers in Ommel

View Ommel on the map

View the location and discover the brokers in this region

Residential and neighborhood statistics in Ommel

View current location data on residents, WOZ development, housing stock, energy consumption, business activity and safety in Ommel. In 2025 were there 1.005 residents. The average WOZ value in 2025 is EUR 505.650.

Residents

1.005

Last year: 2025

Average WOZ

EUR 505.650

Last year: 2025

Average income per person.

EUR 31.105

Source: AllNumbers

Crimes (current year)

44

Total registered

Demographics and WOZ development

Inhabitants per year

Inhabitants per year in Ommel
Year Residents
2021 1.085
2022 1.050
2023 1.045
2024 1.035
2025 1.005

Annual WOZ value

WOZ value per year in Ommel
Year Average WOZ
2021 EUR 391.933
2022 EUR 430.359
2023 EUR 477.607
2024 EUR 480.063
2025 EUR 505.650

Composition of residents

Age build-up

65+: 200 0-15: 140 15-25: 125 25-45: 240 45-65: 290

Education level

Hoger

220

Praktisch

150

Middelbaar

380

Origin of residents (2025)

Europa

95

Nederland

885

Buiten Europa

20

Housing stock and construction periods

Types of homes

Hoekwoningen 39
Appartementen 12
Tussenwoningen 34
Vrijstaande woningen 185
Twee-onder-één-kap woningen 92

Construction period of buildings

Voor 1700 0
1700 tot 1900 19
1900 tot 1925 19
1925 tot 1950 31
1950 tot 1970 81
1970 tot 1980 49
1980 tot 1990 59
1990 tot 2000 29
2000 tot 2010 26
2010 tot 2020 36
2020 en later 35

Energy and sustainability

Energy label distribution

Label C

82

Label A

61

Label B

58

Label F

43

Label G

36

Label D

28

Label A+++

19

Label E

7

Label A++++

5

Label A+

3

Label A++

0

Label A+++++

0

Average energy consumption per year

Average energy consumption per year in Ommel
Year Gas (m3) Electricity (kWh)
2020 1.723 4.205
2021 1.940 4.313
2022 1.526 3.998
2023 1.266 3.897
2024 1.146 3.937

Consumption per house type

Hoekwoning

Gas: 985 • Electricity: 3.141

Huurwoning

Gas: 1.428 • Electricity: 2.994

Koopwoning

Gas: 1.201 • Electricity: 3.969

Appartement

Gas: 1.526 • Electricity: 3.575

Tussenwoning

Gas: 768 • Electricity: 2.846

Vrijstaande woning

Gas: 1.375 • Electricity: 4.429

Twee-onder-één-kap woning

Gas: 1.260 • Electricity: 3.328

Business activity in Ommel (2025)

Handel en HORECA 20
Nijverheid en energie 35
Zakelijke dienstverlening 20
Overheid, onderwijs en zorg 15
Landbouw, bosbouw en visserij 25
Vervoer, informatie en communicatie 5
Financiele diensten en onroerendgoed 10
Cultuur, recreatie en overige diensten 15

Total number of company establishments: 150

Recent crime statistics

Recent crime statistics in Ommel
Period Crimes
jan 2025 1
jan 2026 3
jul 2025 3
jun 2025 6
mei 2025 2
mrt 2025 5
nov 2024 3
nov 2025 5
okt 2024 5
okt 2025 3
sep 2024 6
sep 2025 3

These figures give an indicative picture of safety trends in the living environment of Ommel.

Frequently asked questions about living in Ommel

Short answers based on current local statistics, handy for a quick comparison of the living environment.

Hoeveel inwoners heeft Ommel?

Ommel telt in 2025 ongeveer 1.005 inwoners.

Wat is de gemiddelde WOZ-waarde in Ommel?

De gemiddelde WOZ-waarde in Ommel is in 2025 circa € 505.650.

Wat is het gemiddelde inkomen per inwoner in Ommel?

Het gemiddelde inkomen per inwoner in Ommel ligt rond € 31.105 per jaar.

Hoe veilig is wonen in Ommel?

Voor het huidige jaar gaat het om ongeveer 44 geregistreerde misdrijven. Gebruik deze cijfers als indicatie en vergelijk trends per periode.

Welke woningtypen komen het meest voor in Ommel?

In Ommel komt vooral "Vrijstaande woningen" veel voor, met ongeveer 185 woningen.

Current knowledge articles

Discover everything about real estate agents and the housing market

Gratis vrijblijvende offertes ontvangen

Vergelijk meerdere makelaars en kies de beste match.