
Van den Hurk Makelaars staat voor betrouwbare en doortastende makelaarsdienst in Beek en Donk, met uitstraling naar de omgeving. Wij kennen de lokale huizenmarkt als geen ander en brengen vraag en aanbod snel bij elkaar, met aandacht voor de wensen van klanten. Onze dienstverlening omvat verkoop, aankoop en taxaties. Wij werken met een klantgerichte benadering, gesteund door expertise en gevalideerde certificaten zoals NWWI, NRVT, SCVM...
Current housing stock
-
- Available
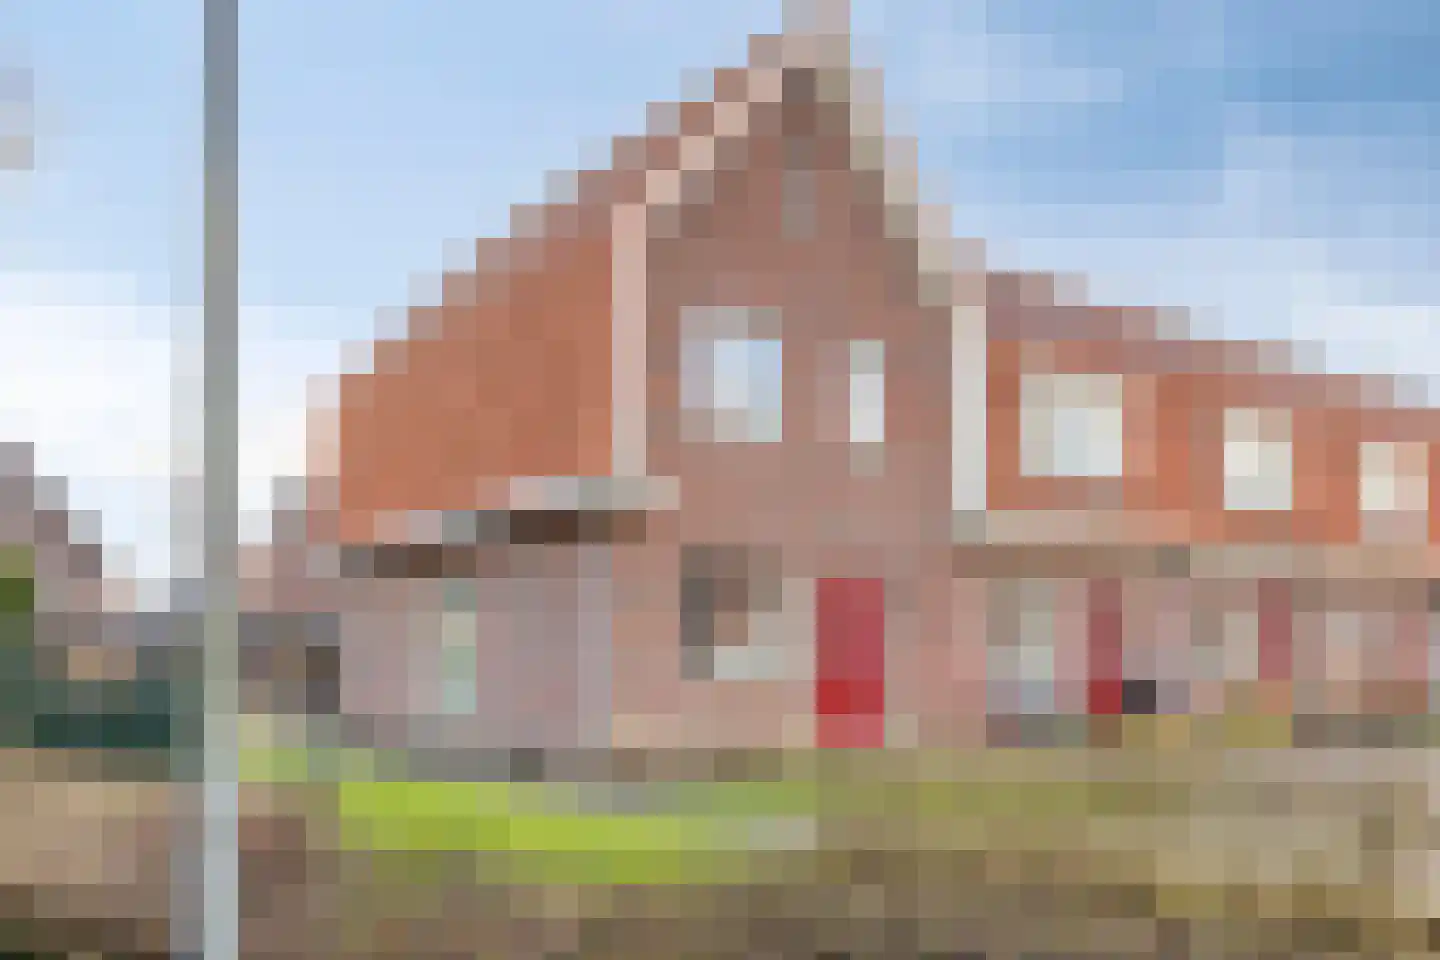
Vincent van Goghlaan 4
5741EV Beek en Donk
€ 425.000 k.k.
€ 3.829/m²
DSave as favorite- Living area
- 111 m²
- Land area
- 308 m²
- Bedrooms
- 3
-
- Available
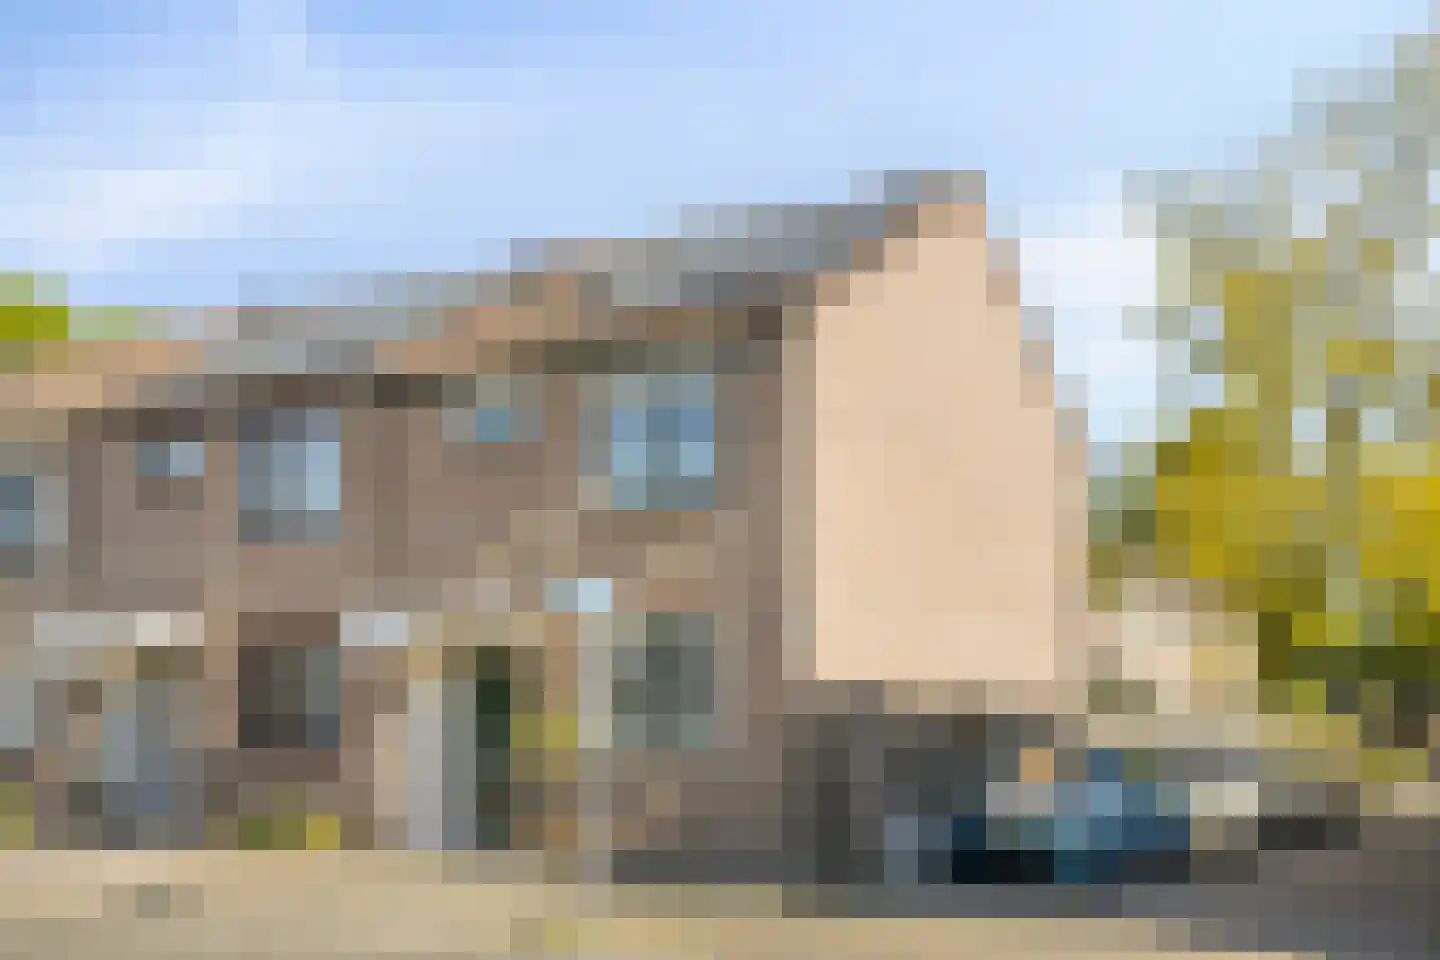
Ouverturelaan 33
5741WL Beek en Donk
€ 485.000 k.k.
ASave as favorite- Living area
- 130 m²
- Land area
- 144 m²
- Bedrooms
- 4
-

- Available
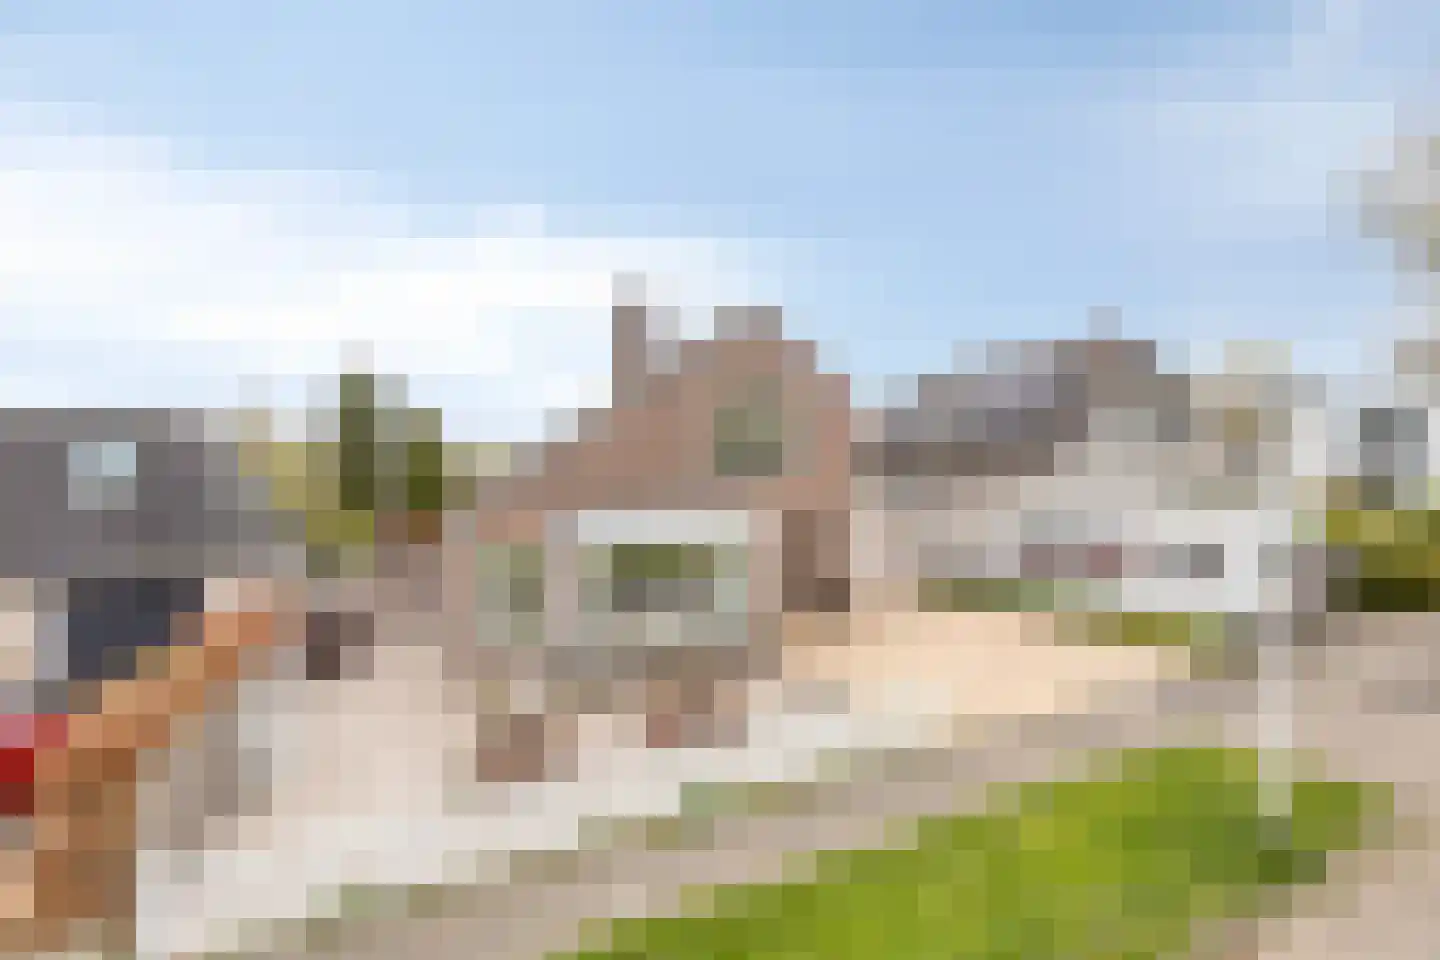
Zaagmolenweg 52
5741LV Beek en Donk
€ 325.000 k.k.
€ 2.902/m²
CSave as favorite- Living area
- 112 m²
- Land area
- 145 m²
- Bedrooms
- 3
-

- Available
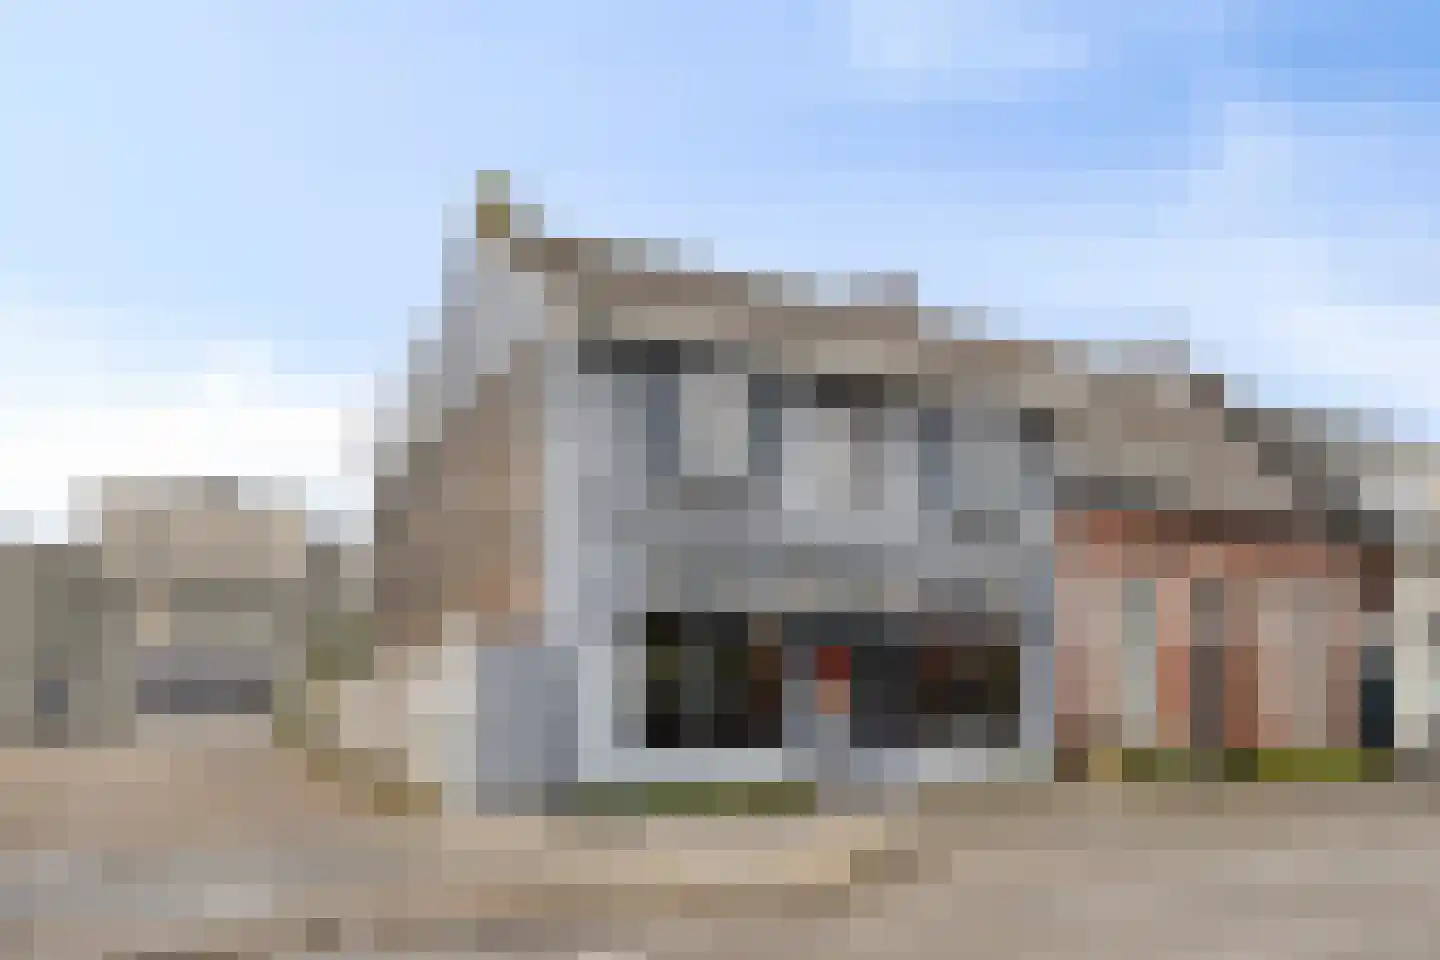
Dorpsstraat 110
5737GE Lieshout
€ 895.000 k.k.
€ 4.144/m²
CSave as favorite- Living area
- 216 m²
- Land area
- 1692 m²
- Bedrooms
- 5
-

- Available
Nieuwstraat 30
5741JV Beek en Donk
€ 359.000 k.k.
€ 3.945/m²
FSave as favorite- Living area
- 91 m²
- Land area
- 330 m²
- Bedrooms
- 3
-
- Available
Koppelstraat 7
5741GA Beek en Donk
€ 745.000 k.k.
€ 3.821/m²
CSave as favorite- Living area
- 195 m²
- Land area
- 1048 m²
- Bedrooms
- 4
Reviews (49)
Review platforms
BronscoresTotal score
49 total reviews

Funda
37 reviews on Funda

12 reviews on Google
-
Symfoniestraat 3
10Translated by AIcontact was friendly and clear !!! The telephone appointments were always followed up, interim situations were reported in a timely and clear manner and there was always good consultation.
-
Zaagmolenweg 10
10Het contact met onze makelaar is gedurende de hele verkoop periode optimaal geweest. Ze kennen de markt hier in Beek en Donk en geven op basis daarvan goede adviezen die wij van harte opgevolgd hebben. We hebben over het hele traject geen enkele op of aanmerking. Met name de vriendelijkheid en bereikbaarheid springen in het oog. Ze communiceren heel erg goed. Al met al zijn wij supertevreden. Mieke en Henry Lempers
-
Otterweg 6
9Het contact was heel fijn, duidelijk en een goede communicatie. Fijn in omgang. We zijn van het begin tot einde goed geholpen. Ook zijn ze goed bereik aar telefonisch of via de mail.
-
Smalleweg 12
10Translated by AIEverything has gone very well and a lovely cooperation and I can recommend this real estate agent to everyone. Pleasant communication!
-
Havenweg 9
10Translated by AIIlse is a nice real estate agent. Well-informed about the current market. Short lines for discussions. Kept us well informed. The house was sold quickly.
-
Kapelstraat 101
9Translated by AIHouse sold quickly, with the assistance of vd Hurk. Good service, pleasant contact, clear in the explanation.
-
Muzenlaan 84
10Translated by AIFrom the first contact until the end, I was expertly helped by the real estate agent. My questions were always quickly answered. From the offers it became clear that their local knowledge was very evident: a good estimation of the price and the profile of the bidders. Because of their proactive attitude, I didn't have to worry about anything.
-
De Wieken 16
10Translated by AIThe contact with the real estate agent was super good from the beginning of the valuation of our house until the sale of the house. We were well kept informed about the viewings and afterwards also had good contact when accepting the offer. It was a nice and friendly contact. We could address all our questions and this felt very nice.
-
Dhr. Han Ten Have
10Translated by AIYou can quickly be guided by "the price" I prefer expertise and experience . This has led to a quick uncomplicated sale Nothing but praise for this real estate agent
-
Servaasstraat 29
10Translated by AIVan den Hurk real estate agents were transparent and clear from the beginning about the plan of approach and what we could expect. They have knowledge of the local market but it was also striking that they had a lot of technical expertise during the initial intake. They don't promise mountains of gold but are realistic. Throughout the entire process, communication was very good and clear.
-
Zwanendreef 30
10Translated by AIThe contacts with the real estate agent went very quickly and smoothly. It's really nice when lines are short and you get quick answers to your questions. Only compliments for them!
-
Lijsterlaan 23
10Translated by AIContact with the broker is good, they respond quickly and take the time for you. They know what they do and what they must do.
-
Hool 36
10Translated by AIBecause everything went according to plan in a very short time, that says enough, we are very satisfied. Very reliable. And good advice. Fam. Brouwers.
-
Zaagmolenweg 23
10Translated by AIA fine real estate agent with a lot of knowledge of both the housing market and the neighborhood! In addition, a quick and understandable explanation to all our questions!
-
Thom Dreverman
10Translated by AIWe initially came to Van den Hurk Makelaars for the sale of my aunt's house. Very friendly welcome from Ilse, who really thought along with us and was very helpful. Ultimately, she also helped with the purchase of her new home. All in all a pleasant experience, if I ever need a real estate agent again in the future, I will definitely come back here!
-
Lijsterstraat 28
9Translated by AIDrieke and Ilse guided us wonderfully through the sale of the house. We were kept informed every day during the viewings. After only the first conversation, we felt hopeful about the guidance we would receive. For this, they will receive a TEN.
-
Veerstraat 25
10Translated by AINice personal contact. This realtor keeps his appointments and works very meticulously. I am happy that this realtor supported me during the sale of my house.
-
Kempenhof 50
10Translated by AIVd Hurk Makelaars is a very nice real estate agency. They are friendly, expert, patient and regular. Next time we will choose Vd Hurk Makelaars again.
-
Bemmerstraat 0 ong
9Translated by AIThe contact went flawlessly! Even during our vacation in Vietnam, every effort was made to contact us ( time difference) at a suitable time for us! Hats off!
-
Leeuweriklaan 22
9Translated by AIWe have worked incredibly well with Drieke. She always responded very quickly and thought along well with us. She takes the time for you and always has good contact. Professional, transparent, speed and a personal touch are the words I want to give her for a very pleasant collaboration!