
At Van Sonsbeeck real estate agents we do it just a little differently. Instead of simply putting a house online and waiting, we actively search for the right match between buyer and seller. We take every opportunity to create the perfect match, with lots of energy and enthusiasm. Moreover, under one roof there is a recognized mortgage and insurance advisor, so that everything can be arranged in one place. This way you avoid hassle and...
Current housing stock
-

- Available
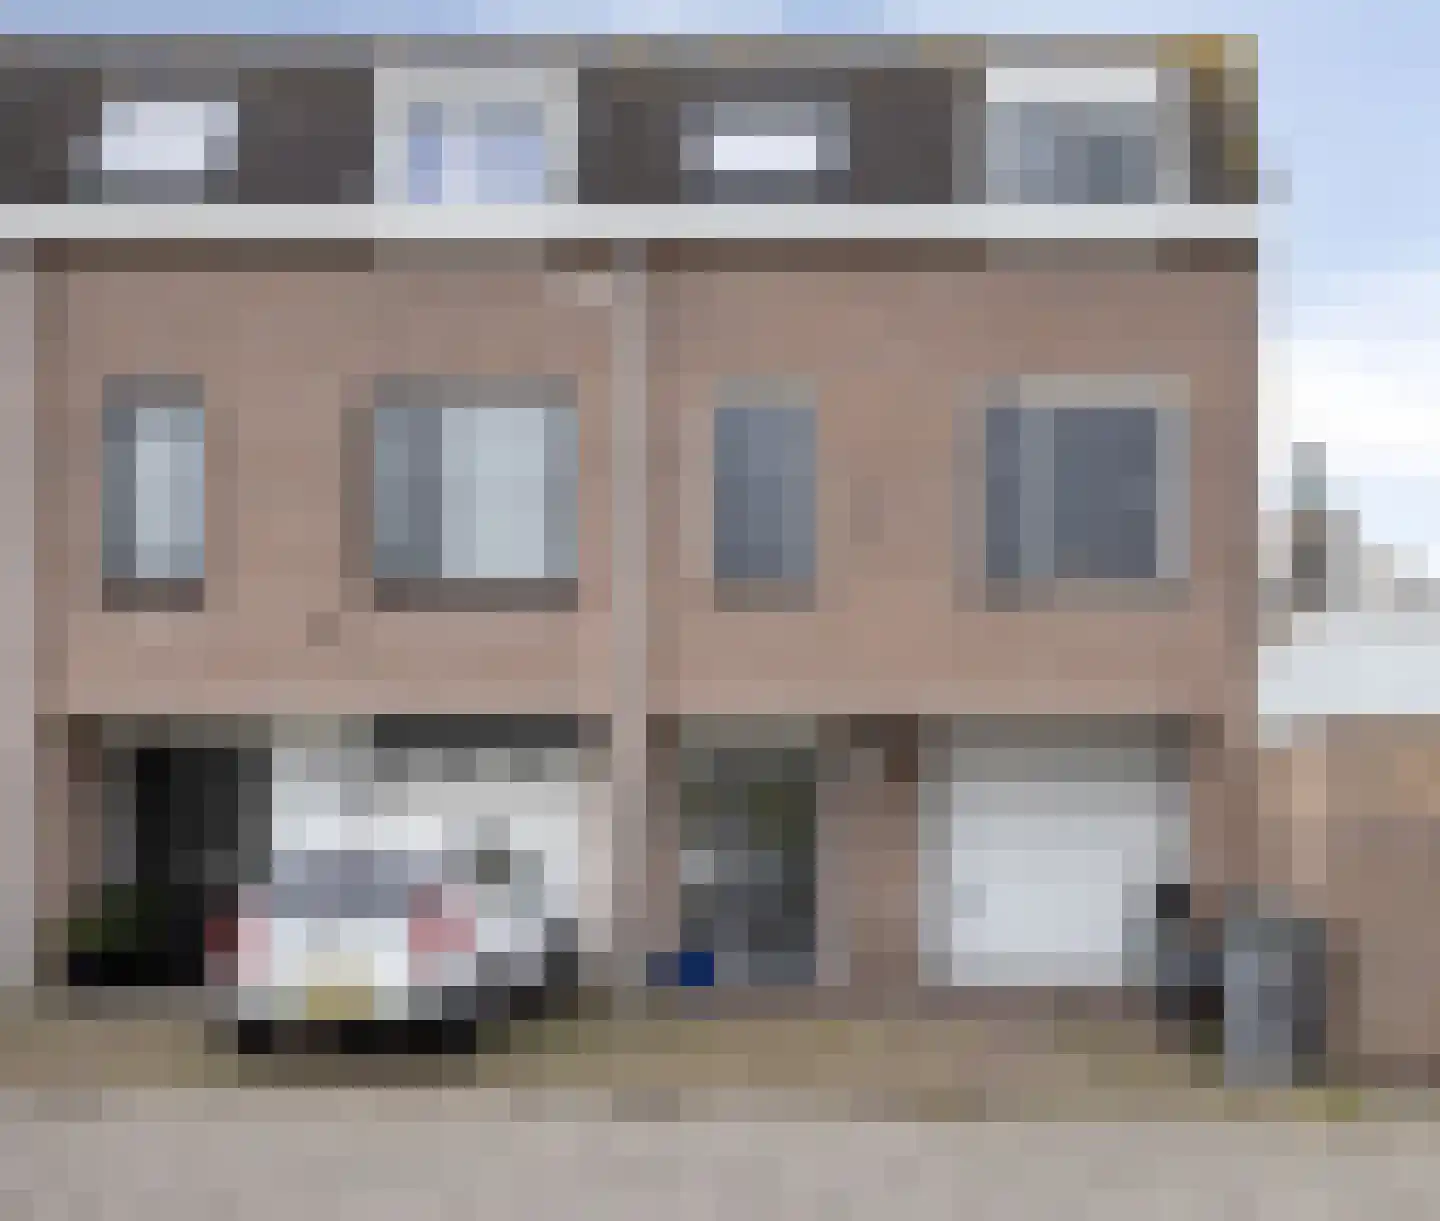
Bella Vista 21
6824HG Arnhem
€ 495.000 k.k.
ASave as favorite- Living area
- 107 m²
- Land area
- 108 m²
- Bedrooms
- 4
-

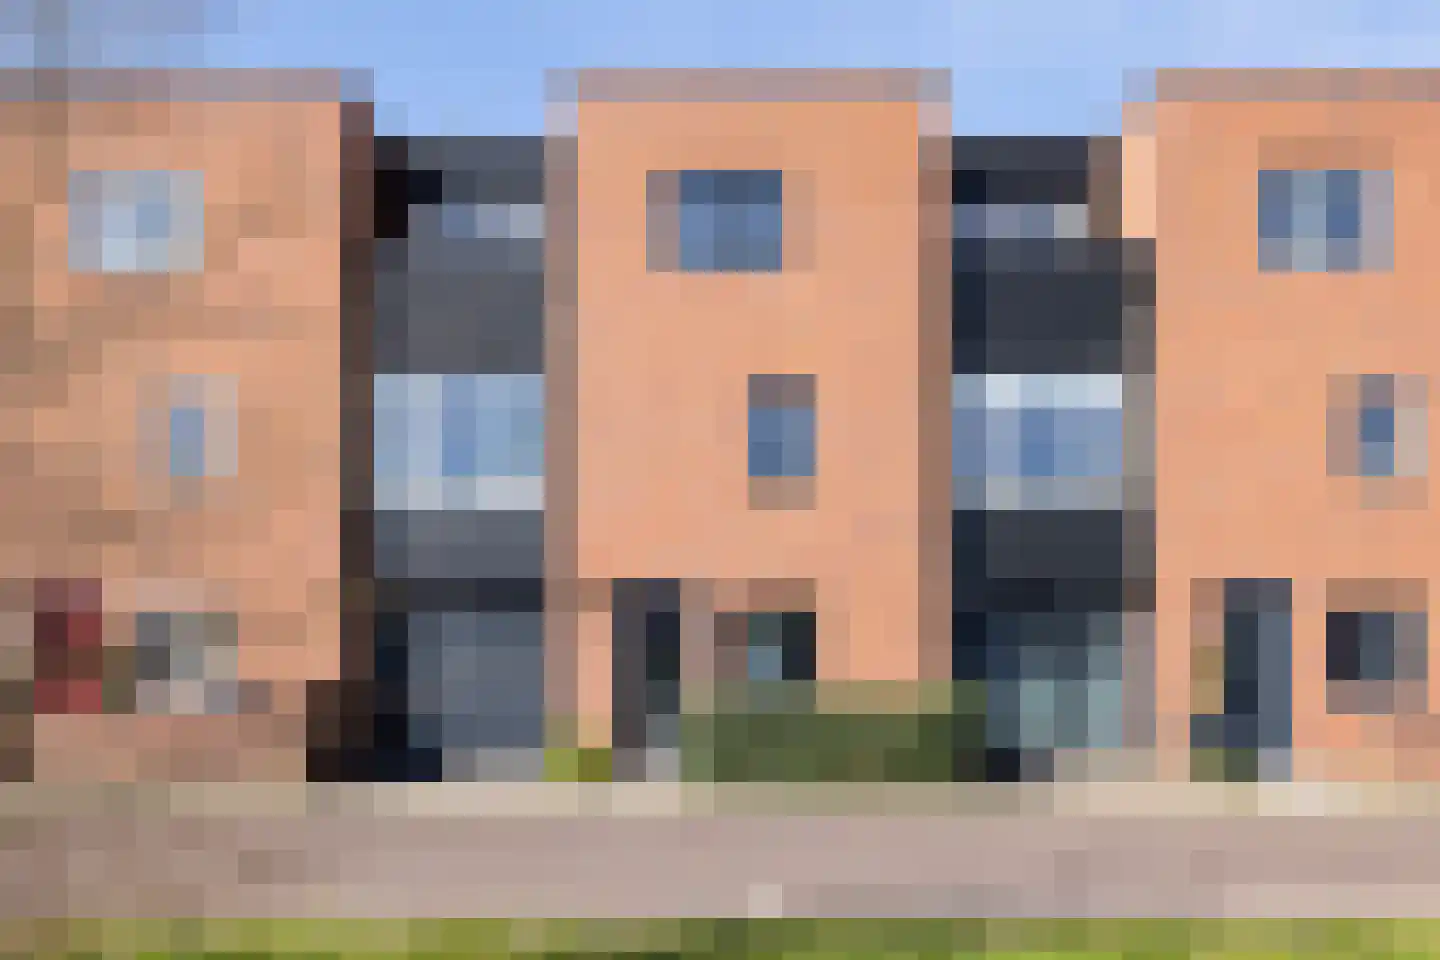
- Available
De Vrijburg 4
6861HB Oosterbeek
€ 509.000 k.k.
CSave as favorite- Living area
- 92 m²
- Land area
- —
- Bedrooms
- 2
-

- Available
Koningstraat 72 4
6811DJ Arnhem
€ 339.000 k.k.
€ 5.468/m²
ASave as favorite- Living area
- 62 m²
- Land area
- —
- Bedrooms
- 1
-

- Available
Meerkoet 28
6988CL Lathum
€ 529.500 k.k.
€ 4.137/m²
BSave as favorite- Living area
- 128 m²
- Land area
- 311 m²
- Bedrooms
- 2
-

- Available
Valkhofplein 73
6825GN Arnhem
€ 299.500 k.k.
€ 3.255/m²
BSave as favorite- Living area
- 92 m²
- Land area
- —
- Bedrooms
- 3
-

- Available
Dijkstraat 14 2
6828JR Arnhem
€ 350.000 k.k.
€ 6.034/m²
ASave as favorite- Living area
- 58 m²
- Land area
- —
- Bedrooms
- 2
Reviews (152)
Review platforms
BronscoresTotal score
152 total reviews

Funda
61 reviews on Funda

91 reviews on Google
-
Halve Morgen 49
9Een goede makelaar die mee denkt en je helpt wat je van een makelaar verwacht. Ze reageren snel en zijn snel met regelen.
-
Gasthuislaan 26
9Makelaar heeft goed geholpen om onze nieuwe woning aan te kopen voor het juiste bedrag. Contact met de makelaar ging meer dan prima
-
Hunenborgstraat 28
9Zeer goede kennis van de huizen markt En zeker van de lokale markt Goede ondersteuning bij verkoop En een zeer doortastende makelaardij
-
Chiel Menthen
10Het contact met Mike en het team van Van Sonsbeeck Makelaars is van begin tot eind ontzettend prettig geweest. Vanaf het eerste moment werd er goed meegedacht en lag er direct een duidelijk plan voor de verkoop van mijn woning. Wat ik vooral waardeerde is dat het team echt met ideeën kwam om de verkoop zo goed mogelijk aan te pakken. Door hun kennis, ervaring en duidelijke aanpak voelde het hele proces professioneel en vertrouwd. Ik ben tijdens het hele traject echt ontzorgd en dat gaf veel rust. Dankzij hun inzet en begeleiding kijk ik met een heel goed gevoel terug op de verkoop. Kortom: een betrokken team, duidelijke communicatie en een zeer prettige samenwerking. Absoluut een aanrader als je je woning wilt verkopen.
-
Vijverlaan 1 19
10Top presentatie, doordacht verkoopplan en duidelijke communicatie. Professioneel, betrokken en snel verkocht! Gewoon een heel fijn kantoor.
-
Bakkerstraat 68 1
10Prettig en professioneel van eerste contact tot verkoop Goed advies, responsief, goede communicatie.
-
Victor Kooijmans
10Translated by AIThe decision to choose Mike and his team as sales agents was an excellent choice. They are approachable and have guided us as sellers well. The transparency and clarity ensured a good cooperation where our wishes were heard.
-
Nieuwstad 81
9Translated by AII am very happy with Van Sonsbeeck. During the purchase process, we were well advised regarding the amount of the offer and whether we should make an offer at all. The real estate agent was easily reachable and kept the appointments. After a search of 6 months, we have acquired an apartment in the city center of Arnhem!
-
Van Lawick van Pabststraat 113 2
9Translated by AIFrom the first phone call there was pleasant contact. They take their time, go through everything and listen to you. They took care of everything, but we were kept constantly informed. When questions arose, we received detailed answers quickly via whatsapp or a call.
-
De Zeis 4
10Translated by AI3x home sold via Van Sonsbeeck, top real estate agent. Good knowledge of the market and prime sales strategy.
-
Het Nieuwe Land 35
10Translated by AIGreat contact and easy access. Easy to reach and flexible. Mike really tried to achieve a nice result and it worked!
-
Matthijs Kramer
10 -
Ruben Driessen
10Translated by AIWe are well assisted by the colleagues of van Sonsbeeck real estate agents. Definitely worth recommending!
-
Ranonkelstraat 13 2
9Translated by AIVery nice team with knowledgeable people on staff. Think along and you get a lot of personal attention. Especially as a starter, that is very desirable with this difficult housing market.
-
Dullertstraat 34
8Translated by AIFirst-class real estate agent. Very accessible and solution-oriented. We are very satisfied with the guidance during the sale of our house.
-
Zaalboslaan 45
10Translated by AIClear and good contact. React quickly and clearly to questions, both by phone and email. Nice and pleasant contact, real recommendation.
-
Daalhuizerweg 4
10Translated by AIVery nice real estate agent, clearly gives his advice regarding the house to be purchased. Concrete appointments made in advance so clarity in negotiation room.
-
Muurdijk 36
10Translated by AIVan Sonsbeeck has helped us with finding and purchasing our dream house. They are very customer-friendly, professional, and answer all your questions quickly. We are very happy with our choice of Van Sonsbeeck. Really a recommendation!
-
Koningstraat 44
7Translated by AIThe contact went perfectly. Good knowledge of the sales, correct at my house. Calm discussion. Not in a hurry.
-
Van Wageningenstraat 68
10Translated by AIVan Sonsbeeck is very knowledgeable and helped me a lot with the sale of my house. The communication was excellent. Van Sonsbeeck thinks along and makes every effort to sell a property well and quickly.