
Het vinden van uw droomhuis of het verkopen van uw huidige woning is meer dan een zakelijke handeling. Het betreft vaak een persoonlijke en emotionele ervaring, waarin herinneringen, vertrouwen en nieuwe beginnende levensfasen een rol spelen. U zoekt niet alleen naar ruimte of voorzieningen, maar ook naar een plek die bij u past. Een verkoop of aankoop is vaak een belangrijke financiële stap. U wilt zeker weten dat u de juiste keuzes ma...
Current housing stock
-

- Available
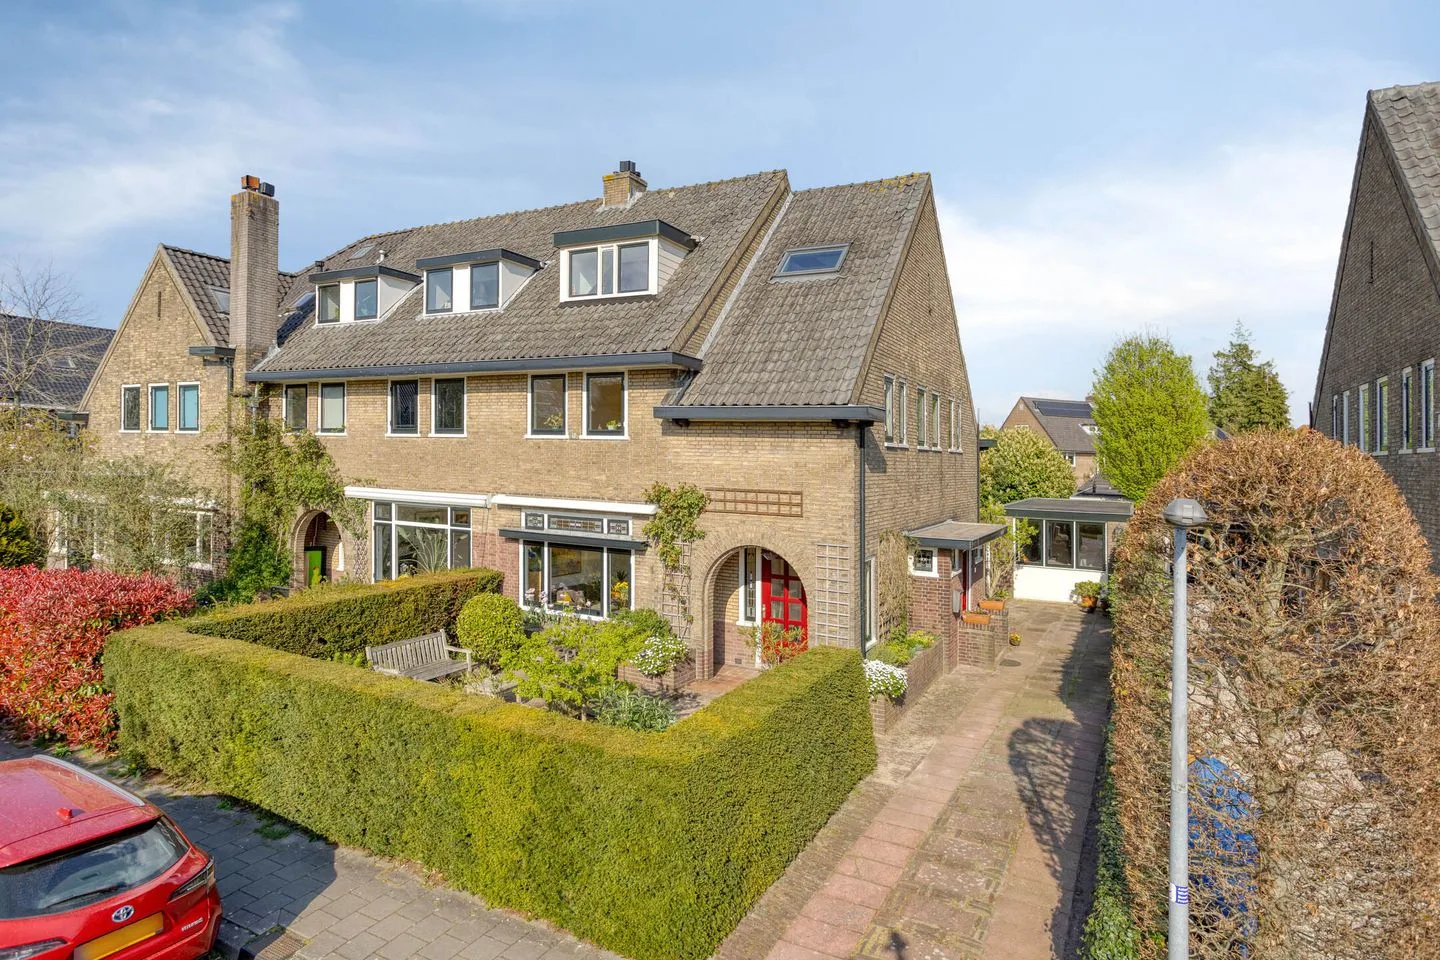
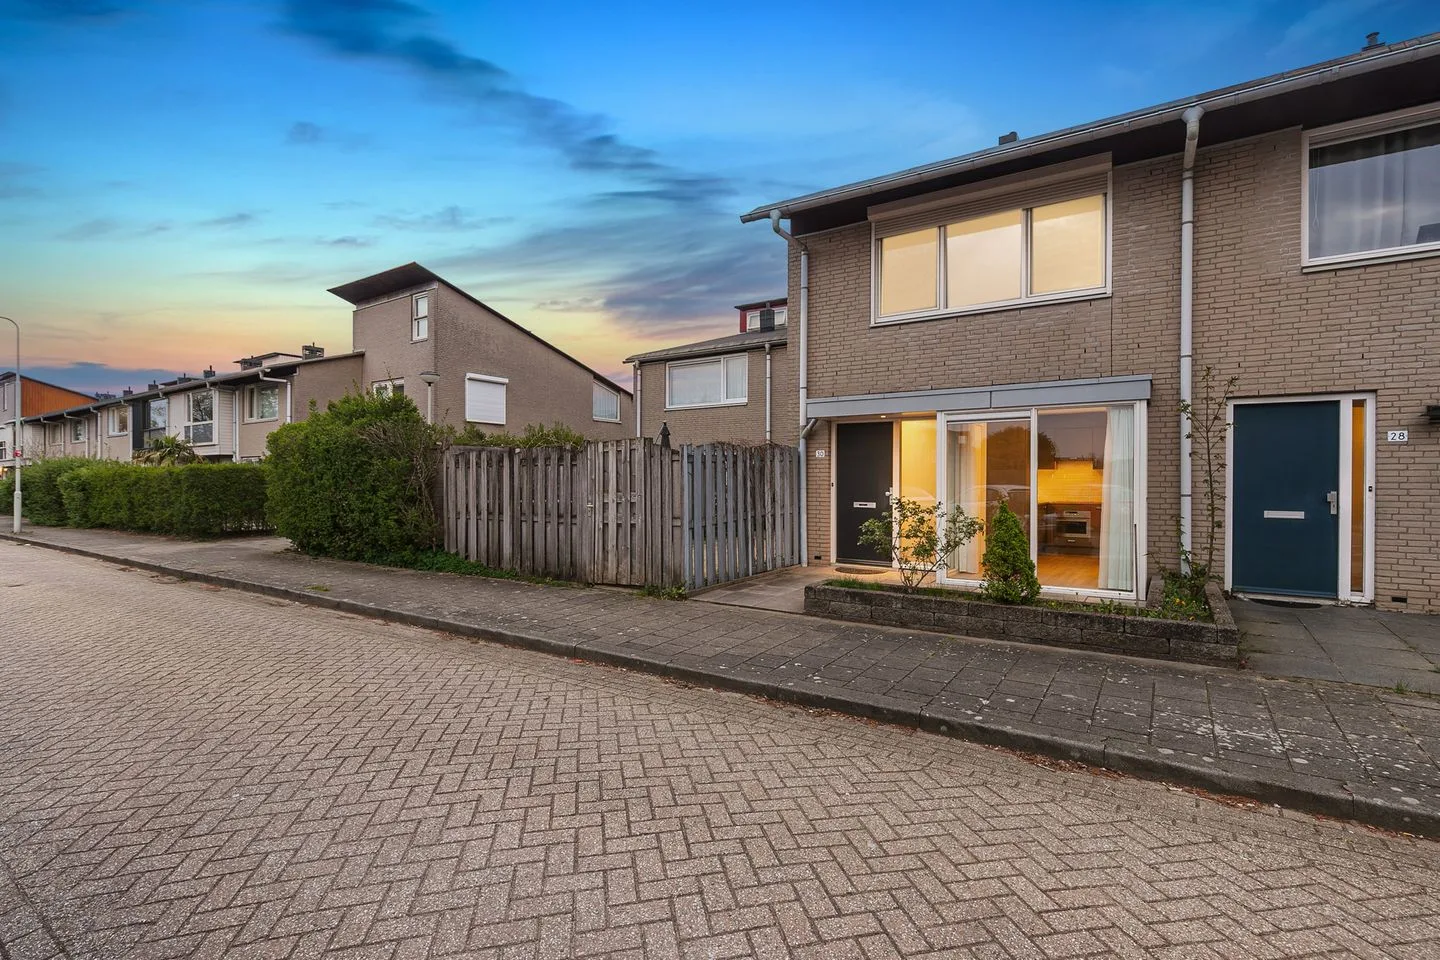
Jhr. Nedermeijer van Rosenthalweg 28
6862ZW Oosterbeek
€ 895.000 k.k.
€ 5.296/m²
CSave as favorite- Living area
- 169 m²
- Land area
- 825 m²
- Bedrooms
- 3
-

- Available
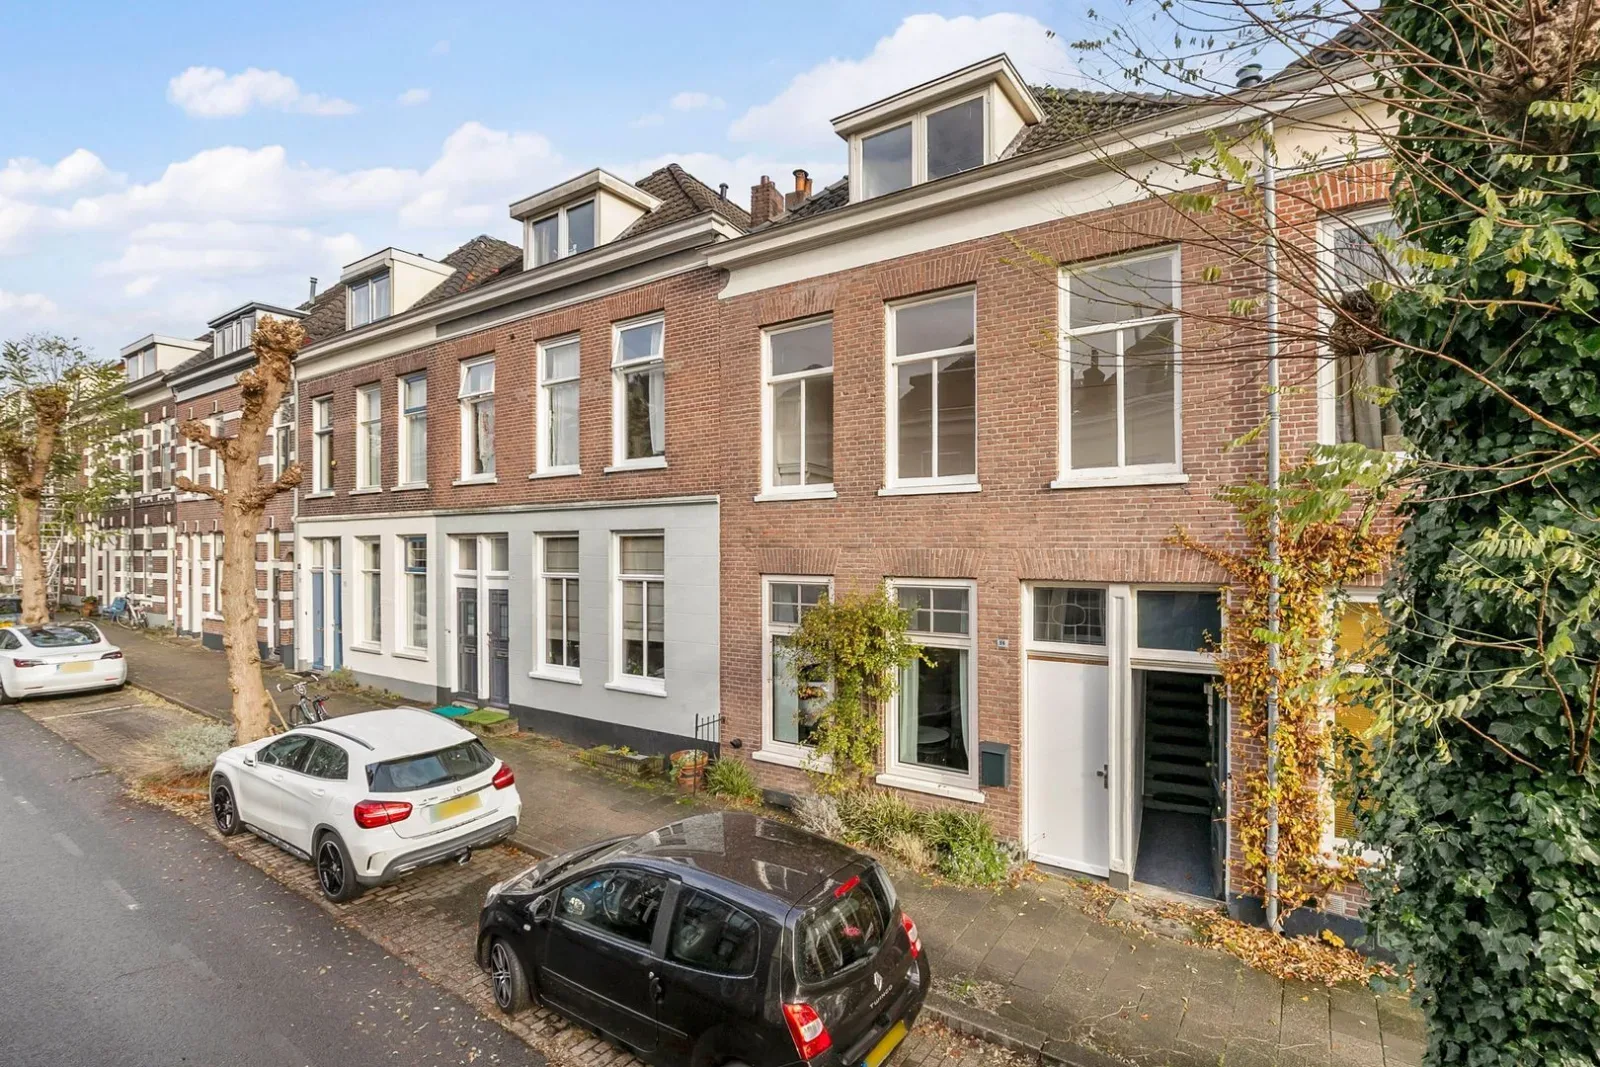
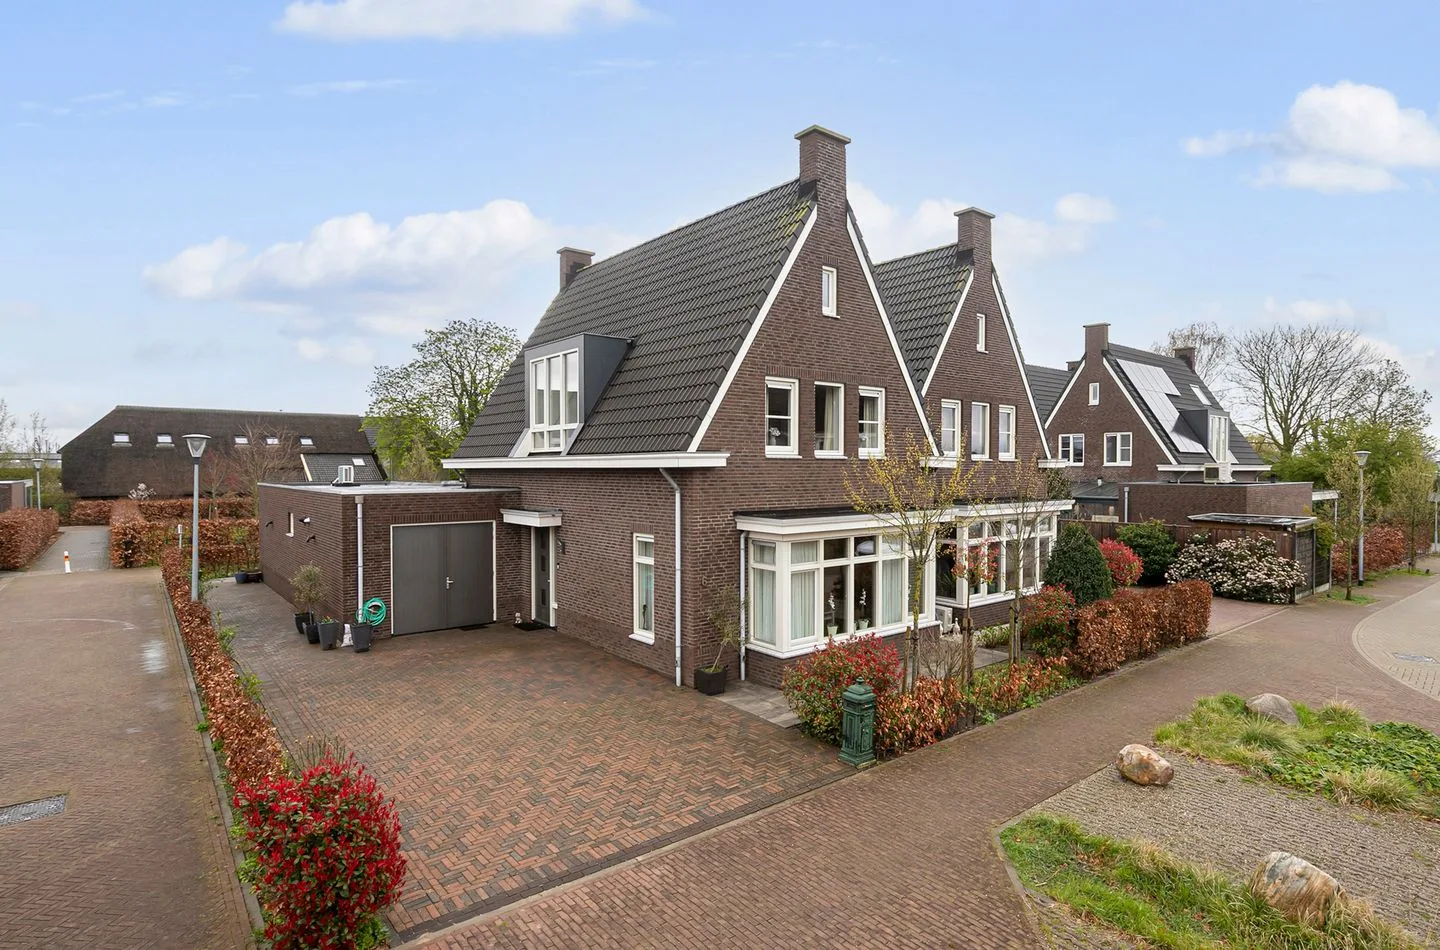
Prins Hendrikstraat 12 A
6862GZ Oosterbeek
€ 795.000 k.k.
€ 5.445/m²
BSave as favorite- Living area
- 146 m²
- Land area
- 275 m²
- Bedrooms
- 5
-

- Available
Muntendamstraat 16
6861VE Oosterbeek
€ 489.000 k.k.
A+Save as favorite- Living area
- 85 m²
- Land area
- —
- Bedrooms
- 2
-

- Available
Matzer van Blooisplantsoen 6
6862EN Oosterbeek
€ 1.298.000 k.k.
A+Save as favorite- Living area
- 255 m²
- Land area
- 478 m²
- Bedrooms
- 4
-

- Available
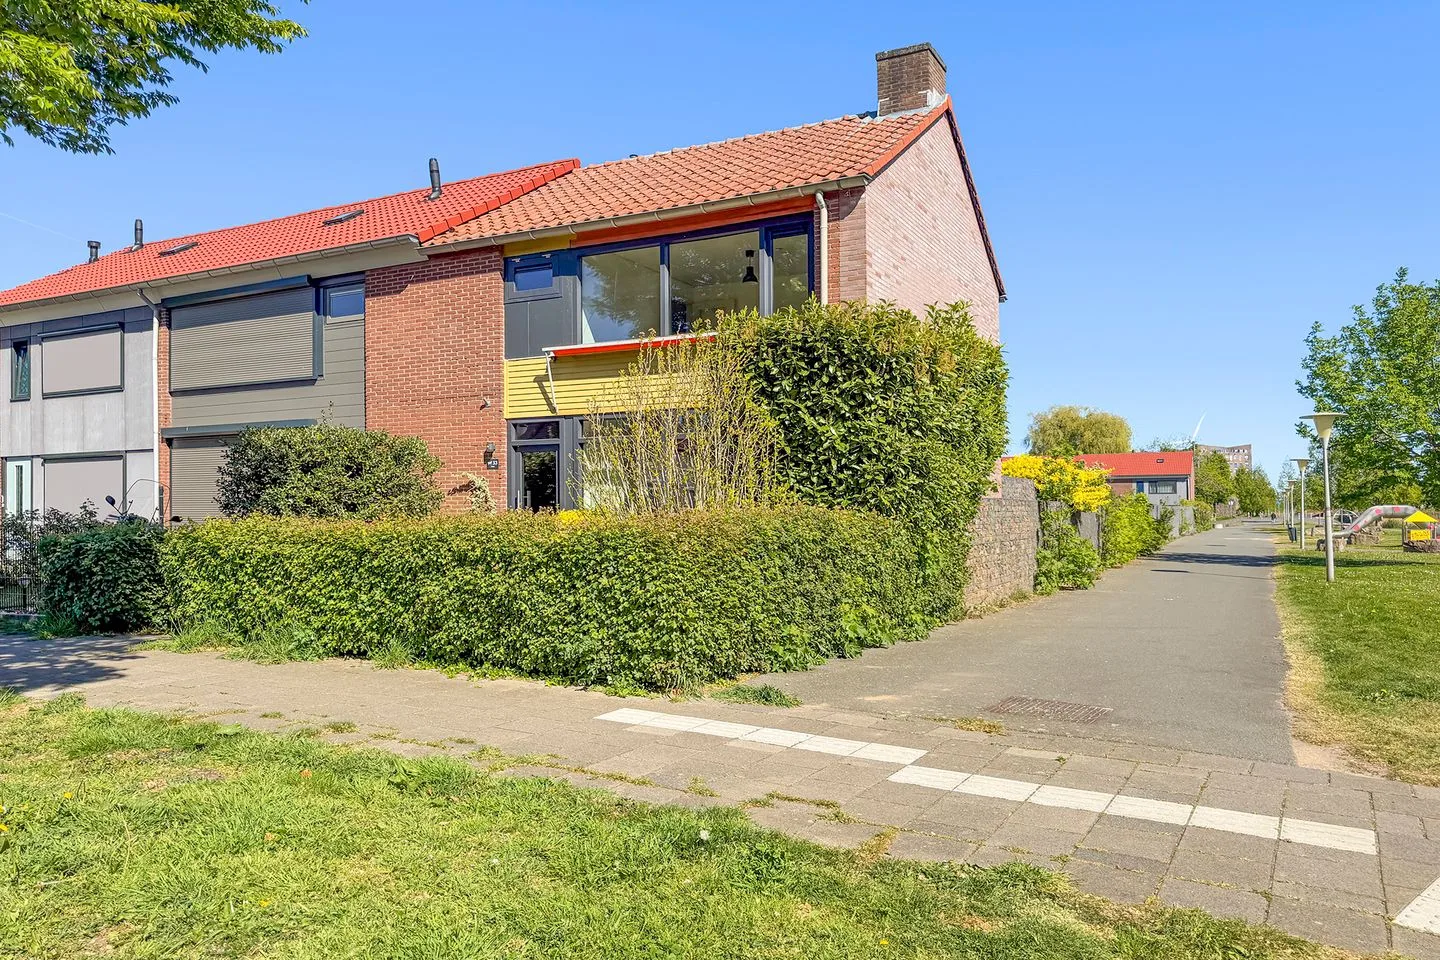
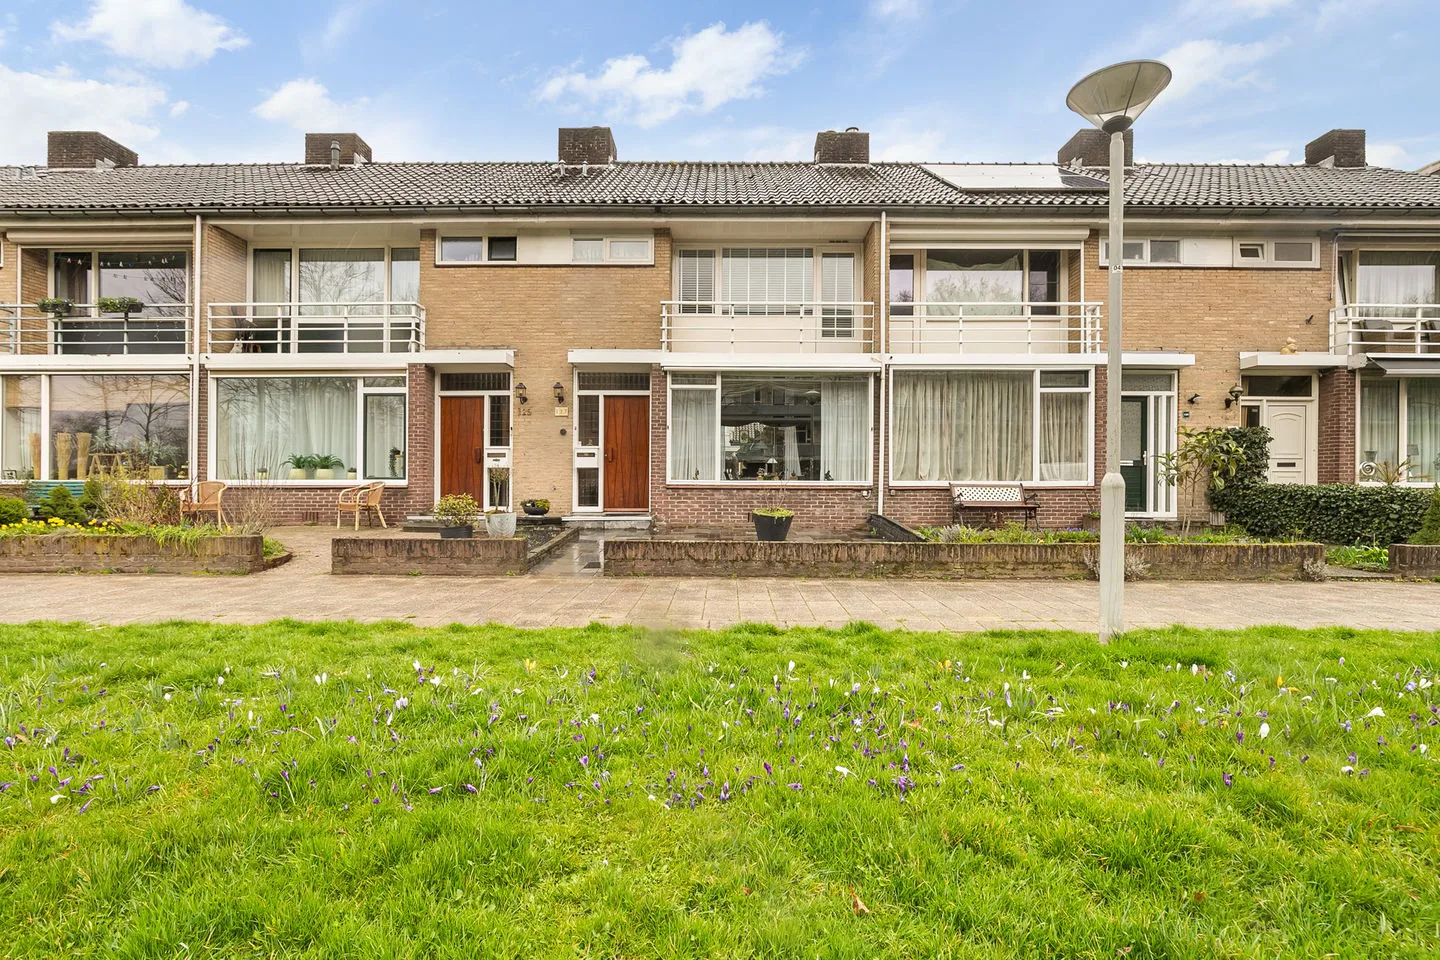
Hammarskjoeldlaan 4
6865BJ Doorwerth
€ 749.500 k.k.
€ 4.435/m²
ESave as favorite- Living area
- 169 m²
- Land area
- 341 m²
- Bedrooms
- 5
-

- Available
It String 7 0007
8511AB Goingarijp
€ 339.500 k.k.
BSave as favorite- Living area
- 60 m²
- Land area
- 202 m²
- Bedrooms
- 3
Reviews (84)
Review platforms
BronscoresTotal score
84 total reviews

Funda
73 reviews on Funda

11 reviews on Google
-
Wilhelminastraat 13
8Translated by AIContact went well but communication could be a bit more careful and also professional. The content of the service may be explained in somewhat more detail.
-
Benedendorpsweg 19
9Translated by AIThe contact and expertise was undoubtedly very professional, pleasant and with a good result.
-
Noorderweg 9
10Translated by AIVery nice cooperation. Top on all levels! I am extremely satisfied and want to thank the entire team immensely!
-
Wolfhezerweg 120 32
9Translated by AICoen Sonneveld is an excellent real estate agent, who fits perfectly with us and our house. Calm and professional, we chose a good sales strategy together, which resulted in our house being sold very quickly. Thursday on Funda, the week after multiple viewings and by Wednesday it was already sold. Fast and at a good price. We can now fully focus on our new house that we have purchased and are going to renovate.
-
Stephanieweg 6
10Translated by AIWe are very satisfied with Van Musscher & Sonneveld. They have helped us a lot in selling the house, despite the fact that we had some setbacks. They also guided us very well there. These pleasant and normal people really understand their profession. Clear communication with short lines is very nice. Thank you very much for this.
-
Heuveloordweg 7
9Translated by AIVery good! Always reachable, explanation complete and received expert advice during purchase and also the sale of old house went smoothly
-
Marina Lavanova
2Translated by AIIt took a long time before I dared to write this review. At first it seemed that I had good contact with this company and employees. Until it was not anymore. There is now a legal procedure going on about hidden defects and I noticed very quickly how the real estate agent has protected themselves. At my expense. Transactions were not carried out according to regulations and yet I see little cooperation from the real estate agent. I wish no one to end up in such a situation. That's why my review is also very low. And I hope that others who have had similar experiences with this real estate agent will also come forward. There are some.
-
Nassaulaan 29
10Translated by AIExpert and pleasant real estate agents! Good guidance during the sale and adequate feedback and support from the office. Strongly recommended!!
-
Voorinkstraat 18
8Translated by AIIn my case in particular via app. Telephone contact was always very accessible. Friendly and correct handling!
-
van Limburg Stirumweg 28
10Translated by AIWe can wholeheartedly recommend Jan Berendsen, along with the office team, photographer Daniel and videographer Teun. We were allowed to experience the entire sales process as a masterclass.
-
ir. Munterlaan 33
8Translated by AIFirst-class real estate agent. Good personal guidance with expertise and market knowledge. Appointments were kept.
-
Beethovenlaan 116
9Translated by AIGood first contact, lots of discussion, open to our own vision, support and trust in the process, open to suggestions regarding the course and content of the sales process
-
Molenweg 24
10Translated by AIVan Musscher & Sonneveld Makelaars has helped us fantastically in searching for a home. Both the real estate agents and the office are empathetic and easy to reach. Both Jan and Coen make sure that you don't miss anything during a viewing and are also very pleasant to deal with. We would definitely recommend VMS to everyone.
-
Utrechtseweg 88 D
10Translated by AISuper good service and very easy to get in touch with real professionals who are very helpful, friendly and always ready to help
-
Stortweg 12
10Translated by AIThe contact with the real estate agent went fantastically, both personally and by telephone I was wonderfully helped. Everyone was also very friendly. I would definitely recommend this real estate agent.
-
Sara Mansveltweg 3
10Translated by AII can do nothing, just write about them. They react quickly. And they are helpful and they think along. Nice people to work with. And they remain very professional towards the other party. And they are honest, they dare to say, if you go too far.
-
Ameideplantsoen 2
10Translated by AIA super team you can rely on. From start to finish, they're ready for you. Do you have a question? They help directly.
-
Burgemeestersplein 11
10Translated by AIJan is a top performer! Keeps an eye on the big picture AND on detail level. Just a very pleasant person to work with. And a highly competent backoffice that is always easy to reach.
-
Wilhelminastraat 9
10Translated by AIAmazing experience with VMS when selling our home! From the first conversation we immediately had a good feeling about VMS. They really took the time for us, listened to our wishes and gave honest and clear advice. We felt well supported throughout the entire process — always quickly reachable and with clear communication. What we especially appreciated was the personal approach: no standard story, but real attention and involvement. We wholeheartedly recommend VMS...
-
Graaf van Rechterenweg 53 31
10Translated by AIThe contact with real estate agent Jan Berendsen and his colleagues from the office was friendly, expert, personal and 'in the lead'. He therefore took the initiative and advised knowledgeably on the steps and strategy to be taken. Very pleasant indeed.