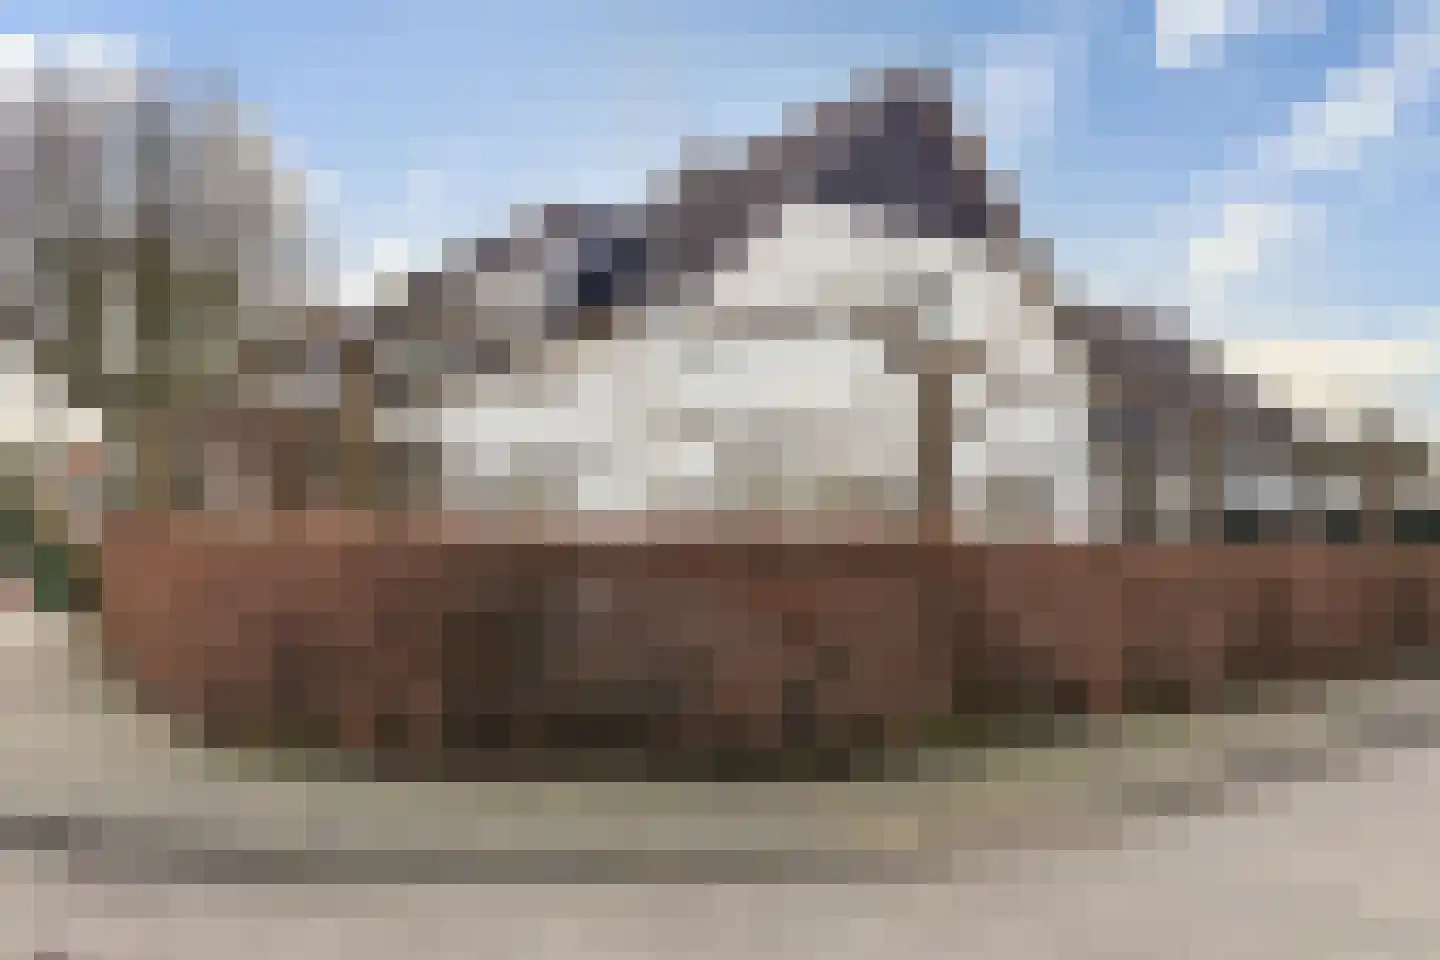
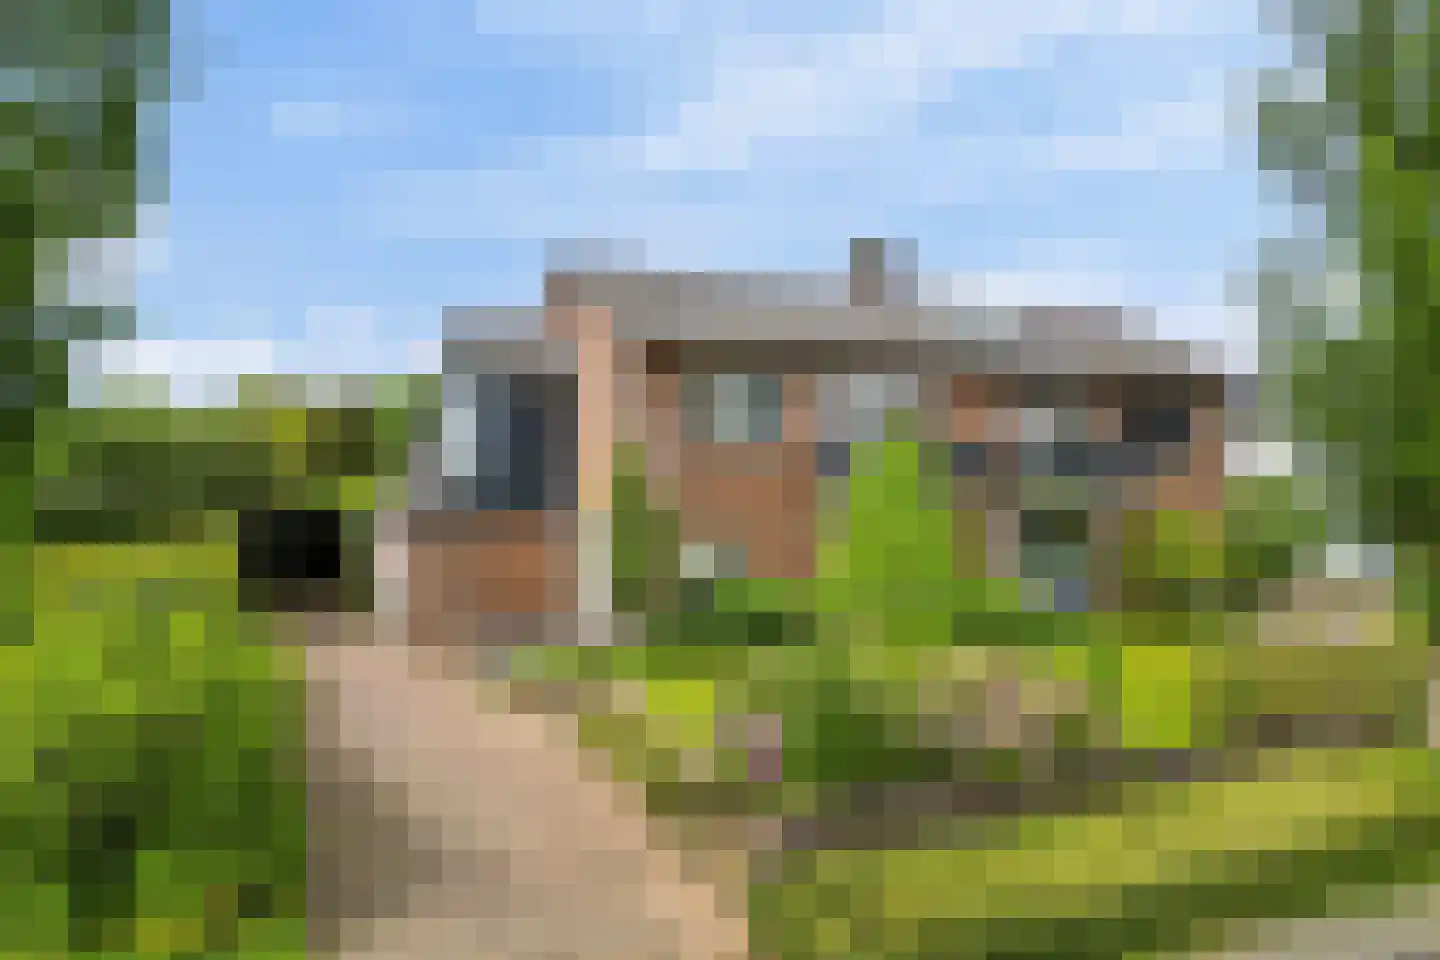
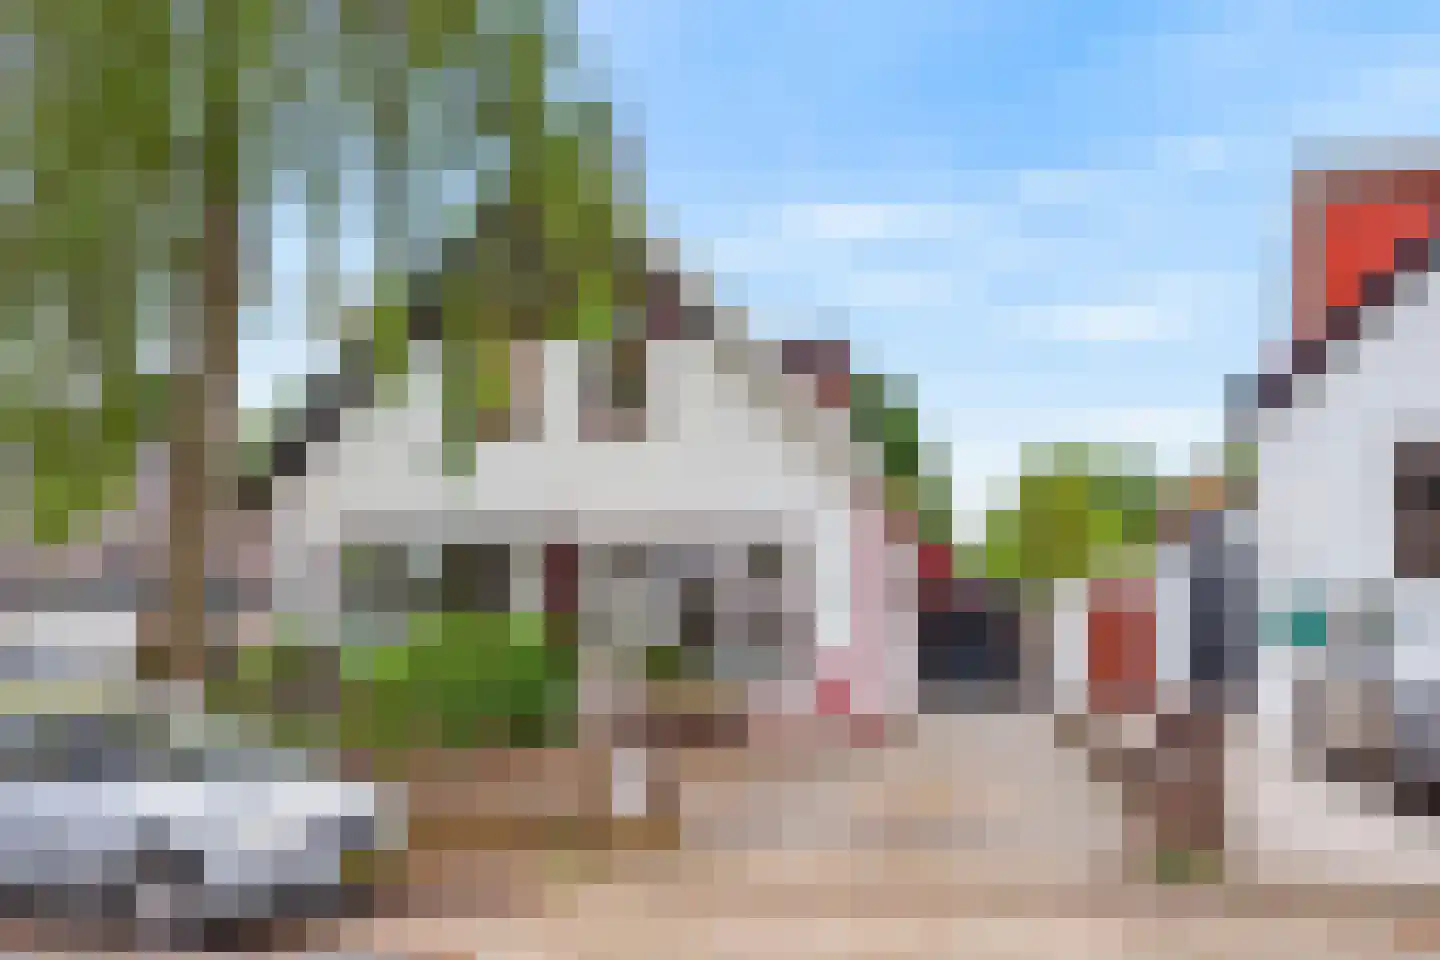
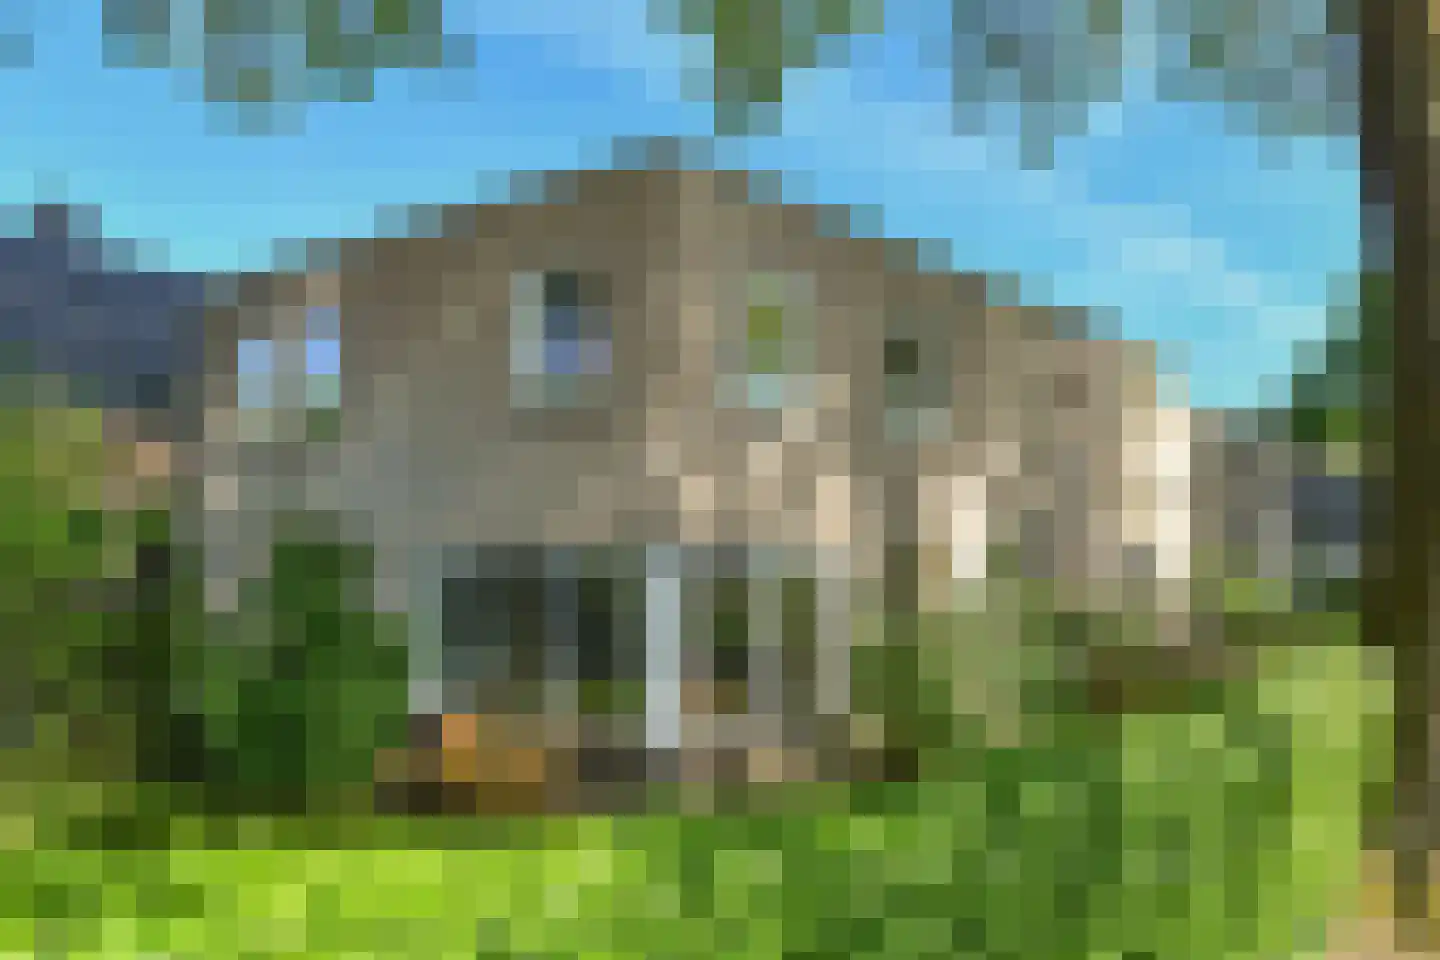
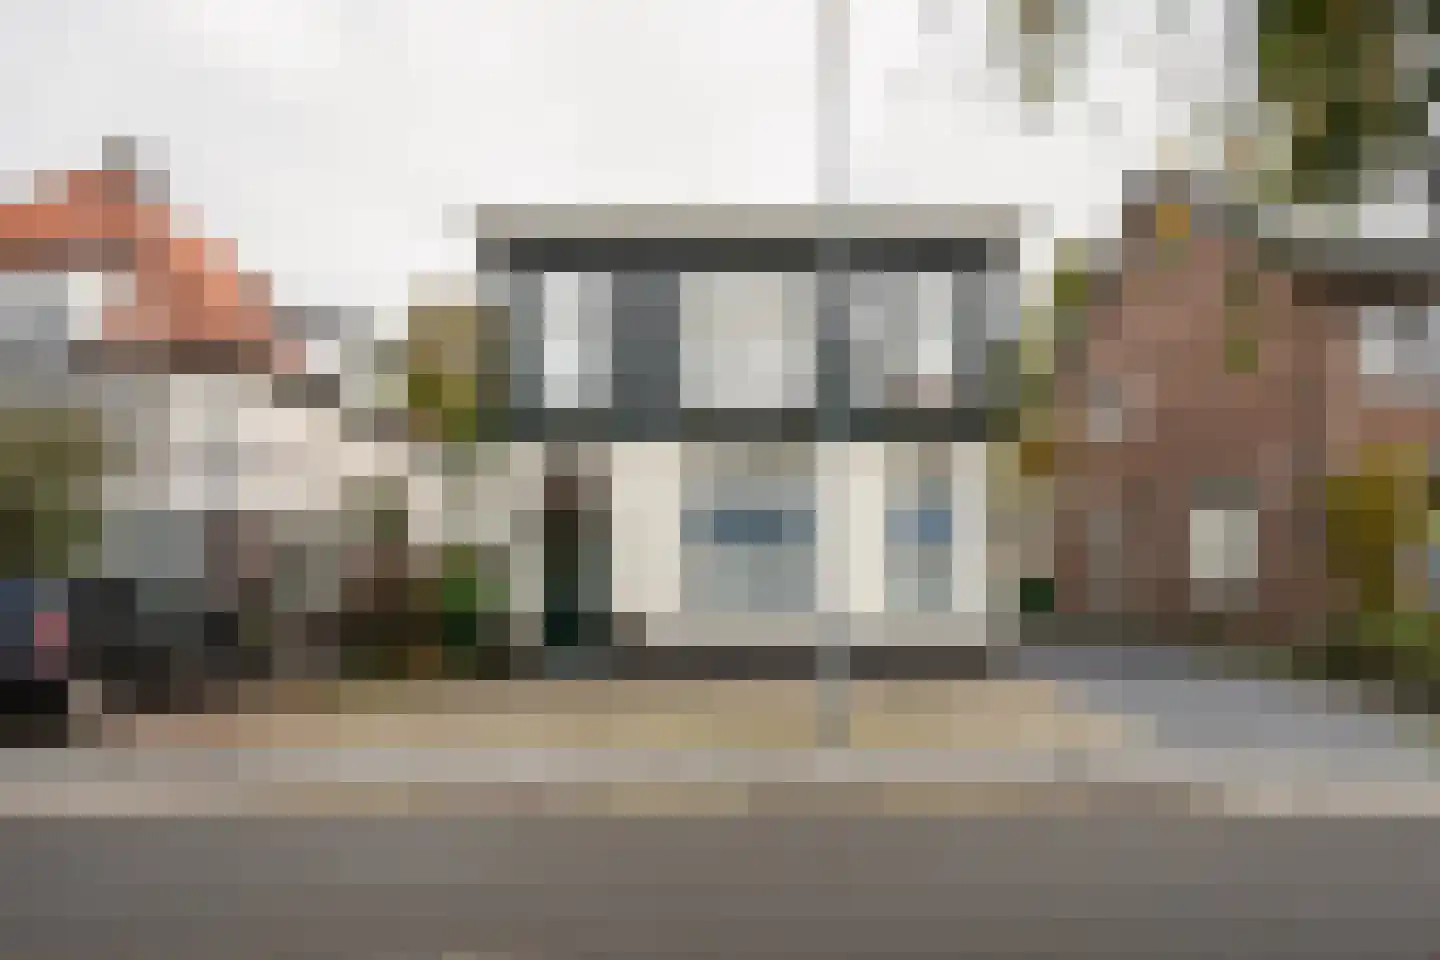
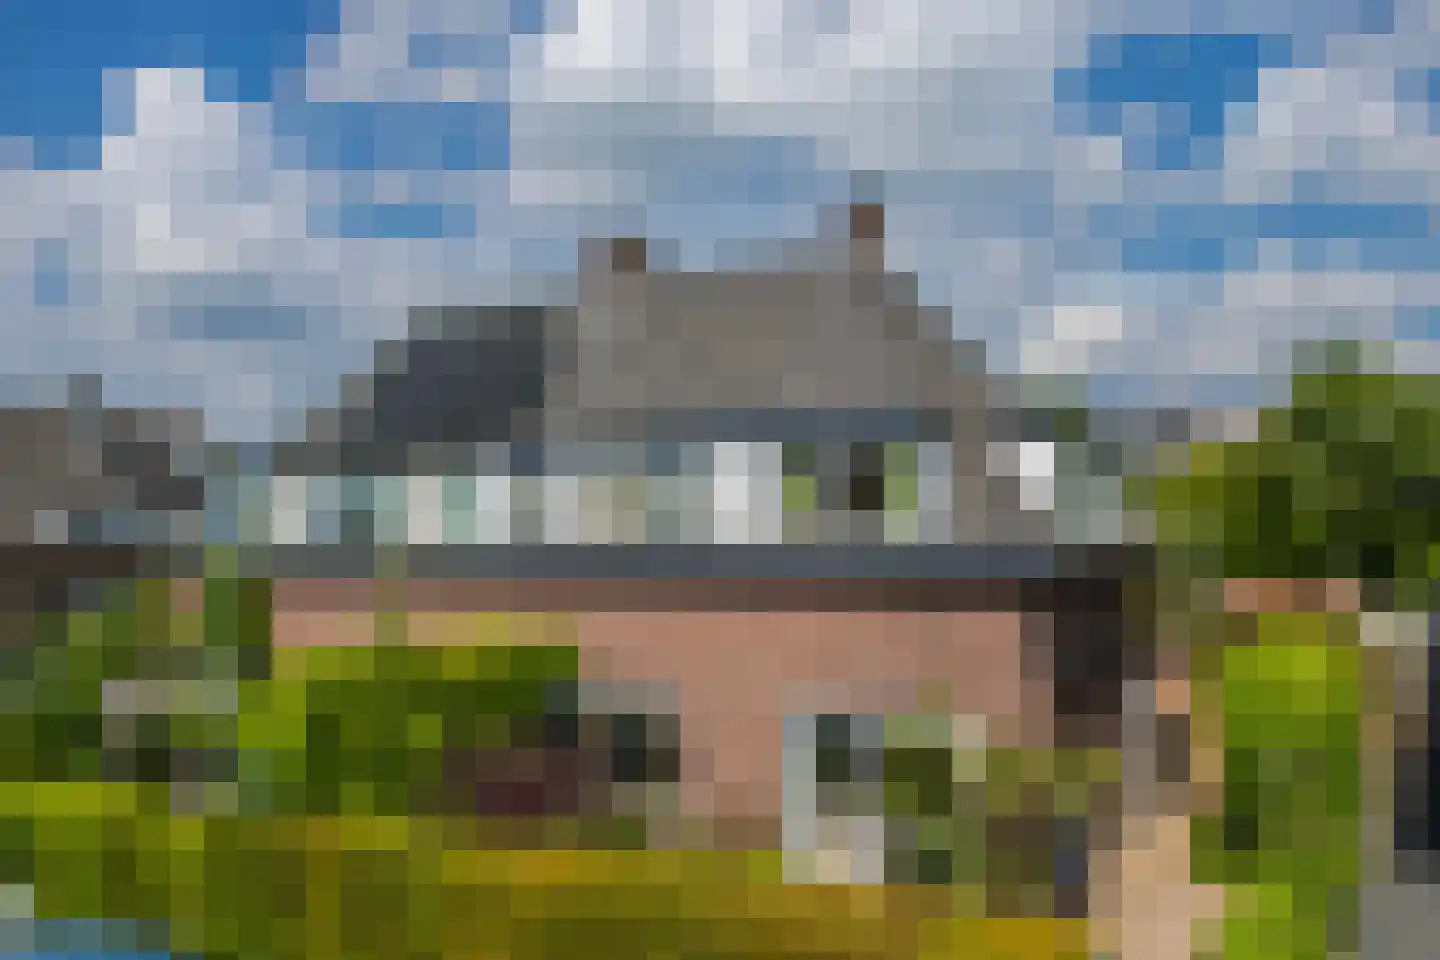
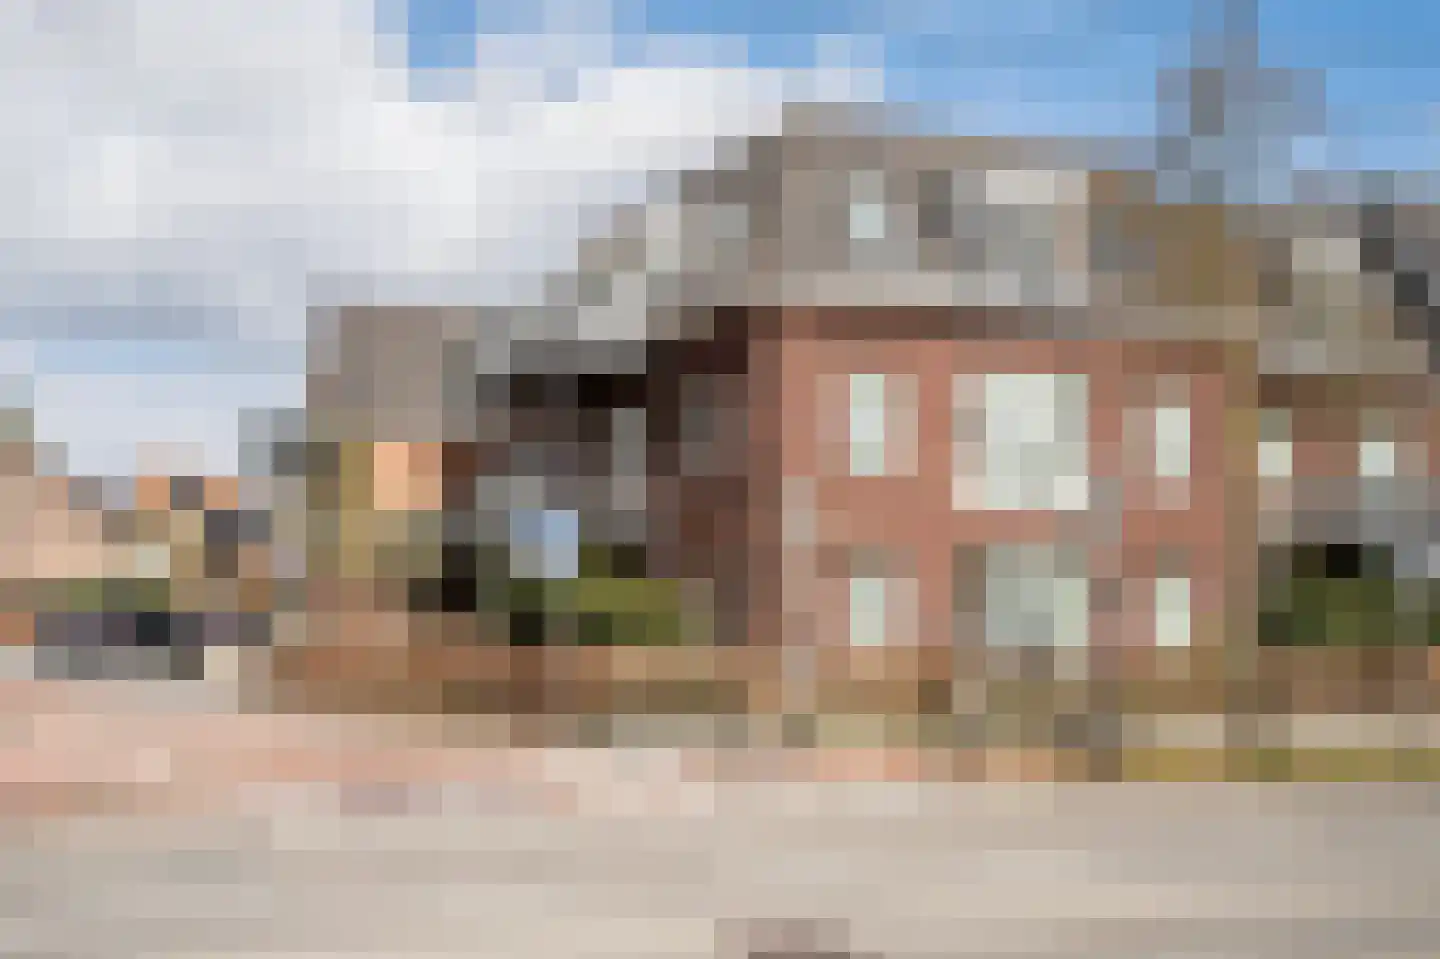
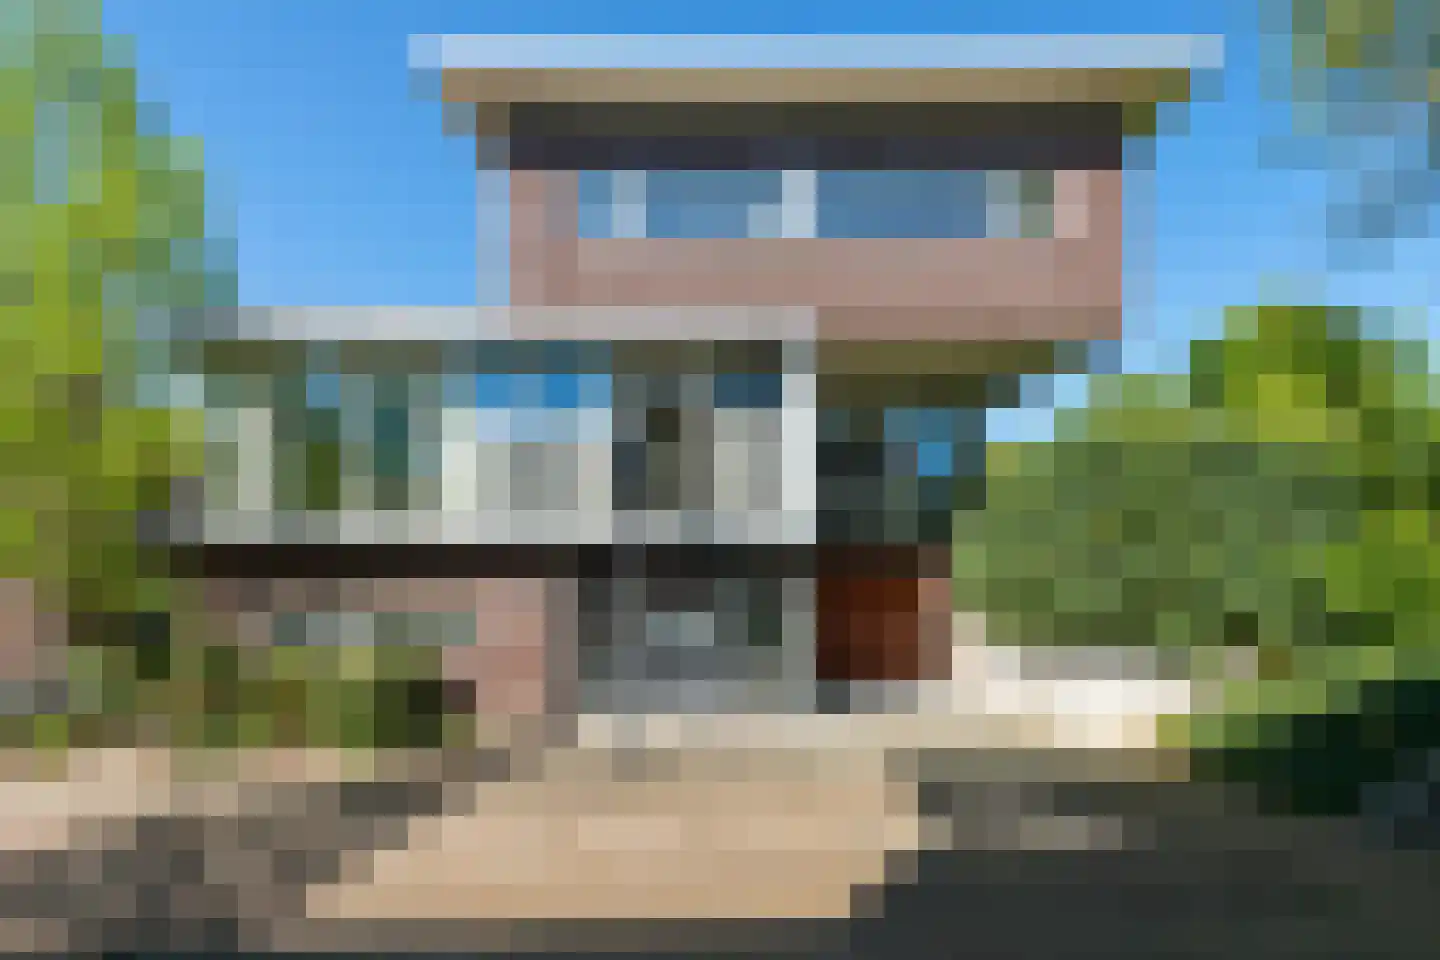
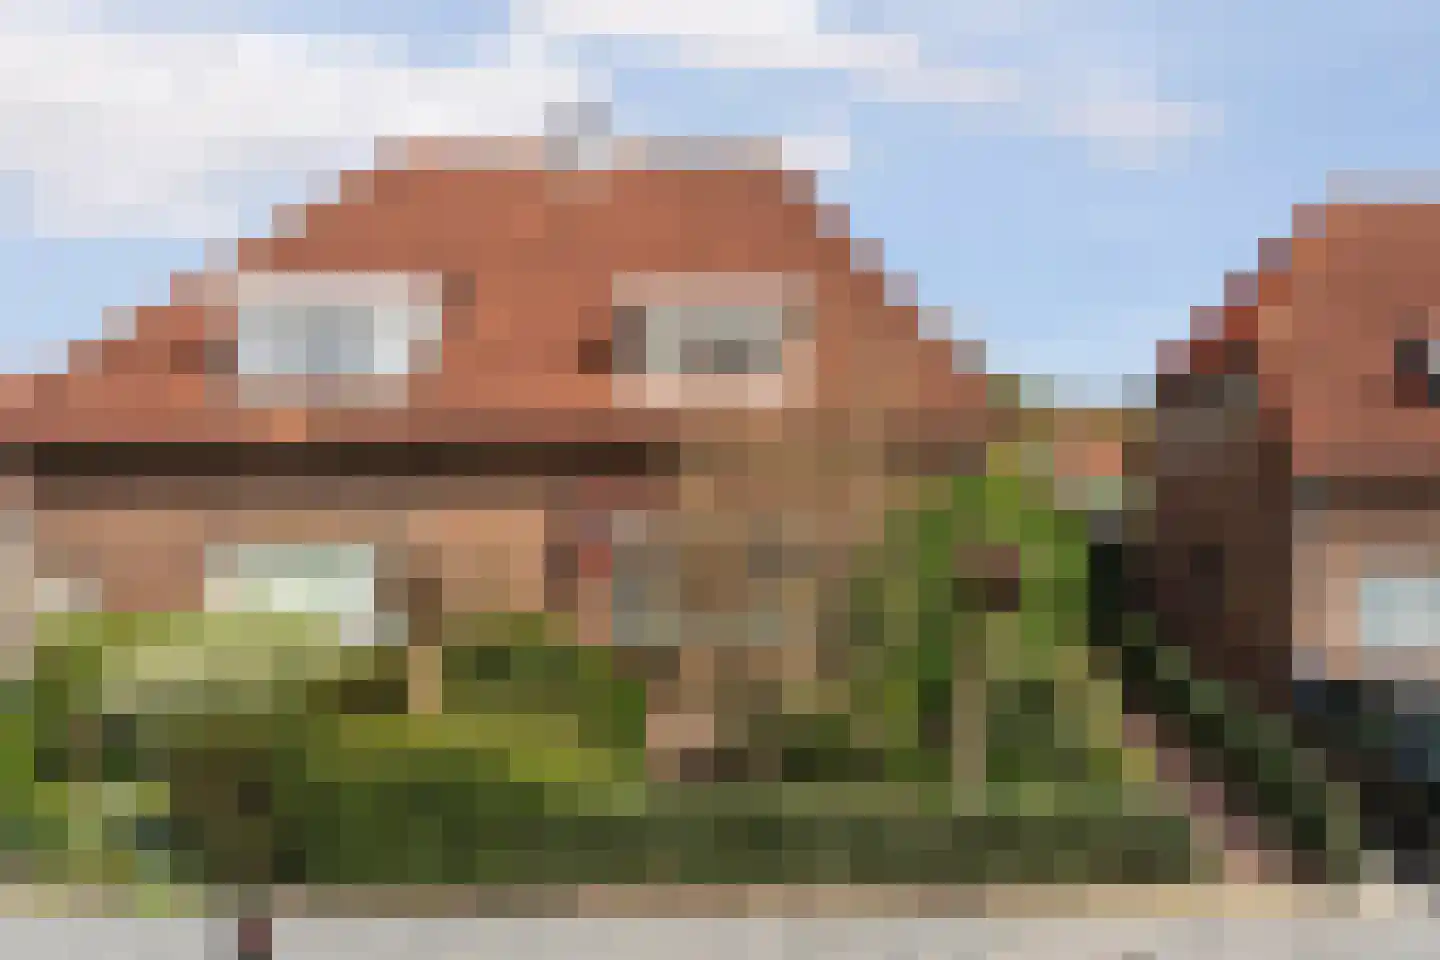
- Available
Nassaulaan 2
6861DB Oosterbeek
€ 595.000 k.k.
€ 5.312/m²
- Living area
- 112 m²
- Land area
- 271 m²
- Bedrooms
- 4
Searching in 162 houses in Oosterbeek
Type to search. Use arrow down and arrow up to navigate through results and press Enter to open.
Hidden search suggestions.
View current properties in Oosterbeek or search targeted on street, postal code and property characteristics.
View the current housing stock in Oosterbeek and quickly filter by price, living area, rooms and more. There are currently 162 houses in this place within our selection. View also 98 sold houses in Oosterbeek for extra insight into the local housing market.
6861DB Oosterbeek
€ 595.000 k.k.
€ 5.312/m²
6861DD Oosterbeek
€ 350.000 k.k.
€ 4.118/m²
6861EE Oosterbeek
€ 898.000 k.k.
€ 4.216/m²
6861GJ Oosterbeek
€ 544.000 k.k.
€ 5.333/m²
6862XB Oosterbeek
€ 775.000 k.k.
€ 6.008/m²
6861ZJ Oosterbeek
€ 439.500 k.k.
€ 5.110/m²
6861AV Oosterbeek
€ 800.000 k.k.
€ 4.103/m²
6861AV Oosterbeek
€ 405.000 k.k.
€ 5.870/m²
6862BW Oosterbeek
€ 2.650.000 k.k.
€ 6.448/m²
6861HA Oosterbeek
€ 545.000 k.k.
€ 5.396/m²
6862GG Oosterbeek
€ 395.000 k.k.
€ 5.000/m²
6861CM Oosterbeek
€ 795.000 k.k.
€ 4.056/m²
6862ED Oosterbeek
€ 319.000 k.k.
€ 3.097/m²
6861ZZ Oosterbeek
€ 665.000 k.k.
€ 5.038/m²
6862HP Oosterbeek
€ 795.000 k.k.
€ 3.023/m²
6862GZ Oosterbeek
€ 795.000 k.k.
€ 5.445/m²
6861XL Oosterbeek
€ 495.000 k.k.
€ 5.211/m²
6862AC Oosterbeek
€ 585.000 k.k.
€ 6.500/m²
6862DP Oosterbeek
€ 589.000 k.k.
€ 6.333/m²
6861ZT Oosterbeek
€ 1.675.000 k.k.
€ 6.025/m²
6861ZM Oosterbeek
€ 869.000 k.k.
6861BS Oosterbeek
€ 745.000 k.k.
6861VE Oosterbeek
€ 489.000 k.k.
6861HB Oosterbeek
€ 509.000 k.k.
6861XL Oosterbeek
€ 575.000 k.k.
6862EN Oosterbeek
€ 1.298.000 k.k.
6861XS Oosterbeek
€ 525.000 k.k.
€ 5.833/m²
6861CP Oosterbeek
€ 779.500 k.k.
€ 5.376/m²
Get free quotes from real estate agents with local market knowledge. Compare more than 84 real estate agents in Oosterbeek.
Selling a home in Oosterbeek? View the sales-oriented guide sell a house in Oosterbeek, compare all real estate agents in Oosterbeek or view the top 10 real estate agents in Oosterbeek for extra context to your choice.
Real estate agents make sharper offers when they know you're comparing — ask for quotes for sale or purchase.
Practical answers about housing supply, sales and comparing real estate agents in Oosterbeek.
The costs of a real estate agent in Oosterbeek depend on commission, setup costs, property presentation and the chosen service. Compare the 84 real estate agents in Oosterbeek via the real estate agent page and request multiple quotes to compare rates and approach well.
Within our selection, we are currently showing 162 houses in Oosterbeek. View also the sold houses in Oosterbeek to compare the current offering with recent transactions.
Take into account not only price and living area but also maintenance, energy label, location, outdoor space and sales status. This way you compare houses in Oosterbeek on more than just the asking price.
A local real estate agent knows the neighborhoods, recent transactions and demand in Oosterbeek. By comparing 84 real estate agents in the region you get a better insight into prices, sales strategy and expected yield; the top 10 in Oosterbeek provides a useful starting point.
Yes, when making a sales plan, a valuation in Oosterbeek is wise. You gain insight into a realistic asking price and can then compare offers from real estate agents specifically.
View current location data on residents, WOZ development, housing stock, energy consumption, business activity and safety in Oosterbeek. In 2026 were there 11.140 residents. The average WOZ value in 2025 is EUR 527.735.
These figures help to better assess and compare the housing stock in Oosterbeek with recent sold homes. Orient yourself then on suitable top real estate agents in Oosterbeek for sales advice in this region.
Residents
11.140
Last year: 2026
Average WOZ
EUR 527.735
Last year: 2025
Average income per person.
EUR 39.280
Source: AllNumbers
Crimes (current year)
346
Total registered
| Year | Residents |
|---|---|
| 2021 | 11.370 |
| 2022 | 11.395 |
| 2023 | 11.410 |
| 2024 | 11.235 |
| 2025 | 11.290 |
| 2026 | 11.140 |
| Year | Average WOZ |
|---|---|
| 2021 | EUR 382.998 |
| 2022 | EUR 411.493 |
| 2023 | EUR 480.586 |
| 2024 | EUR 494.039 |
| 2025 | EUR 527.735 |
Hoger
4.090
Praktisch
1.380
Middelbaar
2.170
Europa
860
Nederland
9.315
Buiten Europa
1.135
Label G
1.093
Label C
955
Label A
904
Label F
785
Label E
613
Label D
525
Label B
497
Label A+
49
Label A+++
30
Label A++
28
Label A++++
2
Label A+++++
0
| Year | Gas (m3) | Electricity (kWh) |
|---|---|---|
| 2020 | 1.559 | 2.958 |
| 2021 | 1.759 | 3.024 |
| 2022 | 1.370 | 2.835 |
| 2023 | 1.133 | 2.714 |
| 2024 | 1.110 | 2.785 |
Hoekwoning
Gas: 944 • Electricity: 2.187
Huurwoning
Gas: 773 • Electricity: 1.887
Koopwoning
Gas: 1.285 • Electricity: 3.084
Appartement
Gas: 700 • Electricity: 1.900
Tussenwoning
Gas: 829 • Electricity: 2.049
Vrijstaande woning
Gas: 1.783 • Electricity: 4.129
Twee-onder-één-kap woning
Gas: 1.231 • Electricity: 3.115
Total number of company establishments: 2.050
| Period | Crimes |
|---|---|
| jan 2026 | 25 |
| jul 2025 | 33 |
| jun 2025 | 38 |
| mei 2025 | 25 |
| mrt 2025 | 33 |
| mrt 2026 | 31 |
| nov 2024 | 24 |
| nov 2025 | 20 |
| okt 2024 | 64 |
| okt 2025 | 20 |
| sep 2024 | 40 |
| sep 2025 | 38 |
These figures give an indicative picture of safety trends in the living environment of Oosterbeek.
Short answers based on current local statistics, handy for a quick comparison of the living environment.
Oosterbeek telt in 2026 ongeveer 11.140 inwoners.
De gemiddelde WOZ-waarde in Oosterbeek is in 2025 circa € 527.735.
Het gemiddelde inkomen per inwoner in Oosterbeek ligt rond € 39.280 per jaar.
Voor het huidige jaar gaat het om ongeveer 346 geregistreerde misdrijven. Gebruik deze cijfers als indicatie en vergelijk trends per periode.
In Oosterbeek komt vooral "Appartementen" veel voor, met ongeveer 1.761 woningen.