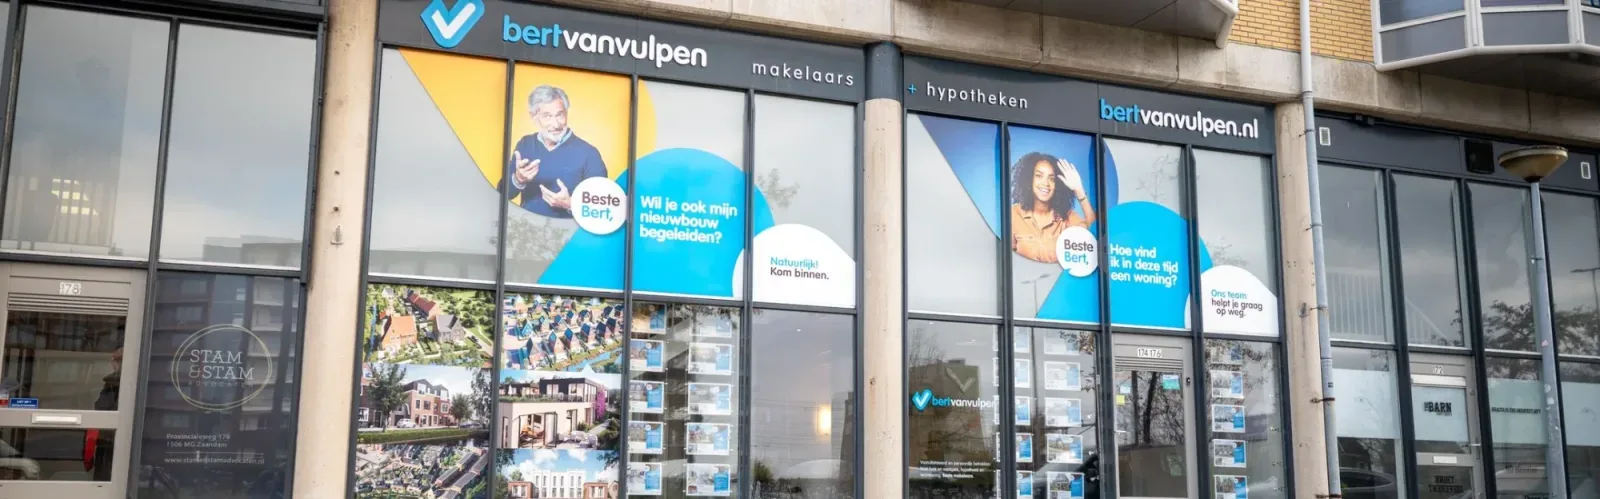
Bert van Vulpen makelaars + hypotheken Krommenie

At Bert van Vulpen in Krommenie, we understand that buying or selling a home is more than just a business transaction. It means starting something new, and therefore personal guidance is central. With more than 30 years of experience, we are ready for you from the first conversation to the last key handover. We combine expertise with empathy, so that you are always aware of where you stand. Our service is integrated: from sales and purc...
Current housing stock
-

- Available
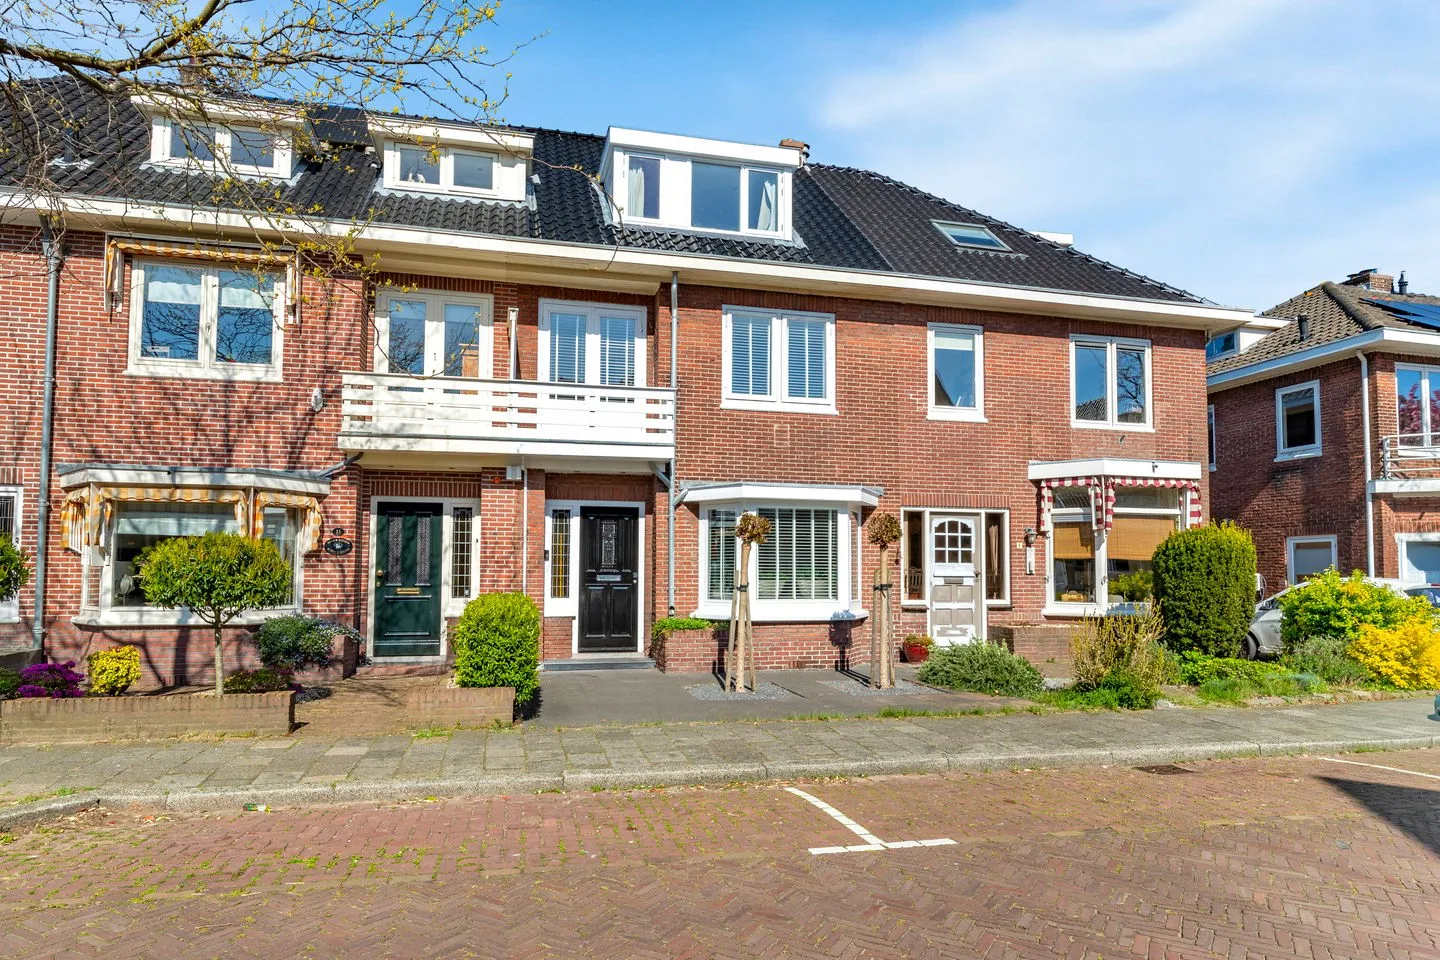
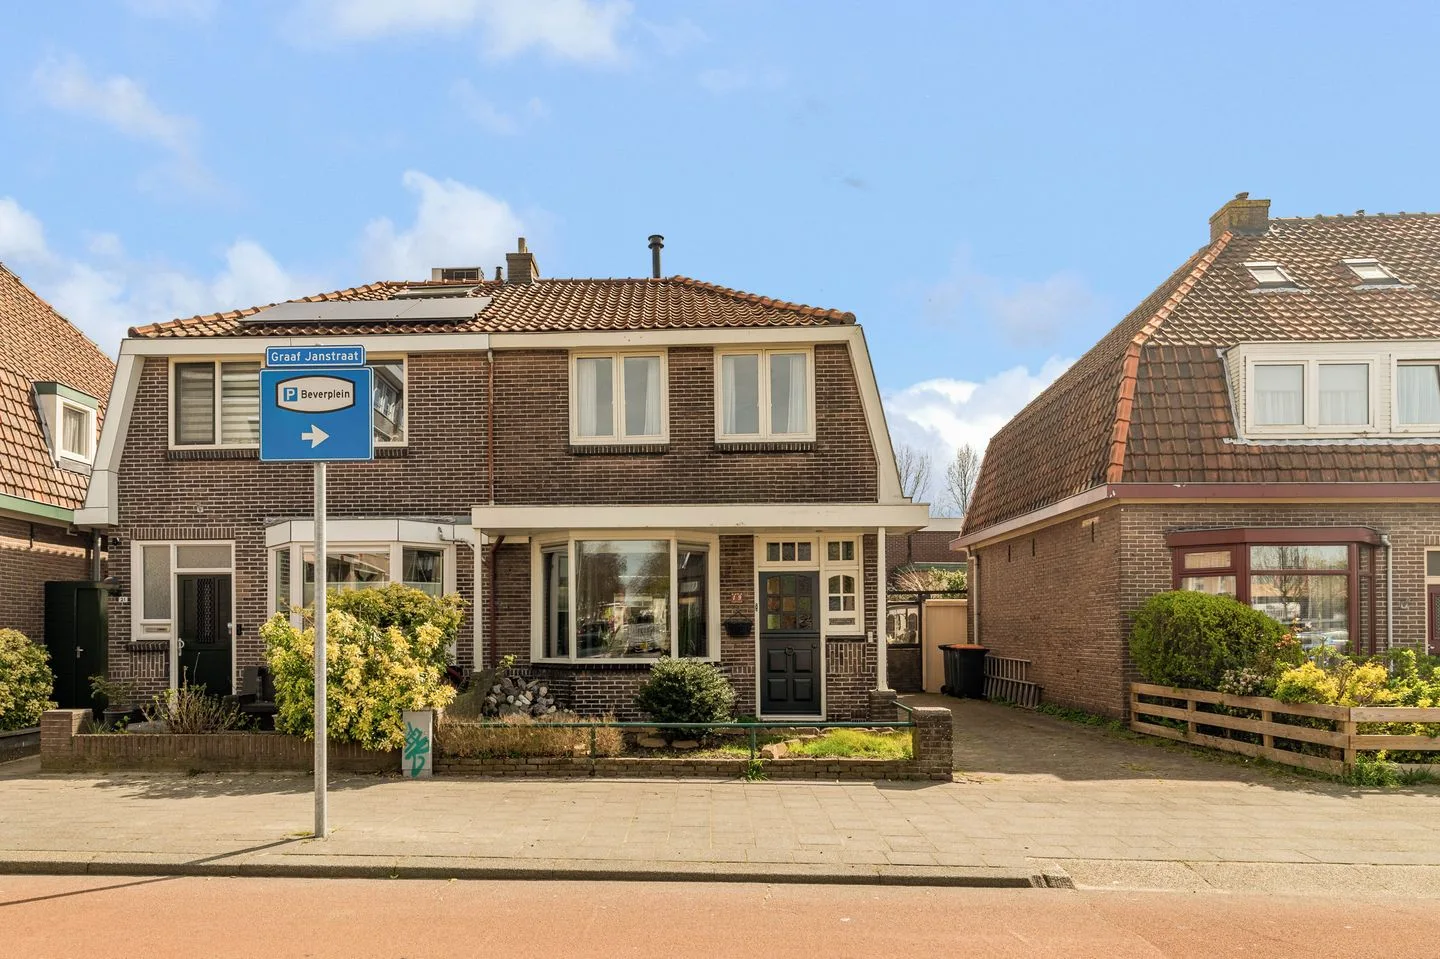
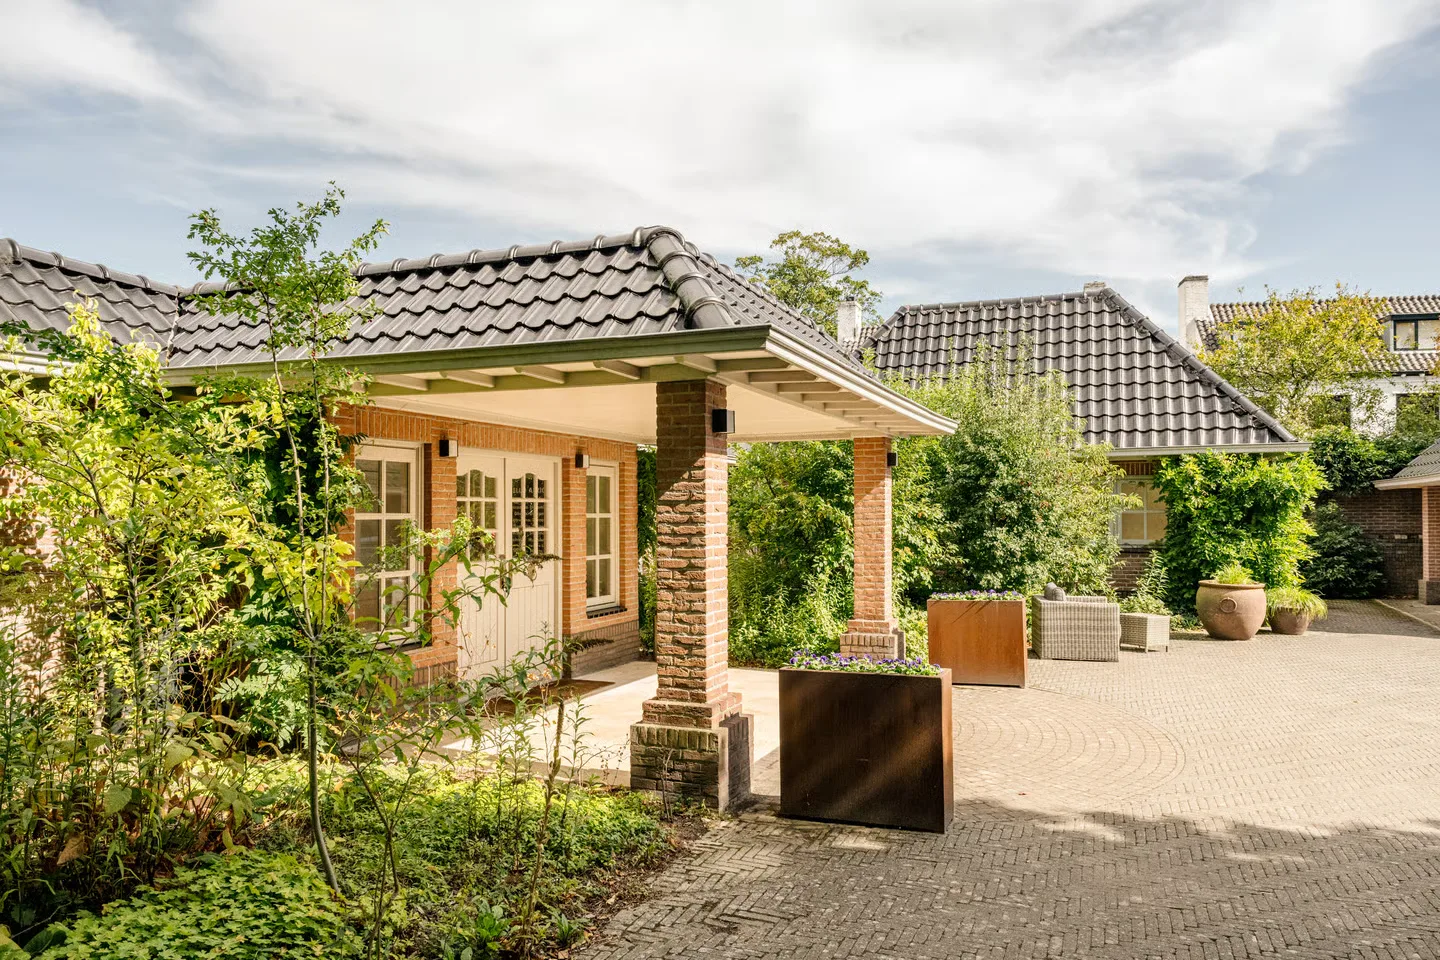
Jan Roggeveenweg 24
1861NK Bergen (NH)
€ 585.000 k.k.
€ 5.177/m²
BSave as favorite- Living area
- 113 m²
- Land area
- 113 m²
- Bedrooms
- 4
-

- Available
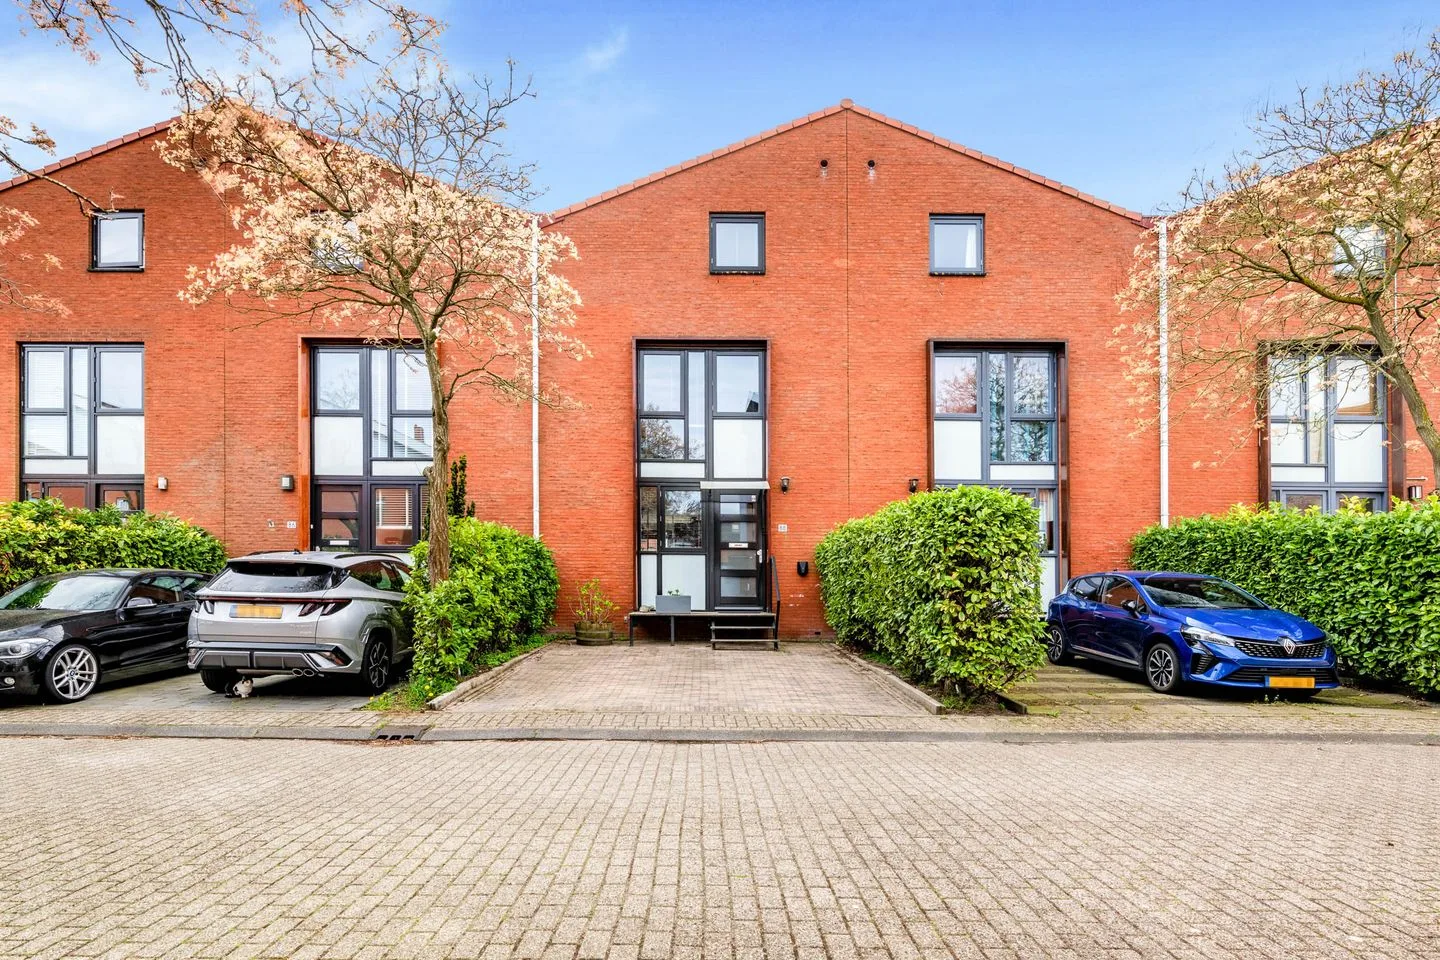
Vogezen 39
1567KC Assendelft
€ 500.000 k.k.
A+Save as favorite- Living area
- 131 m²
- Land area
- 130 m²
- Bedrooms
- 4
-

- Available
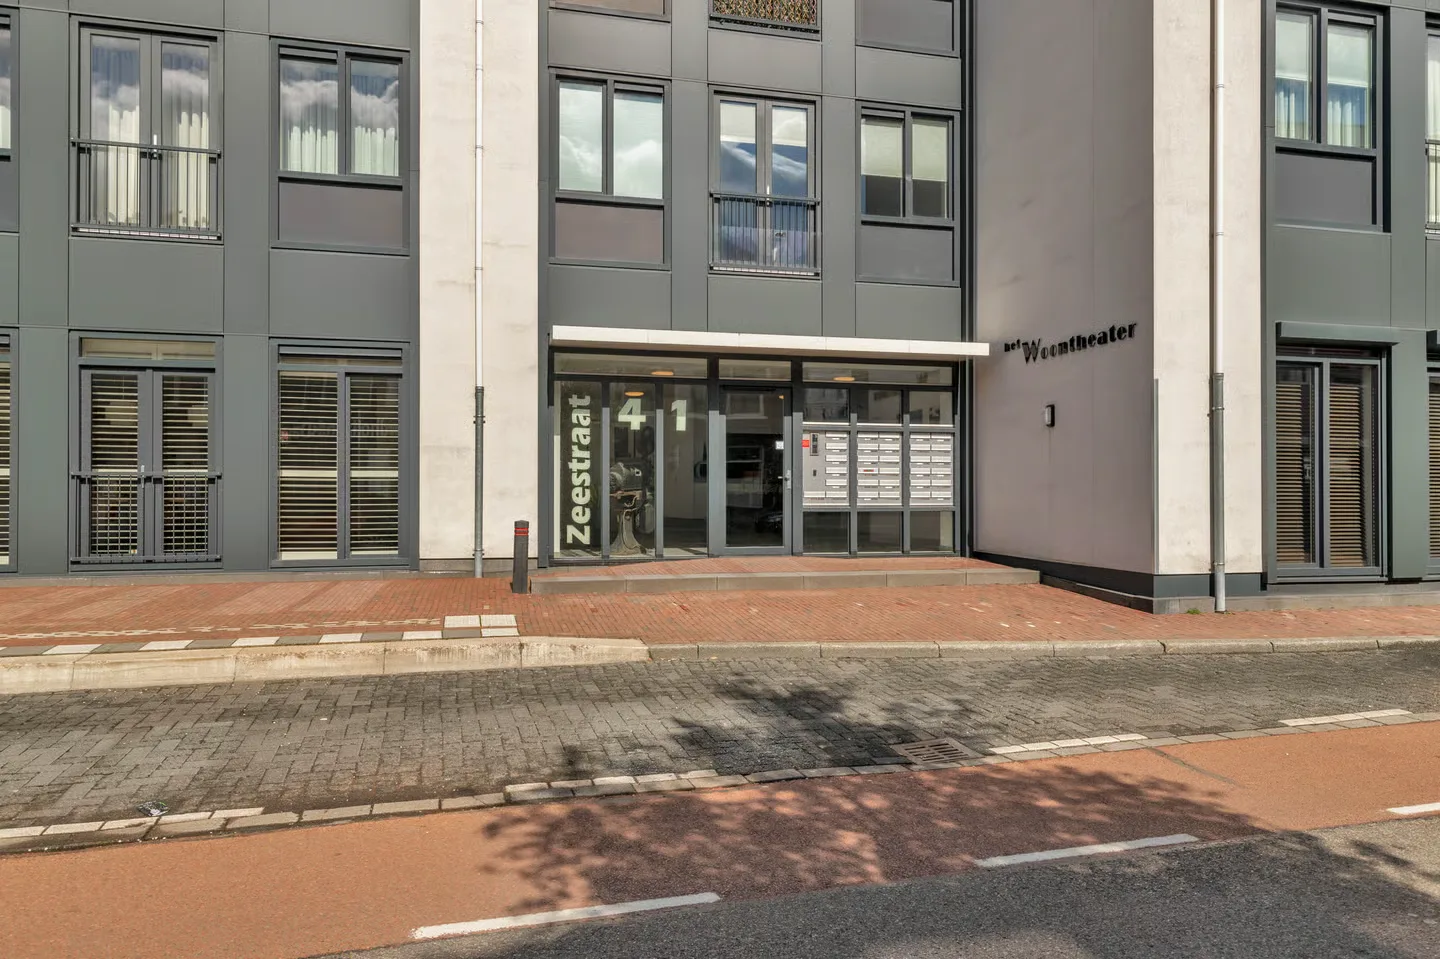
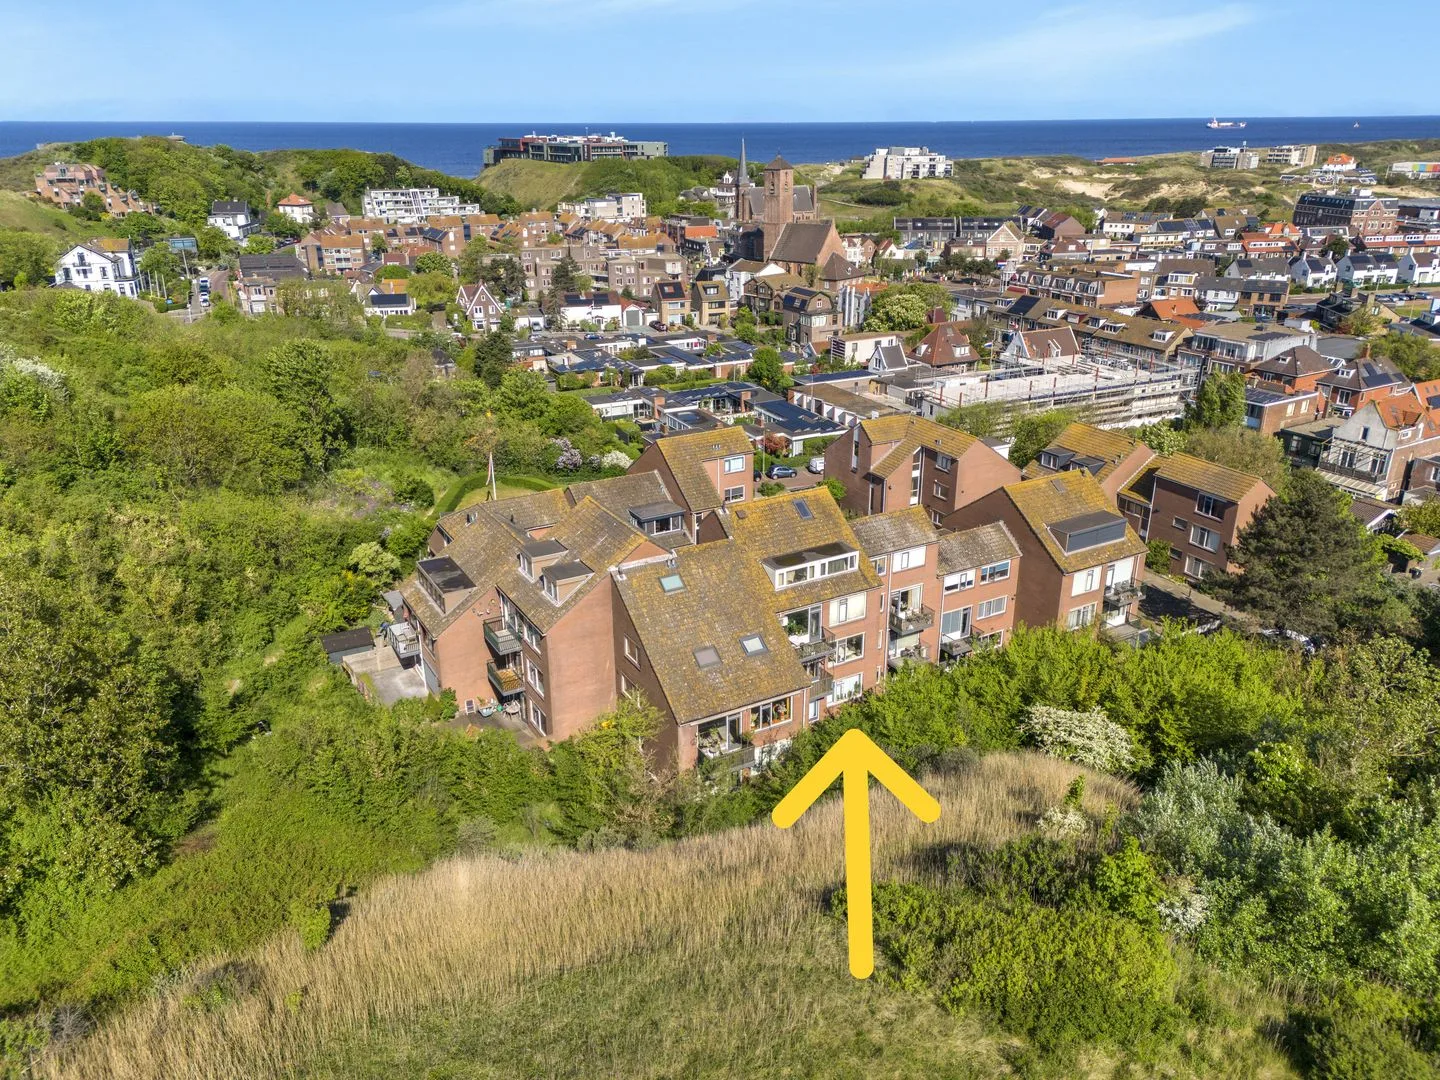
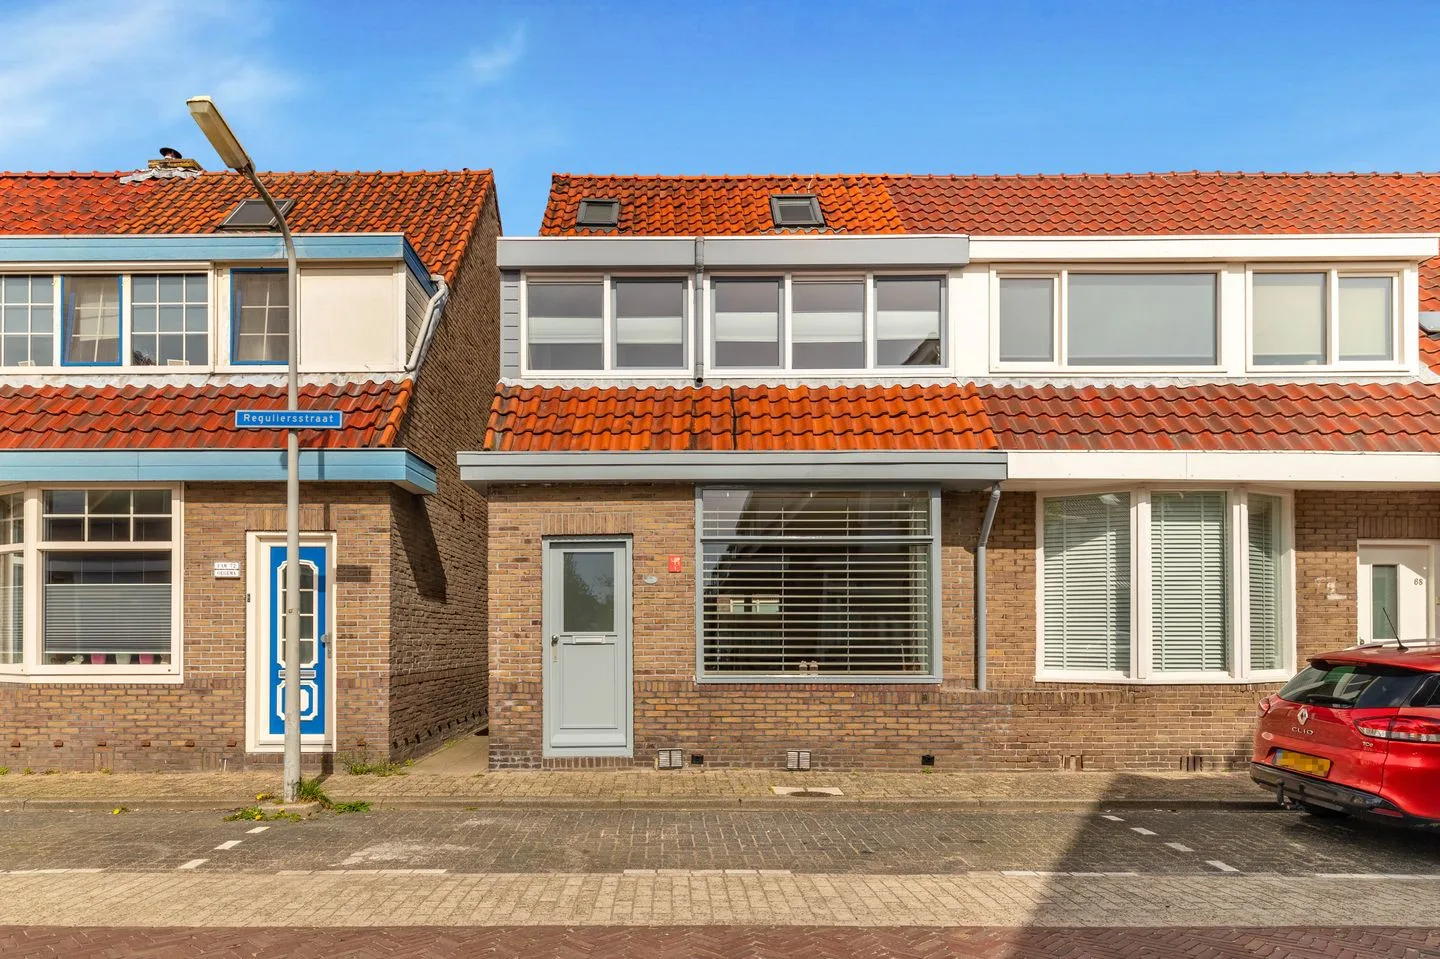
Willemsbeekweg 78 E
1971GX IJmuiden
€ 230.000 k.k.
ASave as favorite- Living area
- 31 m²
- Land area
- —
- Bedrooms
- 1
-

- Available
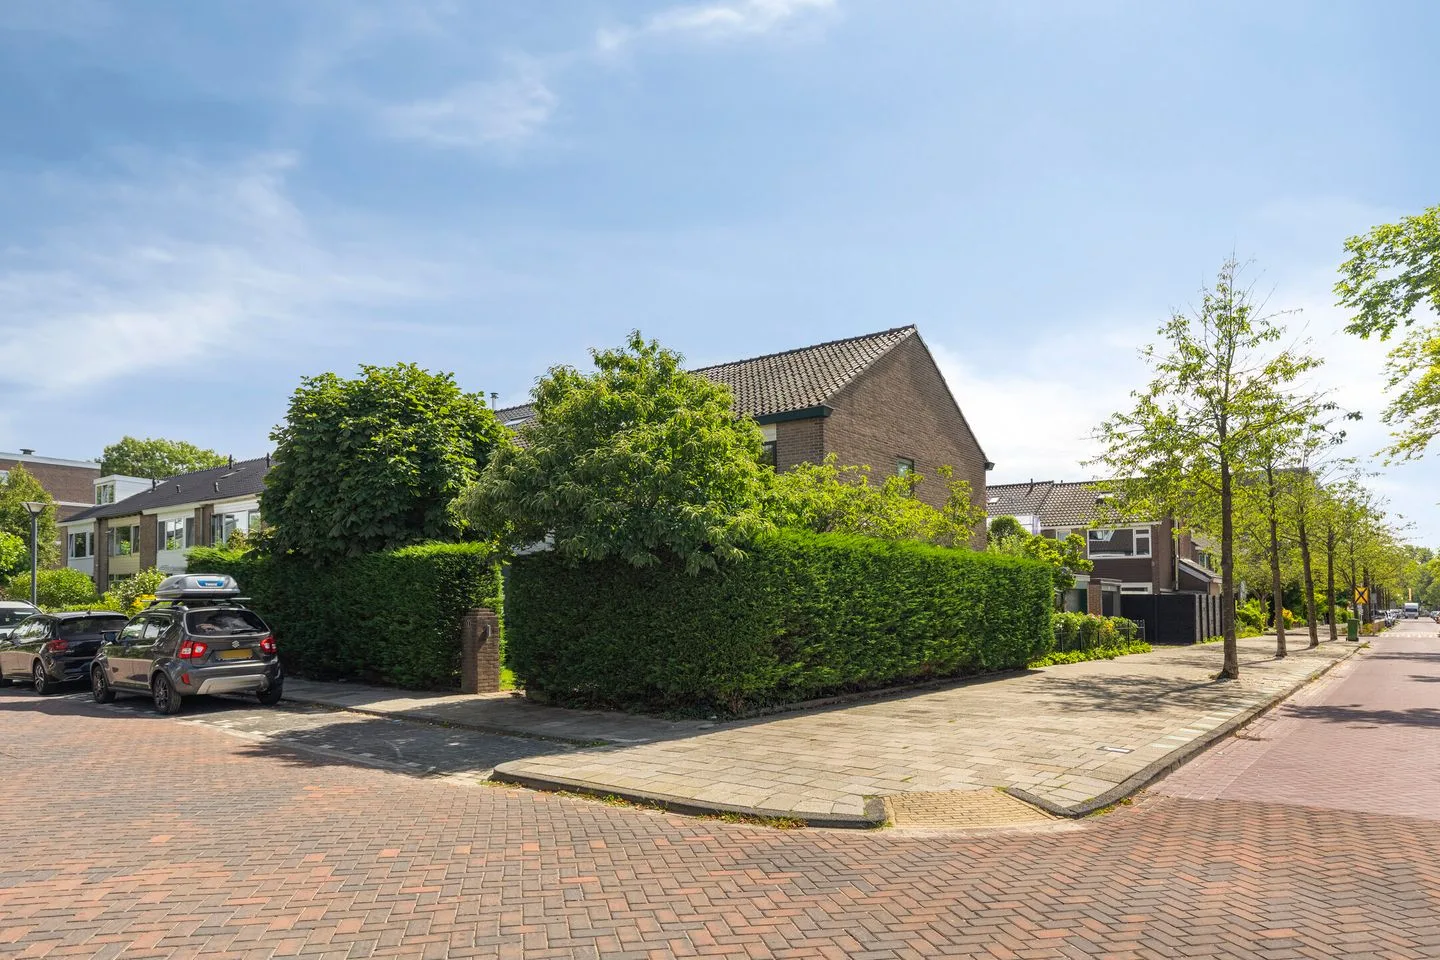
Eifel 19
1567KD Assendelft
€ 889.000 k.k.
€ 4.780/m²
A++Save as favorite- Living area
- 186 m²
- Land area
- 268 m²
- Bedrooms
- 5
-

- Available
Atlantis 8
1521NT Wormerveer
€ 950.000 k.k.
€ 4.680/m²
A++++Save as favorite- Living area
- 203 m²
- Land area
- 251 m²
- Bedrooms
- 4
-

- Available
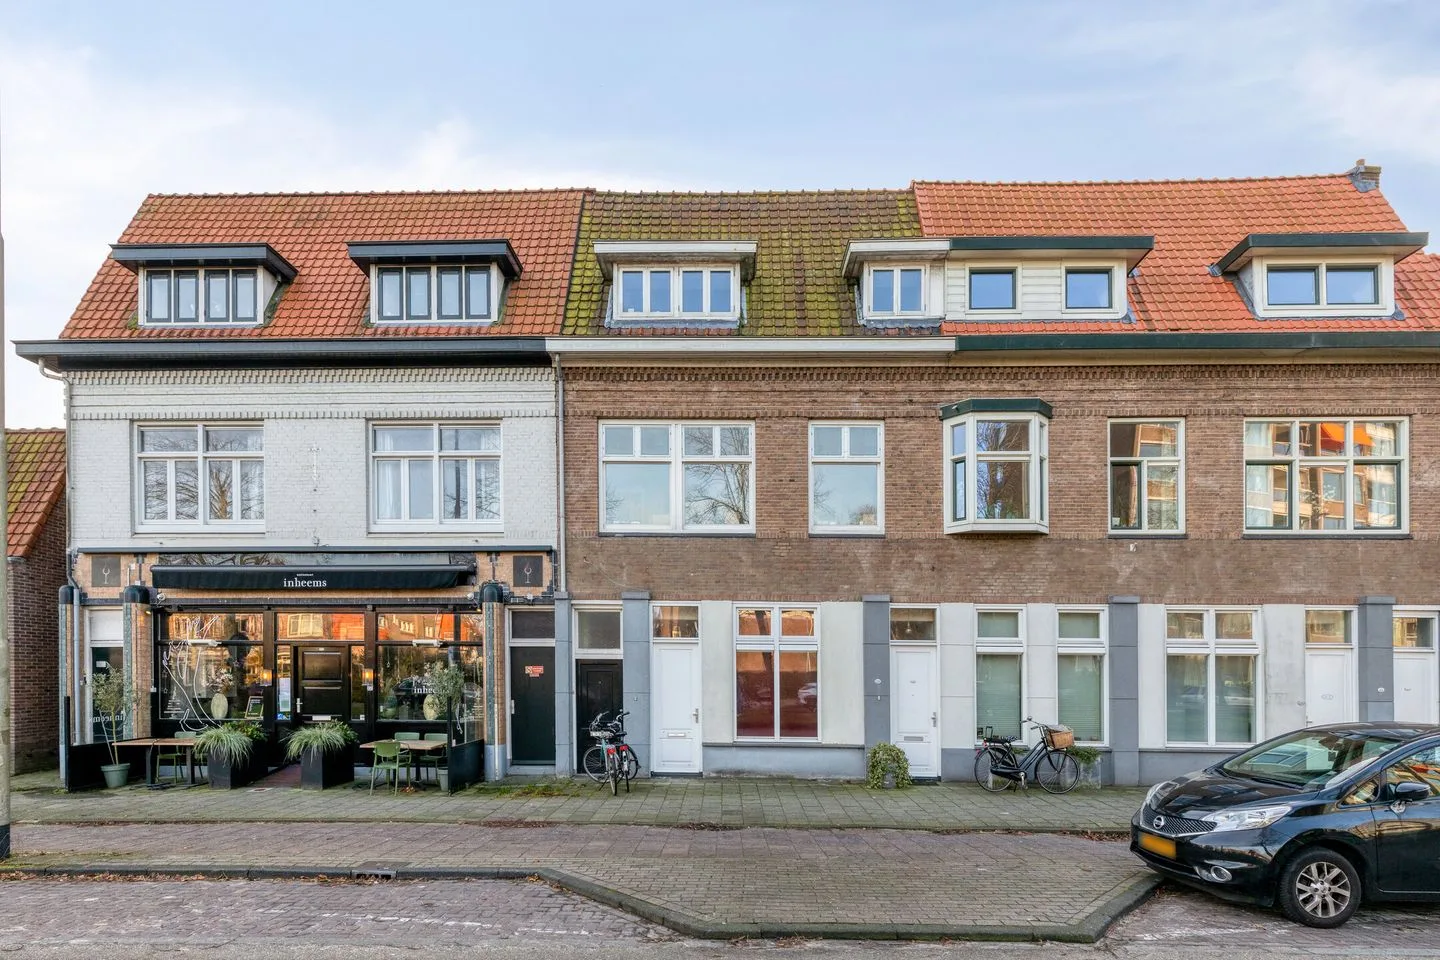
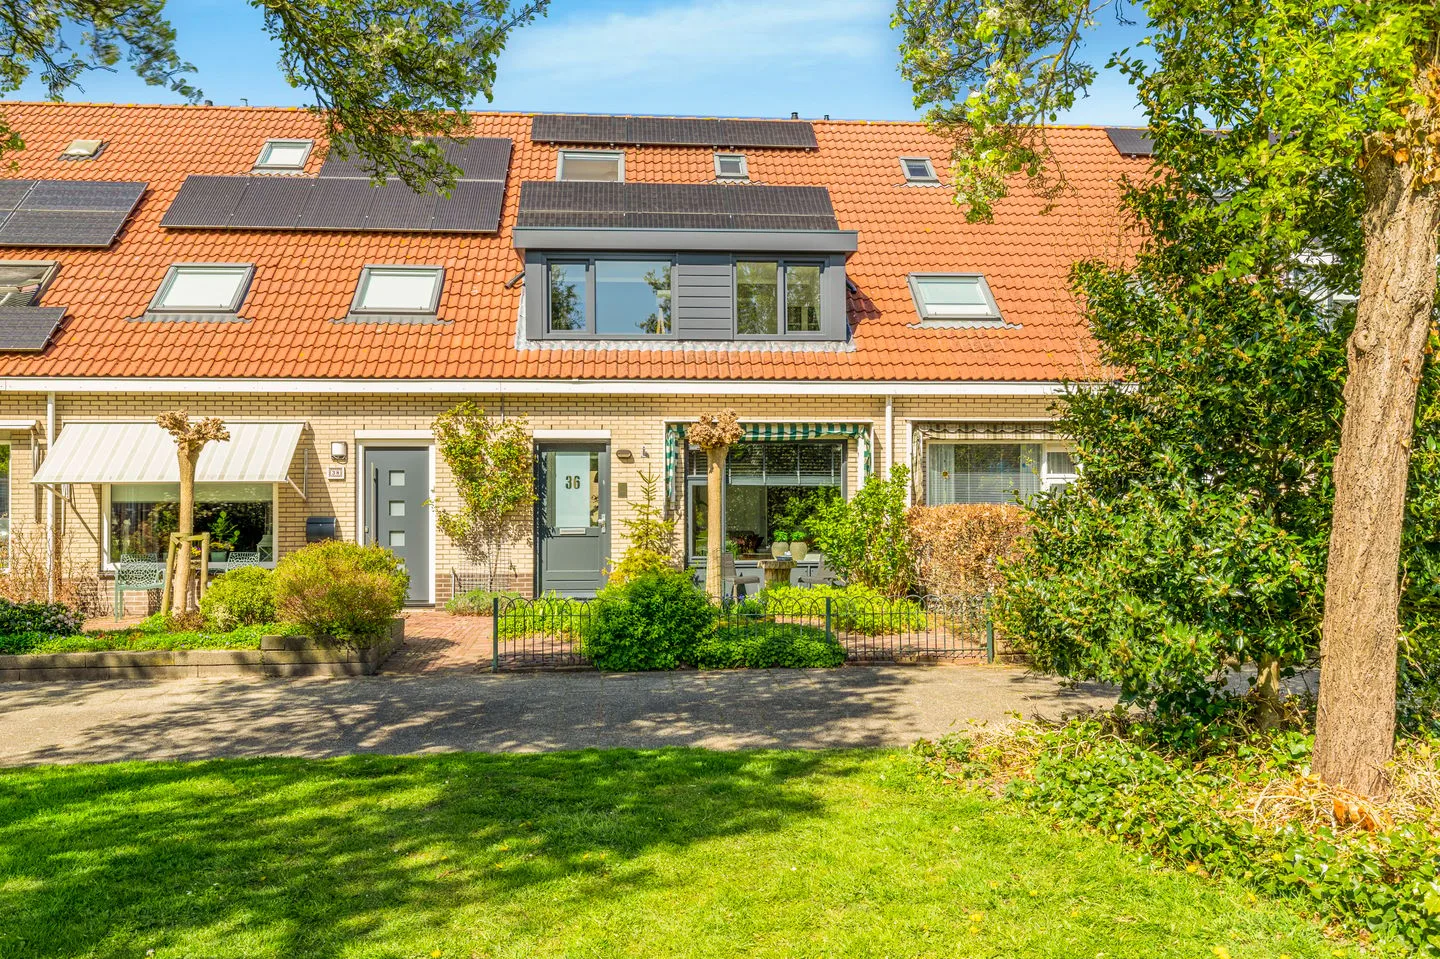
Dorpsstraat 818
1566EV Assendelft
€ 750.000 k.k.
€ 6.098/m²
A++Save as favorite- Living area
- 123 m²
- Land area
- 458 m²
- Bedrooms
- 3
Reviews (125)
Review platforms
BronscoresTotal score
125 total reviews

Funda
50 reviews on Funda

75 reviews on Google
-
Witte Ring 44
9It was a really great experience end to end. The team really helped us since the start, and super accommodating with our needs.
-
Gabi Ras
10Het team van Bert van Vulpen makelaars en hypotheken heeft ons uitstekend geholpen tijdens het verkoopproces van onze woonboerderij in Heiloo. Een aanrader voor een proffesionele begeleiding!
-
Zaandammerstraat 30
9Door hun deskundigheid geeft Bert van Vulpen een goede begeleiding door het hele verkoopproces. De verkoopkosten waren marktconform.
-
Maudisa Nooitmeer
10Translated by AII am super happy with Bert van Vulpen! Again, a really nice collaboration. Every step was clearly discussed with me, which was very pleasant. I felt completely at ease and it felt familiar from the beginning. Definitely a recommendation!
-
Warmoezierslaan 32
10Translated by AIThe team of Bert van Vulpen real estate and mortgages has helped us excellently during the sale process of our house. A recommendation for a professional guidance!
-
Wisselwachter 37
9Translated by AII am super happy with Bert van Vulpen! Again, a really nice collaboration. Every step was clearly discussed with me, which was very pleasant. I felt completely at ease and it felt familiar from the beginning. Definitely a recommendation!
-
Margriet van Dongen
10Translated by AIToday exactly six months ago our journey began: we had seen a very nice apartment right on the Zaan. Crucial to our very successful journey was the involvement of the office of Bert van Vulpen Makelaars en Hypotheken Krommenie. First, we had our financial possibilities mapped out by mortgage advisor Erik Dalenberg. So when after the viewing, which was accompanied by Maarten van Ruler, we were still enthusiastic, we could immediately make the right offer which was honored and 2 days after viewing we were the proud owners of our dream apartment. Denise van der Heijden then ensured good guidance and a very smooth sale of our own home: within 14 days after our house came on Funda we had reached an agreement with the new residents. At this moment times are uncertain, but if you switch to the right party, a lot is possible. In short: do you also want an purchase or sale trajectory without worries? I wholeheartedly recommend Bert van Vulpen Makelaars en Hypotheken to you!
-
Lisdoddelaan 37
10Translated by AIEverything went smoothly and as expected. Neat and professional, and they keep you well informed of all the matters at play.
-
Speenkruidlaan 2
10Wij verkopen niet vaak een woning terwijl de makelaar daar dagelijks mee bezig is. Verwachtingsmanagement naar de verkoper is daarin een geruster gevoel en dat zou iets meer aandacht mogen
-
oooooooo uuuuuuuu
10Uitstekend geholpen en begeleid bij de verkoop van mijn rijtjeshuis in Krommenie. Makelaar goed op de hoogte van de eerdere verkopen in dezelfde buurt en gaf goed advies. Binnen 12 dagen waarvan 3 kijkdagen was het huis verkocht. Ben erg tevreden over de snelle afhandeling. Puck Heikens.
-
Sindy Klooster
10Ze gaan door het vuur voor je. Top team! Heel erg fijne geruststellende samenwerking.
-
Bep Geilvoet
10Translated by AIVery satisfied with the communication and handling
-
Renessestraat 20
10Translated by AINice personal contact. When you call, you don't have to say which house it's about, they know immediately who you are. Gives a friendly feeling
-
Vestaplein 20
9Translated by AIThe service was excellent from start to finish. An appointment for the sale of the property was quickly scheduled, and the entire process proceeded smoothly and correctly. Both during and after the sale we could rely on a highly professional and customer-oriented service of high level. Thanks.
-
Bemster Gul
10Translated by AIFrom the very first moment, I have been incredibly well supported by the real estate agency, but three people in particular I would like to thank. Anika van Wijk (New Build) Anika has helped me fantastically with making important choices regarding the new build house. Her patience, involvement and understanding made sure that I felt heard and supported throughout the entire process. She always took the time to explain everything clearly and thought with me at every moment. Muhsin Aslan (Mortgage Advisor) Muhsin is really a top performer. He looked with me at the best financial choices and guided me through the entire process. His expertise, calmness and clear explanations gave me a lot of confidence. Even up to the last phase at the notary, he was ready with advice and support. Thanks to him everything felt clear and achievable. Rienk de Jong Rienk really deserves a special mention. His perseverance is admirable. He looked everything up in detail for me, always clearly connected back and thought from solutions. His patience, dedication and perseverance have made a huge contribution to the success of this process. Thanks to these three top performers, I was able to buy my dream home. I am incredibly grateful to them all for their dedication, professionalism and involvement. A real estate agency that I would definitely recommend to everyone! Greetings Soenita.
-
Florian Stallinga
10Translated by AIWe recently bought our house in Uitgeest with the help of Maarten (and a bit from Famke), and we can honestly say that we couldn't have wished for a better real estate agent. From the first contact, it immediately felt familiar. Maarten took ample time to understand our wishes and concerns, and thought in a nice, honest way along with us. No question was too much. Also during the viewings you could notice his professional knowledge and experience: he pointed out things we ourselves would never have thought of, and gave advice that was really in our interest. Thanks to his calmness, transparency and humor, the whole process remained surprisingly relaxed, while it was still a thrilling step. It really feels as if he is standing next to you instead of opposite you. We are extremely grateful to Maarten for his dedication and personal approach. We would definitely recommend him to anyone looking for a reliable, involved and professionally competent real estate agent.
-
len van der Hoeven
10Translated by AIWe have experienced the cooperation with the staff of Bert van Vulpen as very involved and personal. The lines are short and there was a lot of understanding and support when things went differently, such as when a buyer could not get the financing arranged. Then you really come to know the commitment of these people. Therefore, we would like to warmly thank Denise our sales agent and Erik van Dalen our mortgage advisor and the team at the office Simone and Nienke et al. for that. We therefore wholeheartedly recommend Bert van Vulpen.
-
Priscella Kroone
10Translated by AIVery well assisted by Bert van Vulpen! Both with the sale (Denise), purchase (Maarten) and mortgage (Muhsin). Nice contact with the entire team.
-
Kruisstraat 14
10Translated by AIThe contact was very good. The guidance felt very personal, relaxed and careful. Top!
-
Agavestraat 27
10Translated by AIVery well assisted by Bert van Vulpen! Both with the sale (Denise), purchase (Maarten) and mortgage (Muhsin). Nice contact with the entire team.