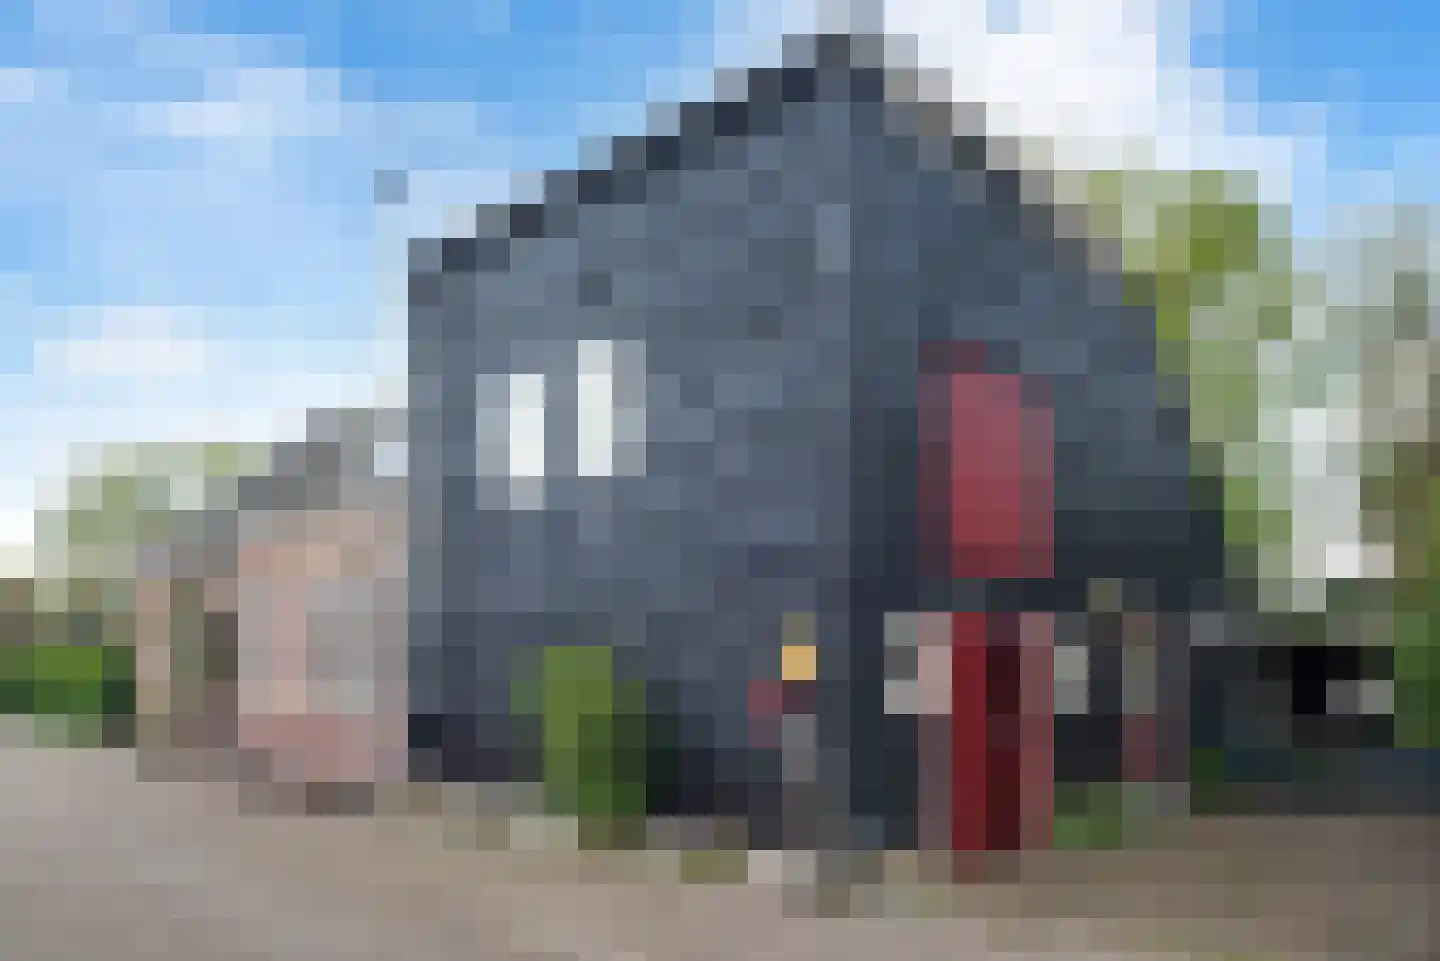
- Available
Bakkersstraat 39
1525PV Westknollendam
€ 489.000 k.k.
€ 3.850/m²
- Living area
- 127 m²
- Land area
- 156 m²
- Bedrooms
- 5
Searching in 10 houses in Westknollendam
Type to search. Use arrow down and arrow up to navigate through results and press Enter to open.
Hidden search suggestions.
View current properties in Westknollendam or search targeted on street, postal code and property characteristics.
View the current housing stock in Westknollendam and quickly filter by price, living area, rooms and more. There are currently 10 houses in this place within our selection.
1525PV Westknollendam
€ 489.000 k.k.
€ 3.850/m²
1525PC Westknollendam
€ 335.000 k.k.
€ 5.678/m²
1525PP Westknollendam
€ 745.000 k.k.
€ 4.934/m²
1525RK Westknollendam
€ 1.350.000 k.k.
€ 8.084/m²
1525PV Westknollendam
€ 500.000 k.k.
€ 3.937/m²
1525PR Westknollendam
€ 789.500
€ 7.113/m²
1525PE Westknollendam
€ 550.000 k.k.
€ 4.074/m²
1525PD Westknollendam
€ 400.000 k.k.
€ 3.149/m²
1525PR Westknollendam
€ 450.000 k.k.
€ 4.736/m²
1525PL Westknollendam
€ 745.000 k.k.
€ 3.840/m²
Get free quotes from real estate agents with local market knowledge. Compare more than 75 real estate agents in Westknollendam.
Selling a home in Westknollendam? Compare all real estate agents in Westknollendam or view the top 10 real estate agents in Westknollendam for extra context for your choice.
Real estate agents make sharper offers when they know you're comparing — ask for quotes for sale or purchase.
Practical answers about housing supply, sales and comparing real estate agents in Westknollendam.
The costs of a real estate agent in Westknollendam depend on commission, setup costs, property presentation and the chosen service. Compare the 75 real estate agents in Westknollendam via the real estate agent page and request multiple quotes to compare rates and approach well.
Within our selection, we are currently showing 10 houses in Westknollendam. View also the sold houses in Westknollendam to compare the current offering with recent transactions.
Take into account not only price and living area but also maintenance, energy label, location, outdoor space and sales status. This way you compare houses in Westknollendam on more than just the asking price.
A local real estate agent knows the neighborhoods, recent transactions and demand in Westknollendam. By comparing 75 real estate agents in the region you get a better insight into prices, sales strategy and expected yield; the top 10 in Westknollendam provides a useful starting point.
Yes, when making a sales plan, a valuation in Westknollendam is wise. You gain insight into a realistic asking price and can then compare offers from real estate agents specifically.
View current location data on residents, WOZ development, housing stock, energy consumption, business activity and safety in Westknollendam. In 2025 were there 577 residents. The average WOZ value in 2025 is EUR 430.975.
These figures help to better assess and compare the housing stock in Westknollendam with recent sold homes. Orient yourself then on suitable top real estate agents in Westknollendam for sales advice in this region.
Residents
577
Last year: 2025
Average WOZ
EUR 430.975
Last year: 2025
Average income per person.
EUR 34.948
Source: AllNumbers
Crimes (current year)
20
Total registered
| Year | Residents |
|---|---|
| 2021 | 565 |
| 2022 | 585 |
| 2023 | 560 |
| 2024 | 553 |
| 2025 | 577 |
| Year | Average WOZ |
|---|---|
| 2021 | EUR 318.000 |
| 2022 | EUR 347.553 |
| 2023 | EUR 396.936 |
| 2024 | EUR 431.388 |
| 2025 | EUR 430.975 |
Hoger
110
Praktisch
100
Middelbaar
160
Europa
47
Nederland
467
Buiten Europa
60
Label C
100
Label B
45
Label A
40
Label G
38
Label D
26
Label A+
17
Label A++
17
Label F
13
Label E
11
Label A+++
7
Label A+++++
2
Label A++++
1
| Year | Gas (m3) | Electricity (kWh) |
|---|---|---|
| 2020 | 1.408 | 2.998 |
| 2021 | 1.612 | 3.021 |
| 2022 | 1.229 | 2.781 |
| 2023 | 1.086 | 2.679 |
| 2024 | 1.048 | 2.761 |
Hoekwoning
Gas: 1.071 • Electricity: 2.572
Huurwoning
Gas: 1.023 • Electricity: 1.979
Koopwoning
Gas: 1.120 • Electricity: 3.076
Appartement
Gas: 733 • Electricity: 1.681
Tussenwoning
Gas: 987 • Electricity: 2.445
Vrijstaande woning
Gas: 1.232 • Electricity: 3.480
Twee-onder-één-kap woning
Gas: 1.239 • Electricity: 3.113
Total number of company establishments: 185
| Period | Crimes |
|---|---|
| jan 2025 | 0 |
| jan 2026 | 5 |
| jul 2025 | 1 |
| jun 2025 | 4 |
| mei 2025 | 3 |
| mrt 2025 | 1 |
| nov 2024 | 2 |
| nov 2025 | 1 |
| okt 2024 | 3 |
| okt 2025 | 0 |
| sep 2024 | 5 |
| sep 2025 | 3 |
These figures give an indicative picture of safety trends in the living environment of Westknollendam.
Short answers based on current local statistics, handy for a quick comparison of the living environment.
Westknollendam telt in 2025 ongeveer 577 inwoners.
De gemiddelde WOZ-waarde in Westknollendam is in 2025 circa € 430.975.
Het gemiddelde inkomen per inwoner in Westknollendam ligt rond € 34.948 per jaar.
Voor het huidige jaar gaat het om ongeveer 20 geregistreerde misdrijven. Gebruik deze cijfers als indicatie en vergelijk trends per periode.
In Westknollendam komt vooral "Tussenwoningen" veel voor, met ongeveer 77 woningen.