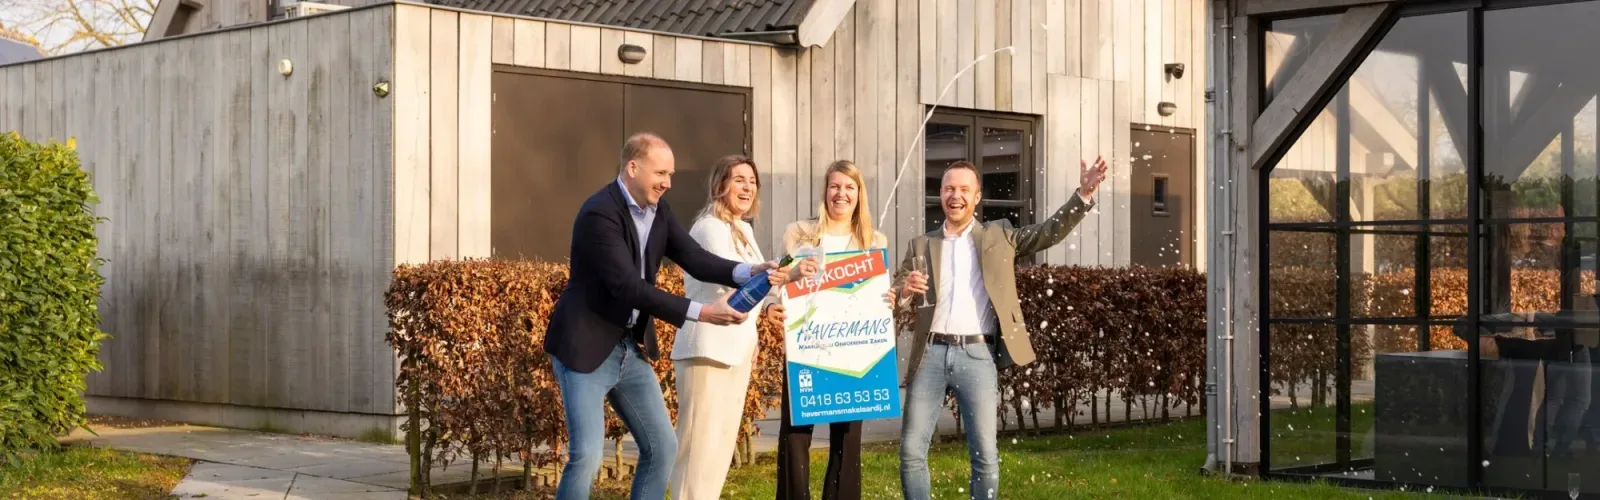

Havermans Real Estate has been active for more than a quarter of a century in the region with expertise and reliable service. We are active in Kerkdriel, Maasdriel, Zaltbommel, Den Bosch and the surrounding areas, where we devote ourselves with a lot of passion and professionalism to our clients. Whether it's about the sale or purchase of a home, appraisals or rental matters - we are ready for you with personal attention and business kn...
Current housing stock
-

- Available
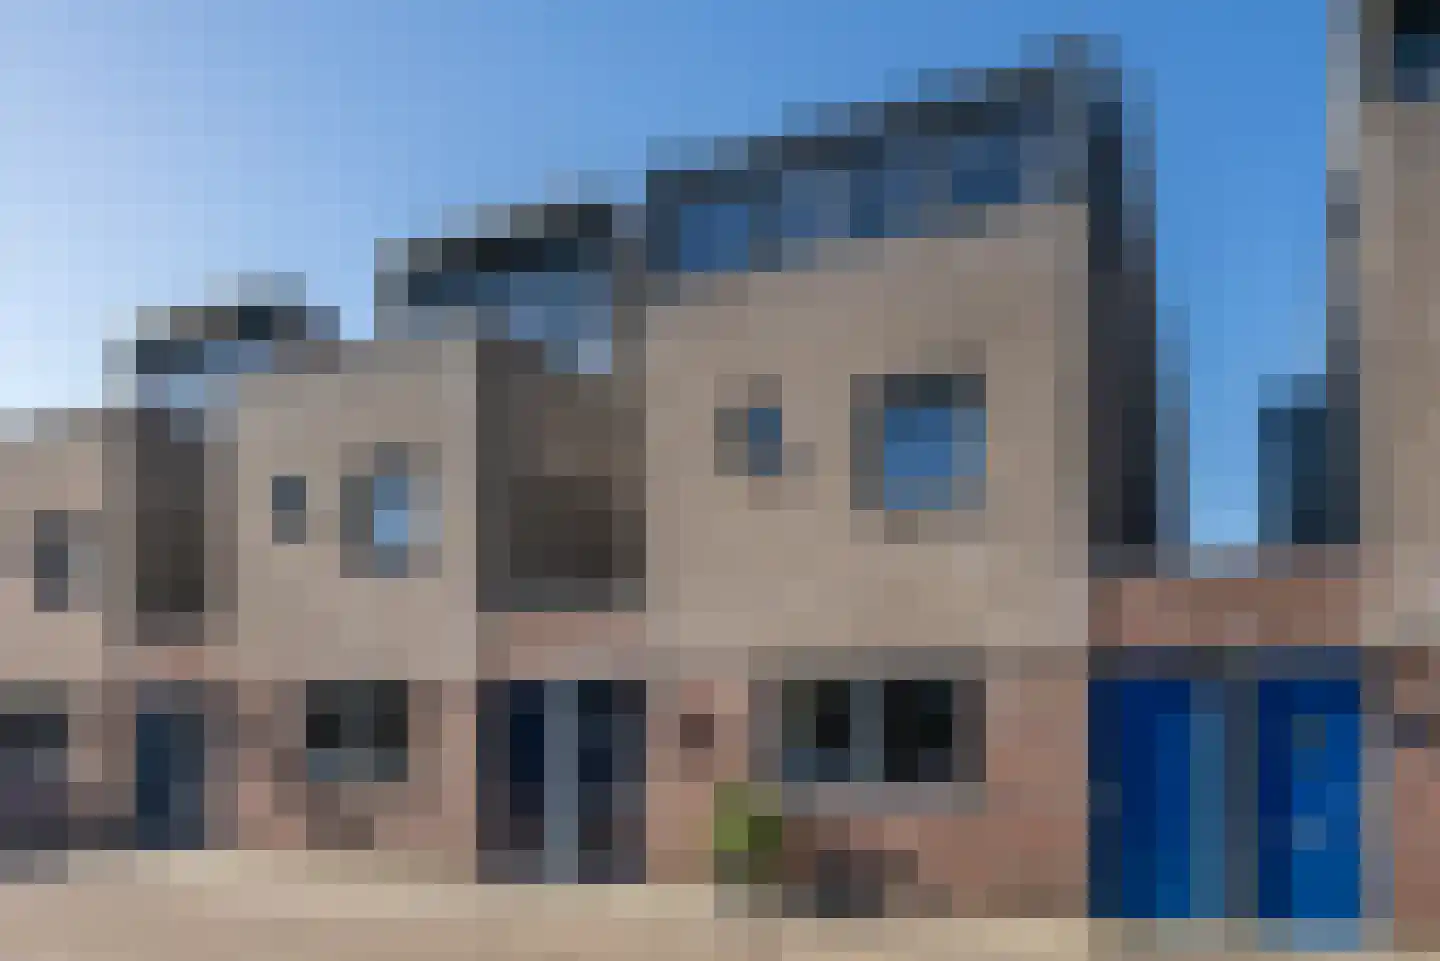
Fruithof 18
6624BL Heerewaarden
€ 435.000 k.k.
BSave as favorite- Living area
- 109 m²
- Land area
- 245 m²
- Bedrooms
- 4
-

- Available
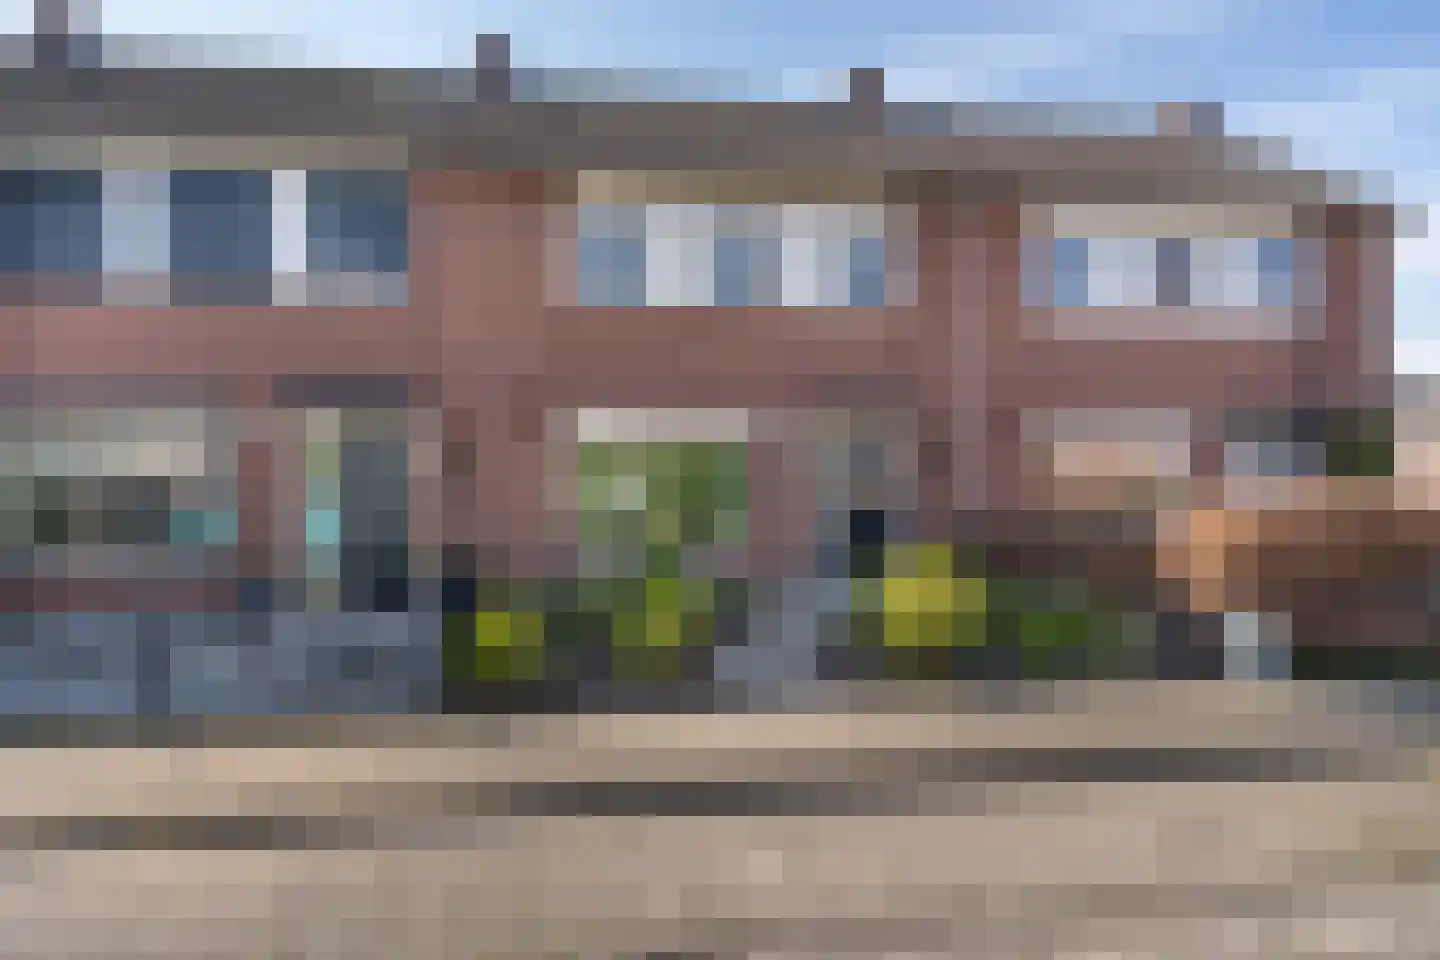
Oud Munsterstraat 9
5331AR Kerkdriel
€ 519.000 k.k.
DSave as favorite- Living area
- 110 m²
- Land area
- 259 m²
- Bedrooms
- 3
-

- Available
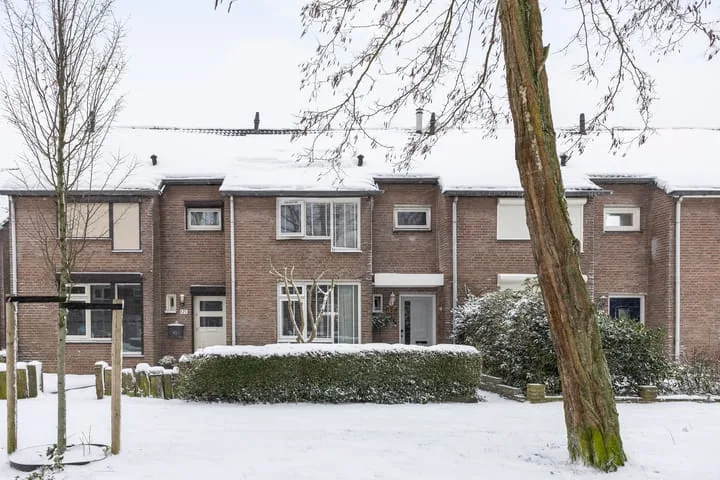
Cederstraat 42
5213EK 's-Hertogenbosch
€ 429.000 k.k.
DSave as favorite- Living area
- 89 m²
- Land area
- 72 m²
- Bedrooms
- 2
-

- Available
Koningin Wilhelminaweg 34
5301GJ Zaltbommel
€ 750.000 k.k.
€ 4.545/m²
DSave as favorite- Living area
- 165 m²
- Land area
- 300 m²
- Bedrooms
- 4
-

- Available
Geerhofstraat 36
5327AL Hurwenen
€ 445.000 k.k.
€ 3.938/m²
ASave as favorite- Living area
- 113 m²
- Land area
- 196 m²
- Bedrooms
- 4
-

- Available
Rietkamp 19
5311GX Gameren
€ 495.000 k.k.
€ 4.160/m²
ASave as favorite- Living area
- 119 m²
- Land area
- 230 m²
- Bedrooms
- 4
Reviews (172)
Review platforms
BronscoresTotal score
172 total reviews

Funda
80 reviews on Funda

92 reviews on Google
-
Maasboulevard 215
10Er was meteen al een heel prettig intake gesprek. Kwam met goeie tips en begeleid je van a tot z. Ik kan niet anders zeggen dan om dit kantoor iedereen aan te raden.
-
de Bogerd 4
10het contact verliep heel goed, reageerde heel snel en accuraat. Professioneel en deskundig, ook wat we er eigenlijk van verwacht hadden is uitgekomen.
-
Hoveniersland 26
10Super super tevreden. Soms miste ik wat informatie in het proces maar bij vragen meteen ook weer reactie!
-
Argo van den Bogert
10Servicegericht, komt afspraken na, goede onderhandelingstactiek, sterk in het maximale doel voor jou als verkoper te bereiken, prettige persoonlijke benadering, duidelijke begeleidingsstappen in het verkoopproces.
-
Dorien Kortooms
10Super super tevreden. Soms miste ik wat informatie in het proces maar bij vragen meteen ook weer reactie!
-
Weth vd Schansstraat 18
10Servicegericht, komt afspraken na, goede onderhandelingstactiek, sterk in het maximale doel voor jou als verkoper te bereiken, prettige persoonlijke benadering, duidelijke begeleidingsstappen in het verkoopproces.
-
Schout van Doernestraat 12
9Translated by AIExpert, personal service, short lines, quick reaction and actions. As both a buyer's and seller's agent once again an excellent experience with Remco and colleagues.
-
Gasthuisstraat 7
10Translated by AIWell accessible both online and by phone, with business sense. Pleasant way of communicating and interacting!
-
het Koggeplein 1
10Translated by AIThe contact with the real estate agency Havermans (Remco) went great. Short lines and clear. We experienced this real estate agent as highly knowledgeable. Knew how to determine a good price for the house that was sold. In our family. This real estate agent has already sold multiple houses. We recommend everyone who wants to sell their house, to take Havermans real estate agency B.V. for the sale.
-
Diana van Holland
10 -
Leon Van Genderen
10Translated by AIFine expert real estate agent. Easy to reach, the in-house service is also very helpful. Moreover, the guidance was pleasant and very transparent. In short, a fine experience.
-
Marijne Broekmeulen
10Translated by AIWe are extremely satisfied with the cooperation with this real estate agent! From the first contact they were quick, easy to reach and always willing to think along. I could always call with questions and received clear and honest advice every time. During the entire sales process, I felt they were there for me and my interests as a seller were central. That gave a lot of trust and peace of mind. Everything was professionally and smoothly arranged. In short: a very nice experience and I would definitely recommend this real estate agent!
-
Edelmanstraat 59
9Translated by AIHavermans has a professional approach. Short lines and frequent contact about the progress of the sale. Also, they are always reachable for questions. In short, a very nice experience!
-
Kromsteeg 29 a
10Translated by AIWe are extremely satisfied with the cooperation with this real estate agent! From the first contact they were quick, easy to reach and always willing to think along. I could always call with questions and received clear and honest advice every time. During the entire sales process, I felt they were there for me and my interests as a seller were central. That gave a lot of trust and peace of mind. Everything was professionally and smoothly arranged. In short: a very nice experience and I would definitely recommend this...
-
Kazemat 44
10Translated by AIMy real estate agent is a very nice man who acted quickly in searching for and negotiating my purchased house. I am very satisfied with him.
-
Fiep Westendorplaan 84
10Translated by AIMy real estate agent is a very nice man who acted quickly in searching and negotiating for my purchased house. I am very satisfied with him.
-
Fazantstraat 20
10Wij waren zeer tevreden met Havermans Makelaardij B.V. Ze zijn zeer deskundig en goed bereikbaar . Remco heeft ons heel goed bijgestaan. Als we vragen hadden reageerde hij zeer snel en zo nodig kwam hij bij ons langs. Ook hebben ze fijne mensen die de foto's verzorgen voor de brochure . Kortom een hele prettige fijne samenwerking, en we raden ook zeker Havermans Makelaardij B.V. aan mocht u uw huis willen verkopen.
-
Tinbergenplantsoen 49
10Translated by AIFine expert real estate agent. Easy to reach, the in-house service is also very helpful. Moreover, the guidance was pleasant and very transparent. In short, a fine experience.
-
Henk Seepers
10Van het eerste moment contact een zeer prettige samenwerking, duidelijke uitleg en advies. Alles vrijblijvend en in goed overleg samen gewerkt. 100% tevreden.
-
Ruud Huisman
10Remco is een uitermate deskundige en open persoonlijkheid die ook buiten katoortijden bereikbaar is. Hij wist binnen rwee (!) dagen ons huis te verkopen. TOPPER .