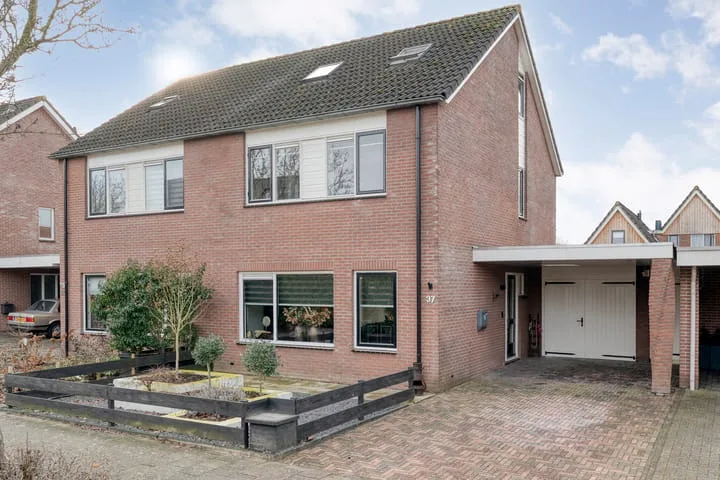
- Sold
Thorbeckestraat 3
7691AT Bergentheim
€ 285.000 k.k.
€ 2.638/m²
- Living area
- 108 m²
- Land area
- 132 m²
- Bedrooms
- 4
View 19 sold houses in Bergentheim
Type to search. Use arrow down and arrow up to navigate through results and press Enter to open.
Hidden search suggestions.
Compare sold homes in Bergentheim or view the current offering in this location directly.
On this page you will find recently sold homes in Bergentheim. Use this overview to better estimate selling prices, popular neighborhoods, and the local housing supply before you choose a real estate agent. Also view the current housing supply with 24 houses in Bergentheim.
7691AT Bergentheim
€ 285.000 k.k.
€ 2.638/m²
7691DC Bergentheim
€ 349.000 k.k.
€ 2.814/m²
7691AB Bergentheim
€ 290.000 k.k.
€ 2.636/m²
7691CE Bergentheim
€ 549.000 k.k.
€ 4.067/m²
7691BW Bergentheim
€ 275.000 k.k.
€ 2.570/m²
7691BK Bergentheim
€ 300.000 k.k.
€ 4.000/m²
7691DC Bergentheim
€ 365.000 k.k.
€ 2.664/m²
7691DA Bergentheim
€ 395.000 k.k.
€ 2.687/m²
7691CL Bergentheim
€ 649.000 k.k.
€ 5.794/m²
7691AE Bergentheim
€ 235.000 k.k.
€ 0/m²
7691BC Bergentheim
€ 639.000 k.k.
€ 2.696/m²
7691DN Bergentheim
€ 310.000 k.k.
€ 0/m²
7691BK Bergentheim
€ 200.000 k.k.
€ 3.448/m²
7691AD Bergentheim
€ 359.500 k.k.
€ 2.971/m²
7691BJ Bergentheim
€ 695.000 k.k.
€ 2.848/m²
7691PE Bergentheim
€ 150.000 k.k.
€ 3.191/m²
7691BC Bergentheim
€ 350.000 k.k.
€ 3.125/m²
7691DP Bergentheim
€ 439.000 k.k.
€ 3.006/m²
7691DC Bergentheim
€ 519.000 k.k.
€ 2.459/m²
Bekijk recente verkopen en ontvang gratis offertes van lokale verkoopmakelaars in Bergentheim.
Zelf je woning verkopen in Bergentheim? Vergelijk verkoopmakelaars in Bergentheim of bekijk de beste verkoopmakelaars in Bergentheim als referentie bij jouw keuze.
Makelaars maken scherpere voorstellen als ze weten dat je vergelijkt — vraag offertes aan voor verkoop of aankoop.
Short answers about housing prices, sold homes and comparing real estate agents in Bergentheim.
The costs of a real estate agent in Bergentheim vary per office, property type and sales approach. Therefore, compare multiple quotes and also look at the real estate agents in Bergentheim to better compare rates, presentation and local experience.
On this page we currently show 19 sold houses in Bergentheim from our selection. This helps you to better assess recent transactions and the local housing market.
Houses sold in Bergentheim give insight into asking prices, house types and neighborhoods where recent transactions have taken place. Compare this also with the current housing stock in Bergentheim to better understand the market.
You can use sold homes as a first market indication, but a local real estate agent can better take into account finishing, location, maintenance and current demand in Bergentheim.
Vergelijk makelaars in Bergentheim op lokale verkoopervaring, reviews, verwachte opbrengst, courtage en marketingaanpak. Bekijk verkoopmakelaars in Bergentheim of de top 10 makelaars in Bergentheim om snel sterke kantoren te ontdekken.
View current location data on residents, WOZ development, housing stock, energy consumption, business activity and safety in Bergentheim. In 2026 were there 3.803 residents. The average WOZ value in 2025 is EUR 337.000.
These figures help to better assess and compare the housing stock in Bergentheim with recent sold homes. Orient yourself then on suitable top real estate agents in Bergentheim for sales advice in this region.
Residents
3.803
Last year: 2026
Average WOZ
EUR 337.000
Last year: 2025
Average income per person.
EUR 28.900
Source: AllNumbers
Crimes (current year)
40
Total registered
| Year | Residents |
|---|---|
| 2021 | 3.460 |
| 2022 | 3.530 |
| 2023 | 3.570 |
| 2024 | 3.570 |
| 2025 | 3.680 |
| 2026 | 3.803 |
| Year | Average WOZ |
|---|---|
| 2021 | EUR 229.000 |
| 2022 | EUR 262.000 |
| 2023 | EUR 294.000 |
| 2024 | EUR 316.000 |
| 2025 | EUR 337.000 |
Hoger
390
Praktisch
840
Middelbaar
1.500
Europa
115
Nederland
3.455
Buiten Europa
105
Label A
351
Label C
250
Label B
242
Label F
139
Label D
110
Label G
92
Label A++++
49
Label A+++
47
Label E
43
Label A+
29
Label A++
5
Label A+++++
0
| Year | Gas (m3) | Electricity (kWh) |
|---|---|---|
| 2020 | 1.330 | 3.310 |
| 2021 | 1.620 | 3.400 |
| 2022 | 1.270 | 3.200 |
| 2023 | 1.020 | 3.090 |
| 2024 | 970 | 3.180 |
Hoekwoning
Gas: 930 • Electricity: 2.620
Huurwoning
Gas: 840 • Electricity: 2.070
Koopwoning
Gas: 1.080 • Electricity: 3.410
Appartement
Gas: 620 • Electricity: 1.950
Tussenwoning
Gas: 860 • Electricity: 2.450
Vrijstaande woning
Gas: 1.280 • Electricity: 4.000
Twee-onder-één-kap woning
Gas: 1.050 • Electricity: 3.140
Total number of company establishments: 375
| Period | Crimes |
|---|---|
| jan 2026 | 1 |
| jul 2025 | 4 |
| jun 2025 | 5 |
| mei 2025 | 5 |
| mrt 2025 | 4 |
| mrt 2026 | 3 |
| nov 2024 | 4 |
| nov 2025 | 5 |
| okt 2024 | 2 |
| okt 2025 | 0 |
| sep 2024 | 7 |
| sep 2025 | 4 |
These figures give an indicative picture of safety trends in the living environment of Bergentheim.
Short answers based on current local statistics, handy for a quick comparison of the living environment.
Bergentheim telt in 2026 ongeveer 3.803 inwoners.
De gemiddelde WOZ-waarde in Bergentheim is in 2025 circa € 337.000.
Het gemiddelde inkomen per inwoner in Bergentheim ligt rond € 28.900 per jaar.
Voor het huidige jaar gaat het om ongeveer 40 geregistreerde misdrijven. Gebruik deze cijfers als indicatie en vergelijk trends per periode.
In Bergentheim komt vooral "Vrijstaande woningen" veel voor, met ongeveer 442 woningen.