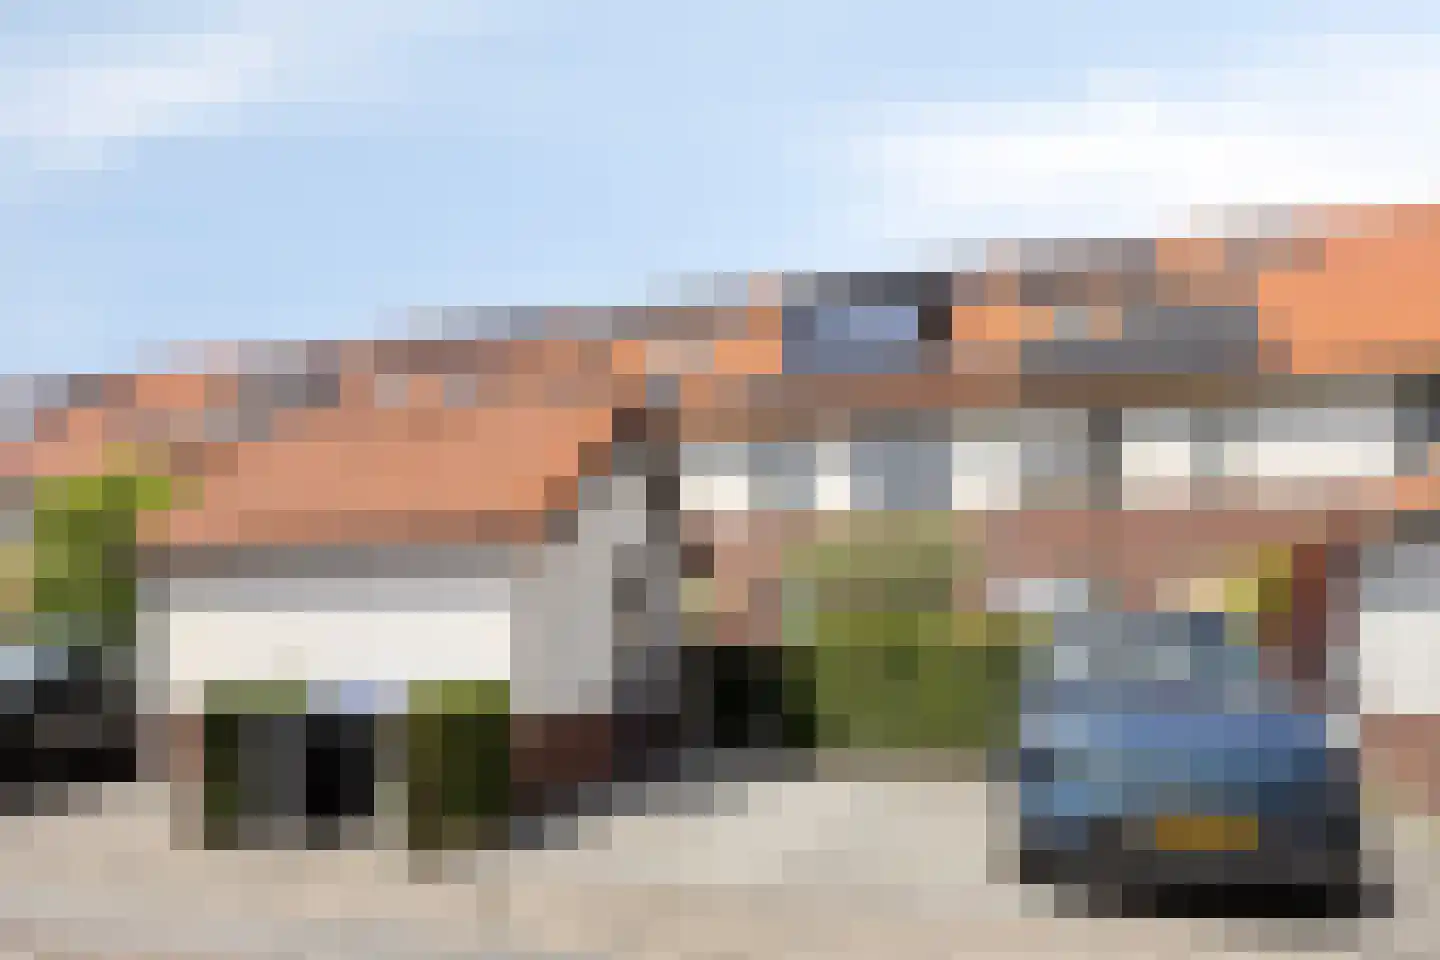
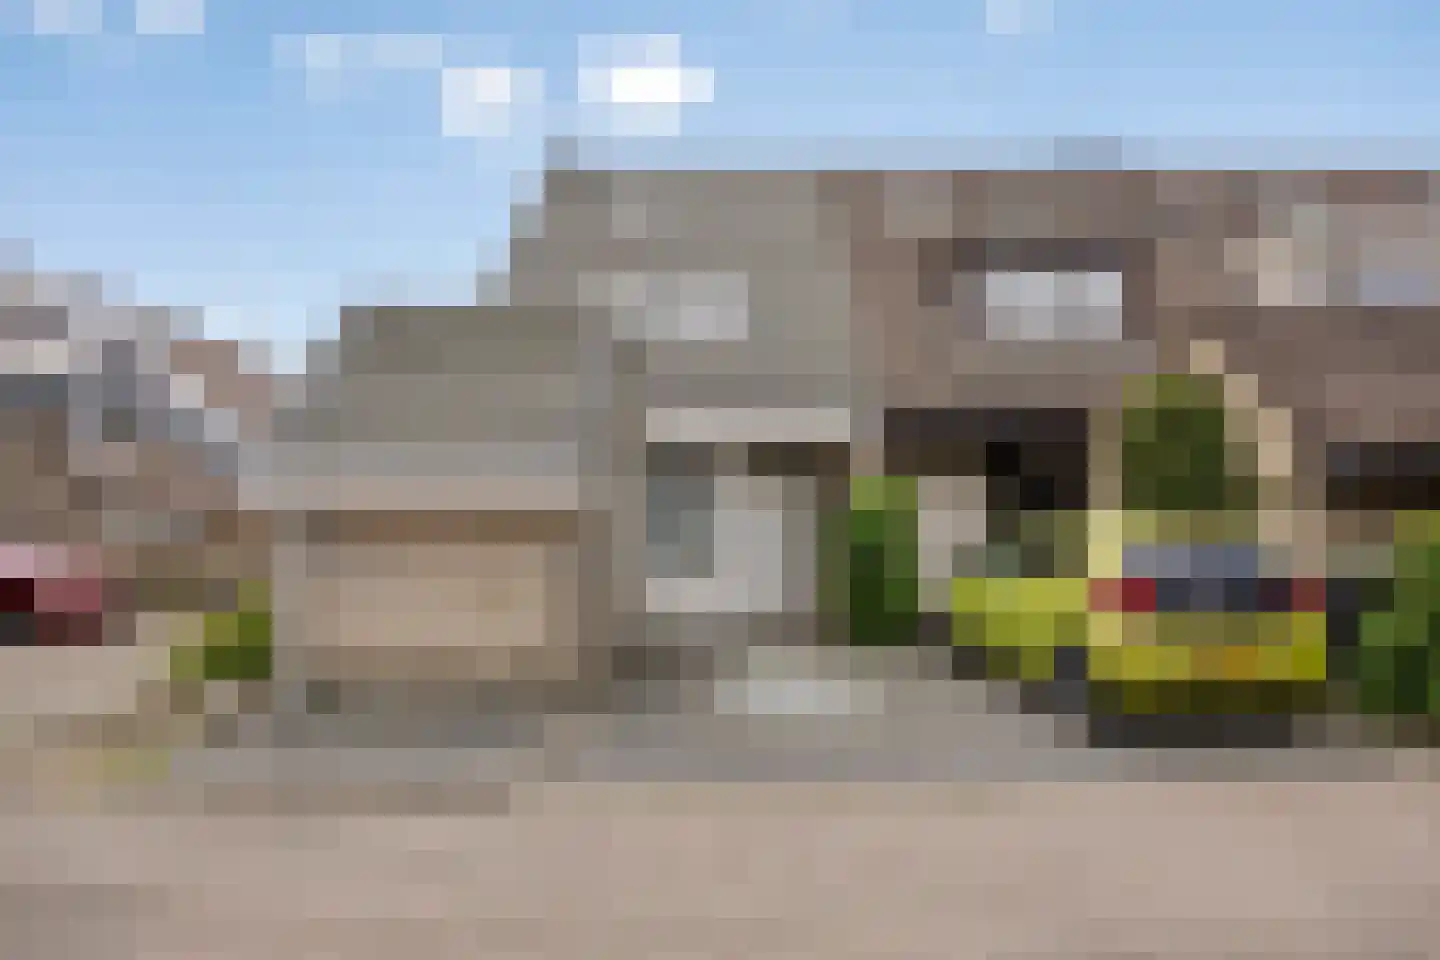
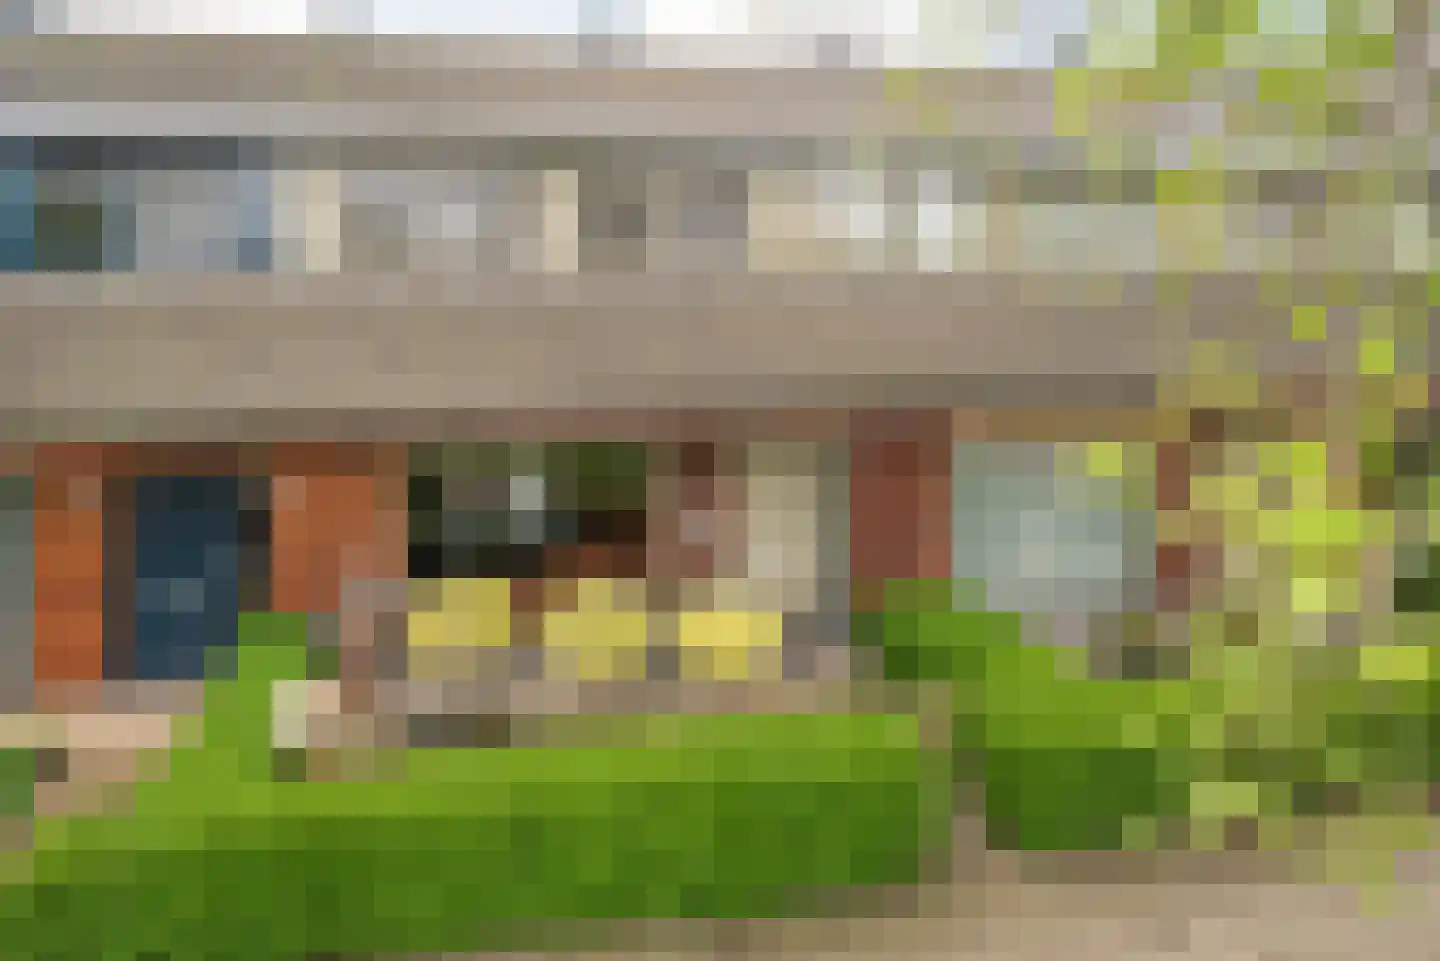
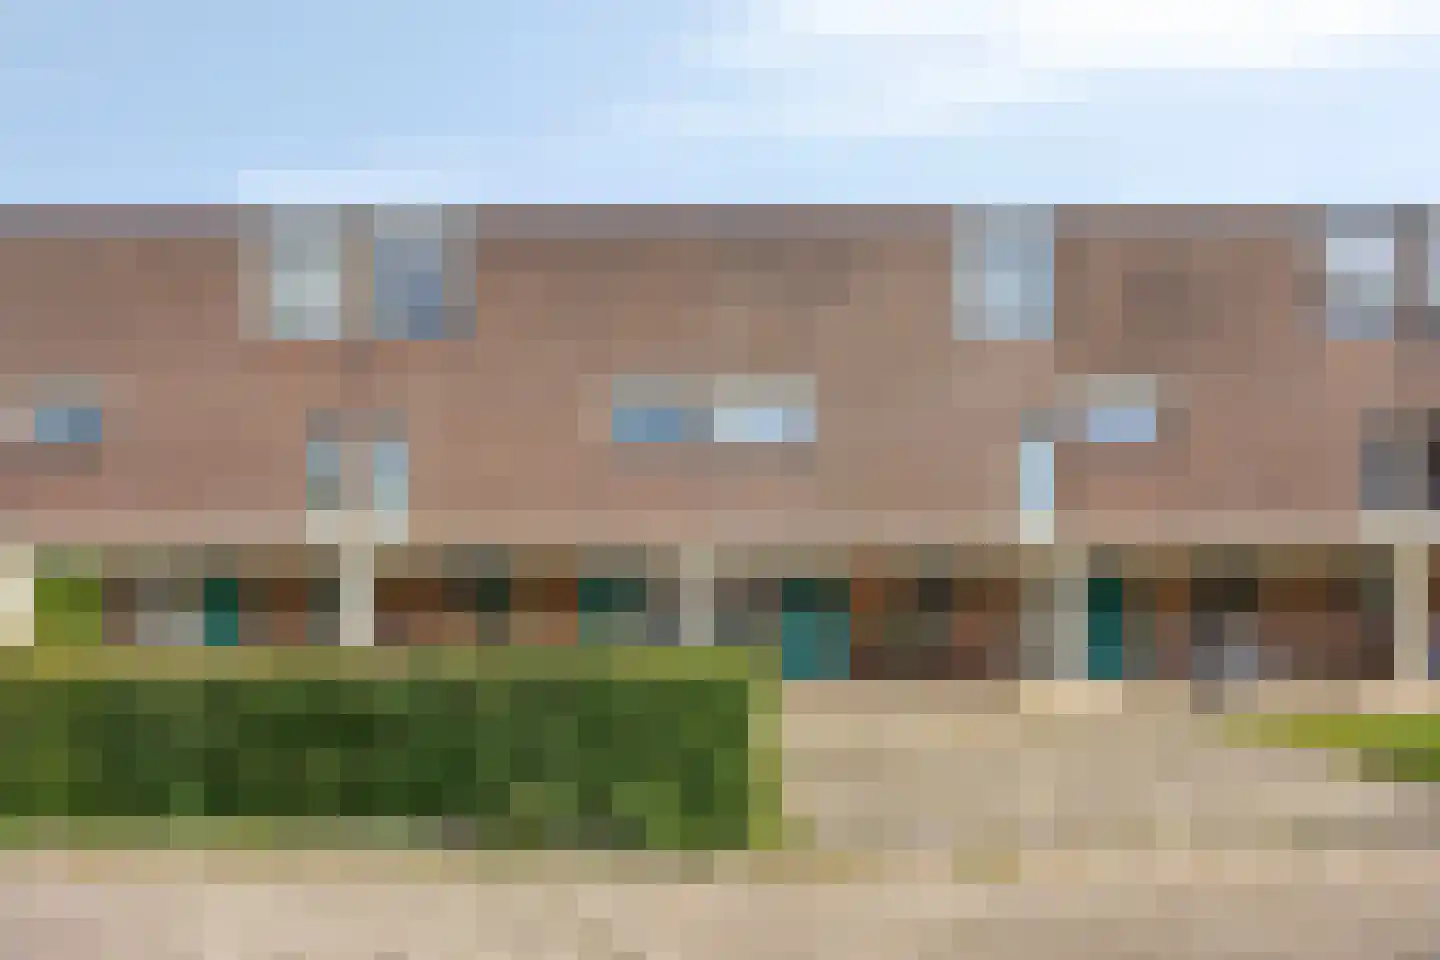
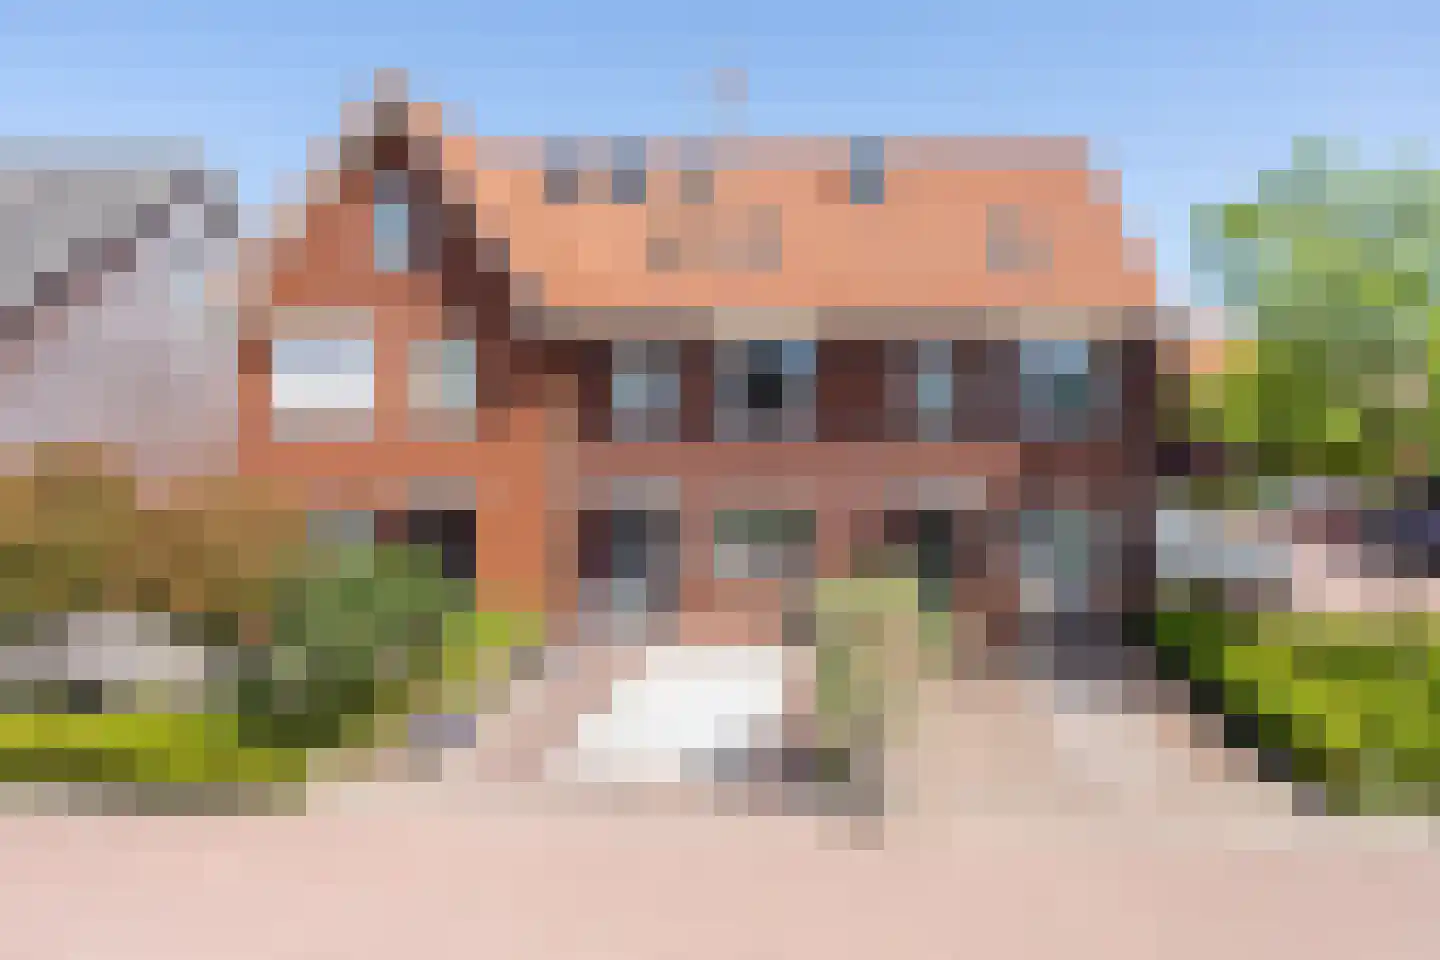
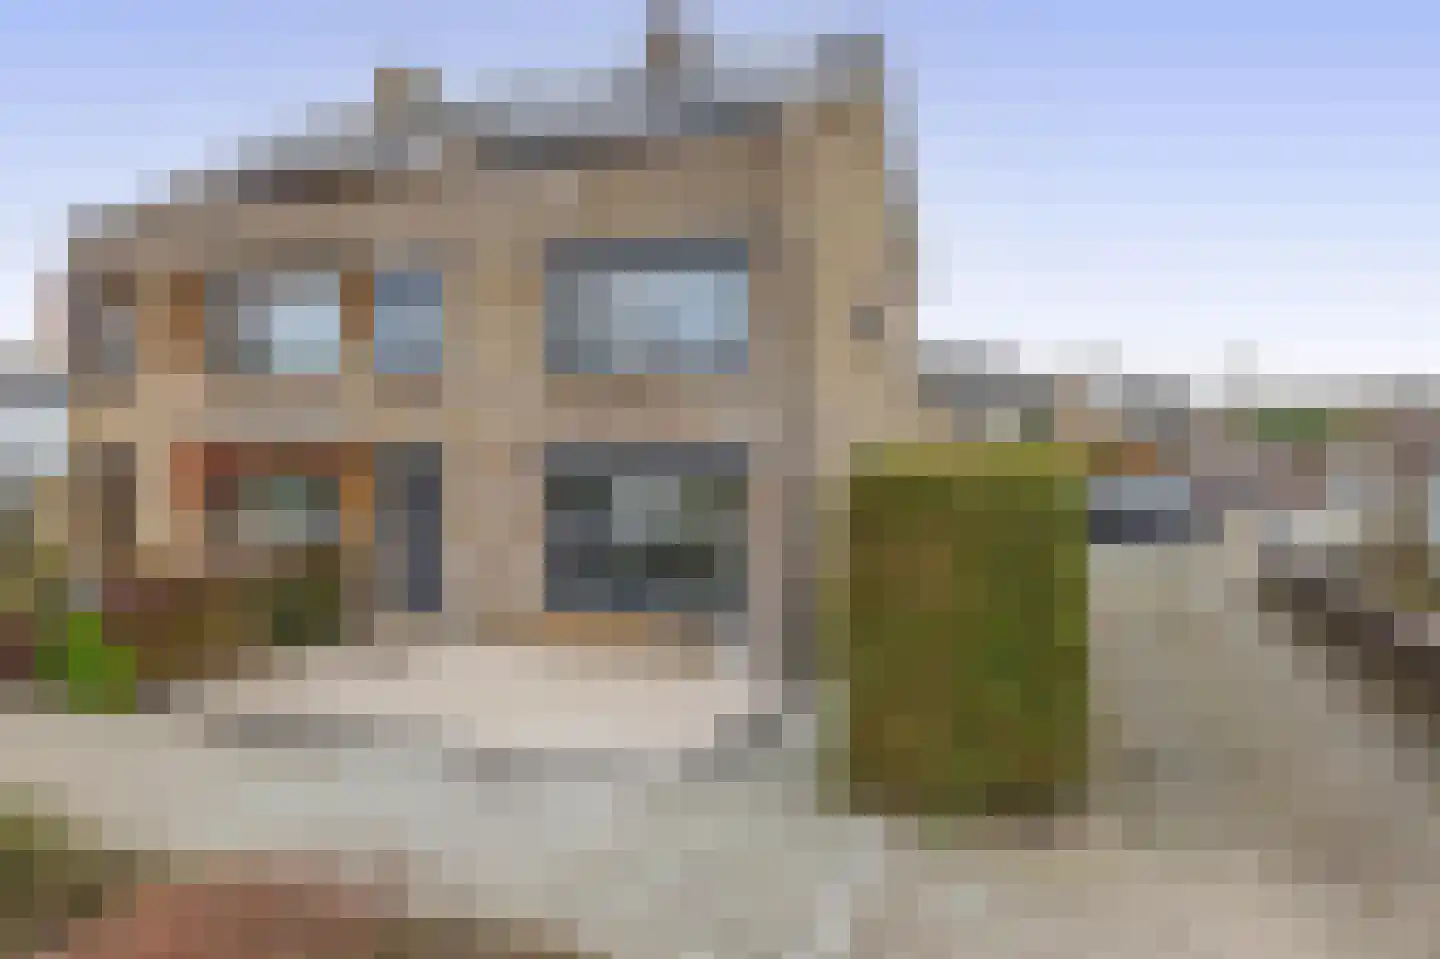
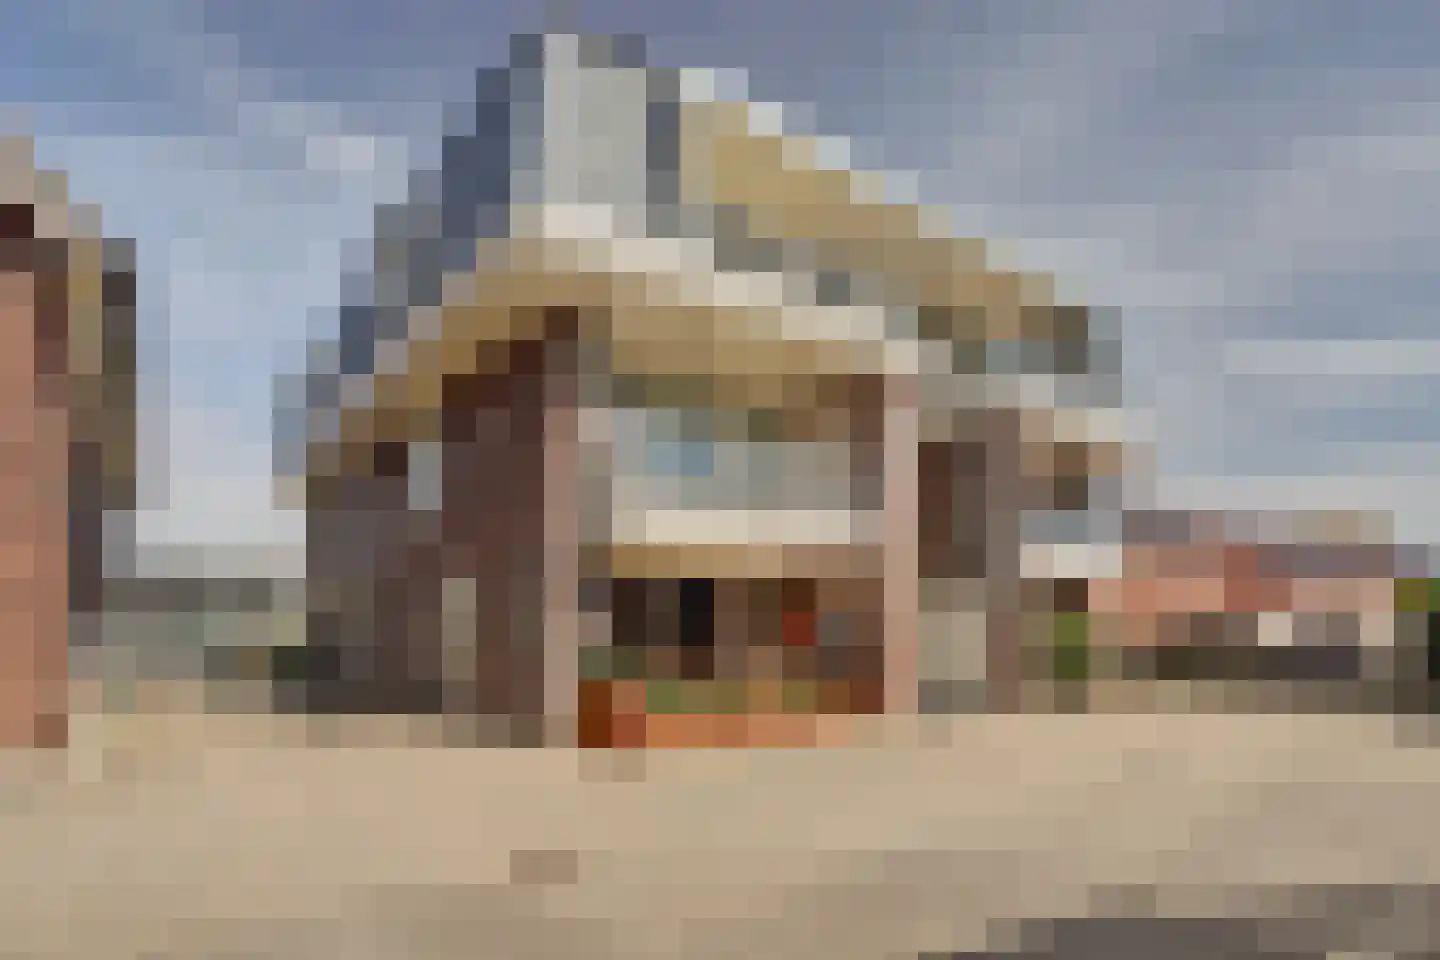
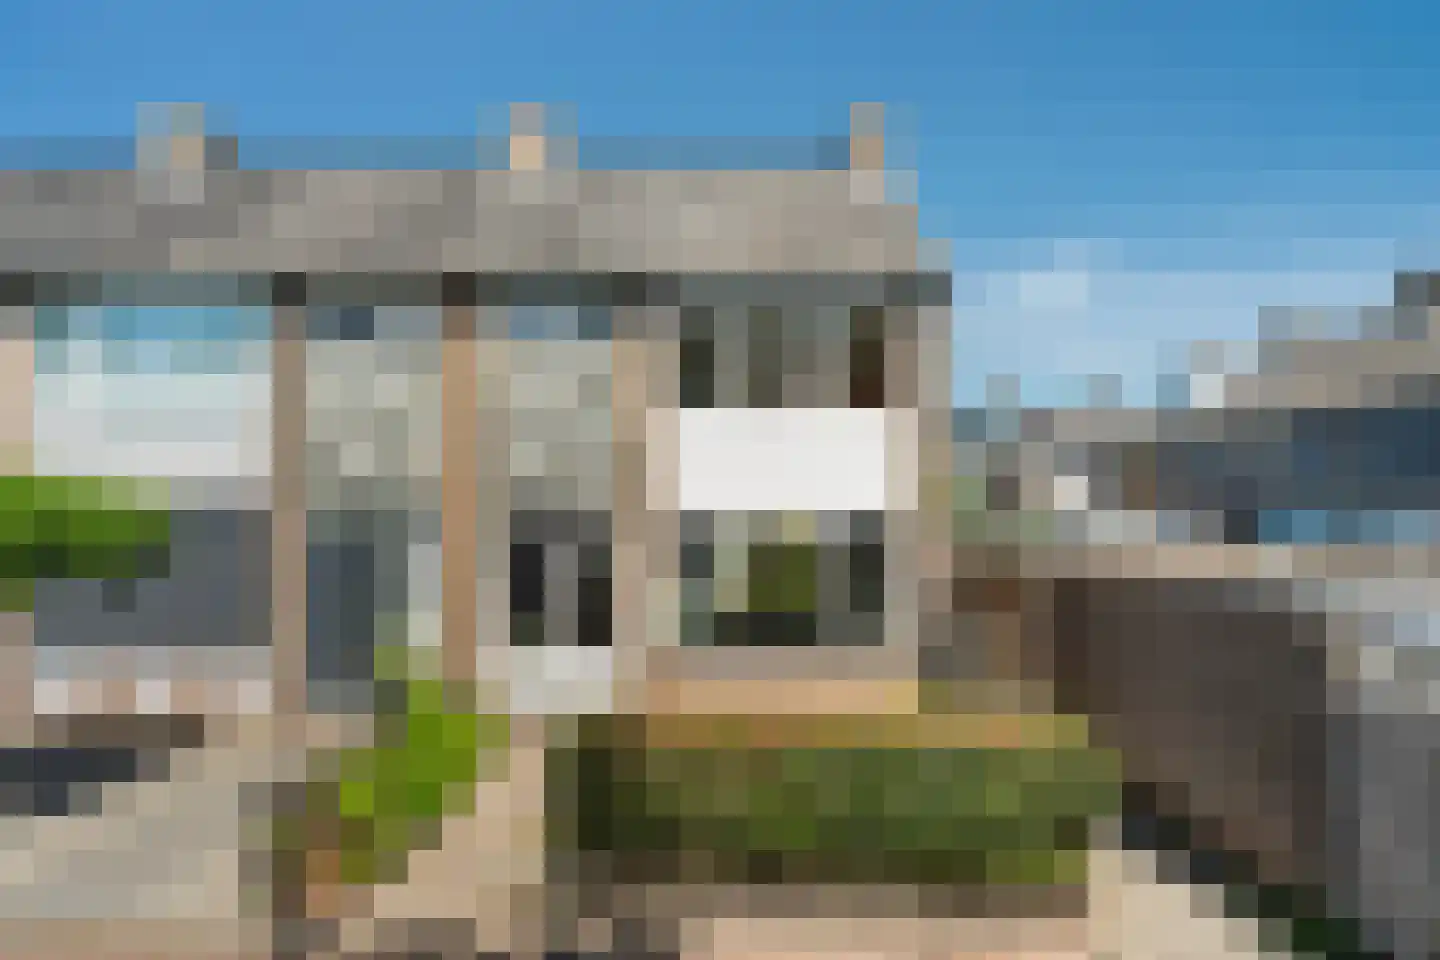
- Available
De Vaert 12
2651EP Berkel en Rodenrijs
€ 459.000 k.k.
€ 4.371/m²
- Living area
- 105 m²
- Land area
- 147 m²
- Bedrooms
- 4
Searching in 420 houses in Berkel en Rodenrijs
Type to search. Use arrow down and arrow up to navigate through results and press Enter to open.
Hidden search suggestions.
View current properties in Berkel en Rodenrijs or search targeted on street, postal code and property characteristics.
View the current housing stock in Berkel en Rodenrijs and quickly filter by price, living area, rooms and more. There are currently 420 houses in this place within our selection. View also 298 sold houses in Berkel en Rodenrijs for extra insight into the local housing market.
2651EP Berkel en Rodenrijs
€ 459.000 k.k.
€ 4.371/m²
2651NP Berkel en Rodenrijs
€ 699.000 k.k.
€ 5.140/m²
2652DR Berkel en Rodenrijs
€ 750.000 k.k.
€ 4.967/m²
2652HK Berkel en Rodenrijs
€ 935.000 k.k.
€ 6.233/m²
2652CS Berkel en Rodenrijs
€ 530.000 k.k.
€ 4.344/m²
2651BV Berkel en Rodenrijs
€ 550.000 k.k.
€ 5.914/m²
2651CX Berkel en Rodenrijs
€ 650.000 k.k.
2651SX Berkel en Rodenrijs
€ 515.000 k.k.
€ 4.598/m²
2652GP Berkel en Rodenrijs
€ 1.050.000 k.k.
€ 5.769/m²
2651HL Berkel en Rodenrijs
€ 389.500 k.k.
€ 4.477/m²
2651DL Berkel en Rodenrijs
€ 489.000 k.k.
€ 5.494/m²
2651CE Berkel en Rodenrijs
€ 695.000 k.k.
€ 3.798/m²
2652BS Berkel en Rodenrijs
€ 525.000 k.k.
€ 4.268/m²
2652HV Berkel en Rodenrijs
€ 850.000 k.k.
€ 4.802/m²
2652JP Berkel en Rodenrijs
€ 550.000 k.k.
€ 4.825/m²
2652HW Berkel en Rodenrijs
€ 950.000 k.k.
€ 5.655/m²
2652JC Berkel en Rodenrijs
€ 675.000 k.k.
€ 4.688/m²
2652GM Berkel en Rodenrijs
€ 950.000 k.k.
€ 6.051/m²
2652DV Berkel en Rodenrijs
€ 725.000 k.k.
€ 5.216/m²
2652LB Berkel en Rodenrijs
€ 750.000 k.k.
€ 5.396/m²
2652BZ Berkel en Rodenrijs
€ 725.000 k.k.
€ 5.216/m²
2651HP Berkel en Rodenrijs
€ 475.000 k.k.
€ 4.025/m²
2652KS Berkel en Rodenrijs
€ 750.000 k.k.
€ 5.435/m²
2651BP Berkel en Rodenrijs
€ 950.000 k.k.
€ 7.090/m²
2651DB Berkel en Rodenrijs
€ 750.000 k.k.
€ 5.000/m²
2651DP Berkel en Rodenrijs
€ 499.000 k.k.
€ 4.990/m²
2652KV Berkel en Rodenrijs
€ 600.000 k.k.
€ 5.660/m²
2651XT Berkel en Rodenrijs
€ 975.000 k.k.
€ 6.019/m²
Get free quotes from real estate agents with local market knowledge. Compare more than 250 real estate agents in Berkel en Rodenrijs.
Selling a home in Berkel en Rodenrijs? View the sales-oriented guide sell a house in Berkel en Rodenrijs, compare all real estate agents in Berkel en Rodenrijs or view the top 10 real estate agents in Berkel en Rodenrijs for extra context to your choice.
Real estate agents make sharper offers when they know you're comparing — ask for quotes for sale or purchase.
Practical answers about housing supply, sales and comparing real estate agents in Berkel en Rodenrijs.
The costs of a real estate agent in Berkel en Rodenrijs depend on commission, setup costs, property presentation and the chosen service. Compare the 250 real estate agents in Berkel en Rodenrijs via the real estate agent page and request multiple quotes to compare rates and approach well.
Within our selection, we are currently showing 420 houses in Berkel en Rodenrijs. View also the sold houses in Berkel en Rodenrijs to compare the current offering with recent transactions.
Take into account not only price and living area but also maintenance, energy label, location, outdoor space and sales status. This way you compare houses in Berkel en Rodenrijs on more than just the asking price.
A local real estate agent knows the neighborhoods, recent transactions and demand in Berkel en Rodenrijs. By comparing 250 real estate agents in the region you get a better insight into prices, sales strategy and expected yield; the top 10 in Berkel en Rodenrijs provides a useful starting point.
Yes, when making a sales plan, a valuation in Berkel en Rodenrijs is wise. You gain insight into a realistic asking price and can then compare offers from real estate agents specifically.
View current location data on residents, WOZ development, housing stock, energy consumption, business activity and safety in Berkel en Rodenrijs. In 2025 were there 34.180 residents. The average WOZ value in 2025 is EUR 515.365.
These figures help to better assess and compare the housing stock in Berkel en Rodenrijs with recent sold homes. Orient yourself then on suitable top real estate agents in Berkel en Rodenrijs for sales advice in this region.
Residents
34.180
Last year: 2025
Average WOZ
EUR 515.365
Last year: 2025
Average income per person.
EUR 37.840
Source: AllNumbers
Crimes (current year)
1.037
Total registered
| Year | Residents |
|---|---|
| 2021 | 32.290 |
| 2022 | 32.970 |
| 2023 | 33.460 |
| 2024 | 33.970 |
| 2025 | 34.180 |
| Year | Average WOZ |
|---|---|
| 2021 | EUR 382.955 |
| 2022 | EUR 414.807 |
| 2023 | EUR 486.247 |
| 2024 | EUR 508.553 |
| 2025 | EUR 515.365 |
Hoger
10.480
Praktisch
5.220
Middelbaar
8.600
Europa
1.935
Nederland
26.015
Buiten Europa
6.240
Label A
6.662
Label C
2.127
Label B
1.766
Label D
640
Label A+++
628
Label A+
436
Label E
378
Label F
370
Label G
277
Label A++++
252
Label A++
188
Label A+++++
11
| Year | Gas (m3) | Electricity (kWh) |
|---|---|---|
| 2020 | 1.055 | 3.141 |
| 2021 | 1.168 | 3.218 |
| 2022 | 896 | 3.035 |
| 2023 | 774 | 2.828 |
| 2024 | 744 | 2.893 |
Hoekwoning
Gas: 884 • Electricity: 2.993
Huurwoning
Gas: 646 • Electricity: 2.033
Koopwoning
Gas: 825 • Electricity: 3.099
Appartement
Gas: 532 • Electricity: 1.795
Tussenwoning
Gas: 722 • Electricity: 2.742
Vrijstaande woning
Gas: 1.305 • Electricity: 4.687
Twee-onder-één-kap woning
Gas: 1.044 • Electricity: 3.656
Total number of company establishments: 4.825
| Period | Crimes |
|---|---|
| jan 2025 | 75 |
| jan 2026 | 71 |
| jul 2025 | 130 |
| jun 2025 | 103 |
| mei 2025 | 74 |
| mrt 2025 | 81 |
| nov 2024 | 68 |
| nov 2025 | 79 |
| okt 2024 | 95 |
| okt 2025 | 84 |
| sep 2024 | 61 |
| sep 2025 | 98 |
These figures give an indicative picture of safety trends in the living environment of Berkel en Rodenrijs.
Short answers based on current local statistics, handy for a quick comparison of the living environment.
Berkel en Rodenrijs telt in 2025 ongeveer 34.180 inwoners.
De gemiddelde WOZ-waarde in Berkel en Rodenrijs is in 2025 circa € 515.365.
Het gemiddelde inkomen per inwoner in Berkel en Rodenrijs ligt rond € 37.840 per jaar.
Voor het huidige jaar gaat het om ongeveer 1.037 geregistreerde misdrijven. Gebruik deze cijfers als indicatie en vergelijk trends per periode.
In Berkel en Rodenrijs komt vooral "Tussenwoningen" veel voor, met ongeveer 6.423 woningen.