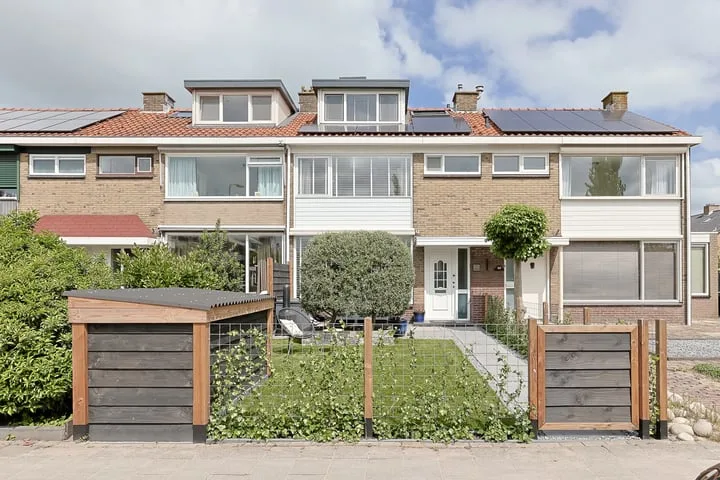
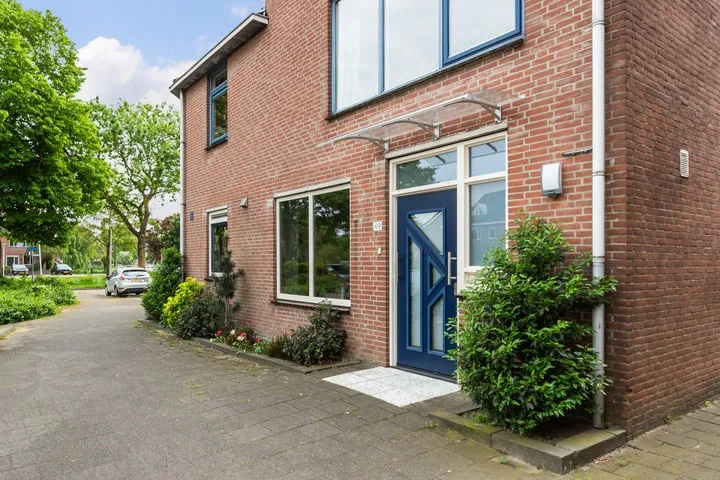
- Sold
Overtocht 66
2411BW Bodegraven
€ 405.000
€ 5.785/m²
- Living area
- 70 m²
- Land area
- —
- Bedrooms
- 2
View 221 sold houses in Bodegraven
Type to search. Use arrow down and arrow up to navigate through results and press Enter to open.
Hidden search suggestions.
Compare sold homes in Bodegraven or view the current offering in this location directly.
On this page you will find recently sold homes in Bodegraven. Use this overview to better estimate selling prices, popular neighborhoods, and the local housing supply before you choose a real estate agent. Also view the current housing supply with 290 houses in Bodegraven.
2411BW Bodegraven
€ 405.000
€ 5.785/m²
2411BW Bodegraven
€ 405.000
€ 5.785/m²
2411BW Bodegraven
€ 355.000
€ 5.071/m²
2411BW Bodegraven
€ 355.000
€ 5.071/m²
2411DH Bodegraven
€ 475.000 k.k.
€ 4.025/m²
2411KJ Bodegraven
€ 435.000 k.k.
€ 4.103/m²
2411GW Bodegraven
€ 295.000 k.k.
€ 4.214/m²
2411GG Bodegraven
€ 248.500 k.k.
€ 4.359/m²
2411VD Bodegraven
€ 380.000 k.k.
€ 4.470/m²
2411EE Bodegraven
€ 350.000 k.k.
€ 5.303/m²
2411RZ Bodegraven
€ 775.000 k.k.
€ 5.457/m²
2411KN Bodegraven
€ 419.000 k.k.
€ 3.521/m²
2411HB Bodegraven
€ 375.000 k.k.
€ 3.640/m²
2411GR Bodegraven
€ 450.000 k.k.
€ 4.054/m²
2411DD Bodegraven
€ 330.000 k.k.
€ 5.076/m²
2411ET Bodegraven
€ 395.000 k.k.
€ 5.197/m²
2411WH Bodegraven
€ 450.000 k.k.
€ 4.245/m²
2411KV Bodegraven
€ 450.000 k.k.
€ 4.411/m²
2411LG Bodegraven
€ 399.000 k.k.
€ 3.117/m²
2411RZ Bodegraven
€ 725.000 k.k.
€ 4.769/m²
2411HM Bodegraven
€ 650.000 k.k.
€ 4.676/m²
2411XP Bodegraven
€ 615.000 k.k.
€ 6.212/m²
2411ZK Bodegraven
€ 669.000 k.k.
€ 4.030/m²
2411CJ Bodegraven
€ 390.000 k.k.
€ 3.250/m²
2411HJ Bodegraven
€ 415.000 k.k.
€ 3.516/m²
Get free quotes from realtors with local market knowledge in Bodegraven.
Selling a home in Bodegraven? Compare real estate agents who know the local housing market. Also check out all real estate agents in Bodegraven or the top 10 real estate agents in Bodegraven for extra context for your choice.
By comparing brokers and requesting quotes
Short answers about housing prices, sold homes and comparing real estate agents in Bodegraven.
The costs of a real estate agent in Bodegraven vary per office, property type and sales approach. Therefore, compare multiple quotes and also look at the real estate agents in Bodegraven to better compare rates, presentation and local experience.
On this page we currently show 221 sold houses in Bodegraven from our selection. This helps you to better assess recent transactions and the local housing market.
Verkochte woningen in Bodegraven geven inzicht in vraagprijzen, woningtypes en buurten waar recent transacties hebben plaatsgevonden. Vergelijk dit ook met het actuele woningaanbod in Bodegraven om de markt beter te duiden.
Je kunt verkochte woningen gebruiken als eerste marktindicatie, maar een lokale makelaar kan beter rekening houden met afwerking, ligging, onderhoud en actuele vraag in Bodegraven.
Vergelijk makelaars in Bodegraven op lokale verkoopervaring, reviews, verwachte opbrengst, courtage en marketingaanpak. De top 10 makelaars in Bodegraven helpt om snel sterke kantoren te ontdekken.
View current location data on residents, WOZ development, housing stock, energy consumption, business activity and safety in Bodegraven. In 2025 were there 20.140 residents. The average WOZ value in 2025 is EUR 416.099.
These figures help to better assess and compare the housing stock in Bodegraven with recent sold homes. Orient yourself then on suitable top real estate agents in Bodegraven for sales advice in this region.
Residents
20.140
Last year: 2025
Average WOZ
EUR 416.099
Last year: 2025
Average income per person.
EUR 34.148
Source: AllNumbers
Crimes (current year)
662
Total registered
| Year | Residents |
|---|---|
| 2021 | 19.275 |
| 2022 | 19.580 |
| 2023 | 19.690 |
| 2024 | 19.745 |
| 2025 | 20.140 |
| Year | Average WOZ |
|---|---|
| 2021 | EUR 310.521 |
| 2022 | EUR 333.521 |
| 2023 | EUR 381.148 |
| 2024 | EUR 392.720 |
| 2025 | EUR 416.099 |
Hoger
4.760
Praktisch
3.610
Middelbaar
6.090
Europa
1.290
Nederland
16.185
Buiten Europa
2.665
Label C
2.508
Label A
1.889
Label B
1.217
Label G
657
Label D
640
Label E
427
Label F
373
Label A+++
278
Label A+
135
Label A++
70
Label A++++
38
Label A+++++
16
| Year | Gas (m3) | Electricity (kWh) |
|---|---|---|
| 2020 | 1.143 | 2.862 |
| 2021 | 1.264 | 2.912 |
| 2022 | 965 | 2.712 |
| 2023 | 814 | 2.559 |
| 2024 | 784 | 2.602 |
Hoekwoning
Gas: 901 • Electricity: 2.718
Huurwoning
Gas: 655 • Electricity: 1.946
Koopwoning
Gas: 888 • Electricity: 2.837
Appartement
Gas: 577 • Electricity: 1.840
Tussenwoning
Gas: 777 • Electricity: 2.513
Vrijstaande woning
Gas: 1.335 • Electricity: 3.983
Twee-onder-één-kap woning
Gas: 1.005 • Electricity: 3.011
Total number of company establishments: 2.805
| Period | Crimes |
|---|---|
| jan 2025 | 48 |
| jan 2026 | 88 |
| jul 2025 | 63 |
| jun 2025 | 60 |
| mei 2025 | 62 |
| mrt 2025 | 31 |
| nov 2024 | 47 |
| nov 2025 | 48 |
| okt 2024 | 49 |
| okt 2025 | 61 |
| sep 2024 | 53 |
| sep 2025 | 68 |
These figures give an indicative picture of safety trends in the living environment of Bodegraven.
Short answers based on current local statistics, handy for a quick comparison of the living environment.
Bodegraven telt in 2025 ongeveer 20.140 inwoners.
De gemiddelde WOZ-waarde in Bodegraven is in 2025 circa € 416.099.
Het gemiddelde inkomen per inwoner in Bodegraven ligt rond € 34.148 per jaar.
Voor het huidige jaar gaat het om ongeveer 662 geregistreerde misdrijven. Gebruik deze cijfers als indicatie en vergelijk trends per periode.
In Bodegraven komt vooral "Tussenwoningen" veel voor, met ongeveer 3.284 woningen.