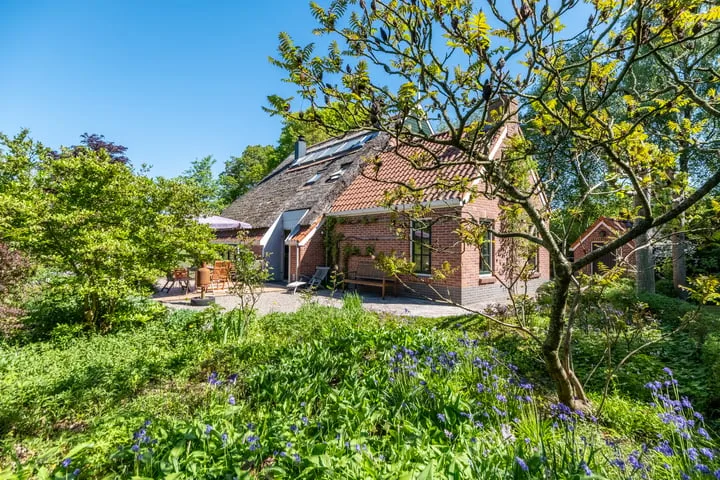
Houses sold in Boerakker

View 5 sold houses in Boerakker

Connected to: Vastgoed Nederland NVM Makelaars

On this page you will find recently sold homes in Boerakker. Use this overview to better estimate selling prices, popular neighborhoods, and the local housing supply before you choose a real estate agent. Also view the current housing supply with 7 houses in Boerakker.

Selection

Search and filter homes

Set your preferences and discover homes that suit you.

Total supply 242.353
Filters

Set price, area and other characteristics. Adjust a filter or click on Show homes. Location changes directly above.

Reset filters

You search for

  • Place Boerakker
  • Status Sold

Huis verkopen in Boerakker? Vergelijk verkoopmakelaars

Bekijk recente verkopen en ontvang gratis offertes van lokale makelaars. Vergelijk meer dan 26 makelaars in Boerakker.

Free request a quote

  • Quotes in Boerakker
  • Non-binding
  • Personal
  • Gratis tarieven vergelijken

Zelf je woning verkopen in Boerakker? Vergelijk verkoopmakelaars in Boerakker of bekijk de beste verkoopmakelaars in Boerakker als referentie bij jouw keuze.

Vergelijk meerdere offertes

Makelaars maken scherpere voorstellen als ze weten dat je vergelijkt — vraag offertes aan voor verkoop of aankoop.

Frequently asked questions about sold homes in Boerakker

Short answers about housing prices, sold homes and comparing real estate agents in Boerakker.

Residential and neighborhood statistics in Boerakker

View current location data on residents, WOZ development, housing stock, energy consumption, business activity and safety in Boerakker. In 2025 were there 638 residents. The average WOZ value in 2025 is EUR 391.969.

These figures help to better assess and compare the housing stock in Boerakker with recent sold homes. Orient yourself then on suitable top real estate agents in Boerakker for sales advice in this region.

Residents

638

Last year: 2025

Average WOZ

EUR 391.969

Last year: 2025

Average income per person.

EUR 30.918

Source: AllNumbers

Crimes (current year)

20

Total registered

Demographics and WOZ development

Inhabitants per year

Inhabitants per year in Boerakker
Year Residents
2021 633
2022 650
2023 651
2024 651
2025 638

Annual WOZ value

WOZ value per year in Boerakker
Year Average WOZ
2021 EUR 282.835
2022 EUR 319.370
2023 EUR 374.805
2024 EUR 369.903
2025 EUR 391.969

Composition of residents

Age build-up

65+: 127 0-15: 88 15-25: 77 25-45: 136 45-65: 219

Education level

Hoger

5

Praktisch

115

Middelbaar

241

Origin of residents (2025)

Europa

9

Nederland

606

Buiten Europa

20

Housing stock and construction periods

Types of homes

Hoekwoningen 6
Tussenwoningen 5
Vrijstaande woningen 220
Twee-onder-één-kap woningen 30

Construction period of buildings

Voor 1700 0
1700 tot 1900 9
1900 tot 1925 27
1925 tot 1950 54
1950 tot 1970 60
1970 tot 1980 36
1980 tot 1990 25
1990 tot 2000 25
2000 tot 2010 22
2010 tot 2020 11
2020 en later 9

Energy and sustainability

Energy label distribution

Label G

53

Label C

51

Label B

44

Label A

39

Label D

29

Label F

27

Label E

11

Label A+++

6

Label A+

1

Label A++

0

Label A++++

0

Label A+++++

0

Average energy consumption per year

Average energy consumption per year in Boerakker
Year Gas (m3) Electricity (kWh)
2020 1.789 3.508
2021 1.985 3.611
2022 1.522 3.311
2023 1.187 3.348
2024 1.125 3.499

Consumption per house type

Hoekwoning

Gas: 780 • Electricity: 1.584

Huurwoning

Gas: 588 • Electricity: 1.368

Koopwoning

Gas: 1.209 • Electricity: 3.431

Appartement

Gas: 12 • Electricity: 37

Tussenwoning

Gas: 560 • Electricity: 1.232

Vrijstaande woning

Gas: 1.213 • Electricity: 3.508

Twee-onder-één-kap woning

Gas: 602 • Electricity: 1.562

Business activity in Boerakker (2025)

Handel en HORECA 17
Nijverheid en energie 17
Zakelijke dienstverlening 30
Overheid, onderwijs en zorg 16
Landbouw, bosbouw en visserij 11
Vervoer, informatie en communicatie 5
Financiele diensten en onroerendgoed 3
Cultuur, recreatie en overige diensten 11

Total number of company establishments: 112

Recent crime statistics

Recent crime statistics in Boerakker
Period Crimes
jan 2025 1
jan 2026 1
jul 2025 0
jun 2025 3
mei 2025 0
mrt 2025 0
nov 2024 0
nov 2025 1
okt 2024 4
okt 2025 3
sep 2024 3
sep 2025 4

These figures give an indicative picture of safety trends in the living environment of Boerakker.

Frequently asked questions about living in Boerakker

Short answers based on current local statistics, handy for a quick comparison of the living environment.

Hoeveel inwoners heeft Boerakker?

Boerakker telt in 2025 ongeveer 638 inwoners.

Wat is de gemiddelde WOZ-waarde in Boerakker?

De gemiddelde WOZ-waarde in Boerakker is in 2025 circa € 391.969.

Wat is het gemiddelde inkomen per inwoner in Boerakker?

Het gemiddelde inkomen per inwoner in Boerakker ligt rond € 30.918 per jaar.

Hoe veilig is wonen in Boerakker?

Voor het huidige jaar gaat het om ongeveer 20 geregistreerde misdrijven. Gebruik deze cijfers als indicatie en vergelijk trends per periode.

Welke woningtypen komen het meest voor in Boerakker?

In Boerakker komt vooral "Vrijstaande woningen" veel voor, met ongeveer 220 woningen.

Gratis vrijblijvende offertes ontvangen

Vergelijk meerdere makelaars en kies de beste match.