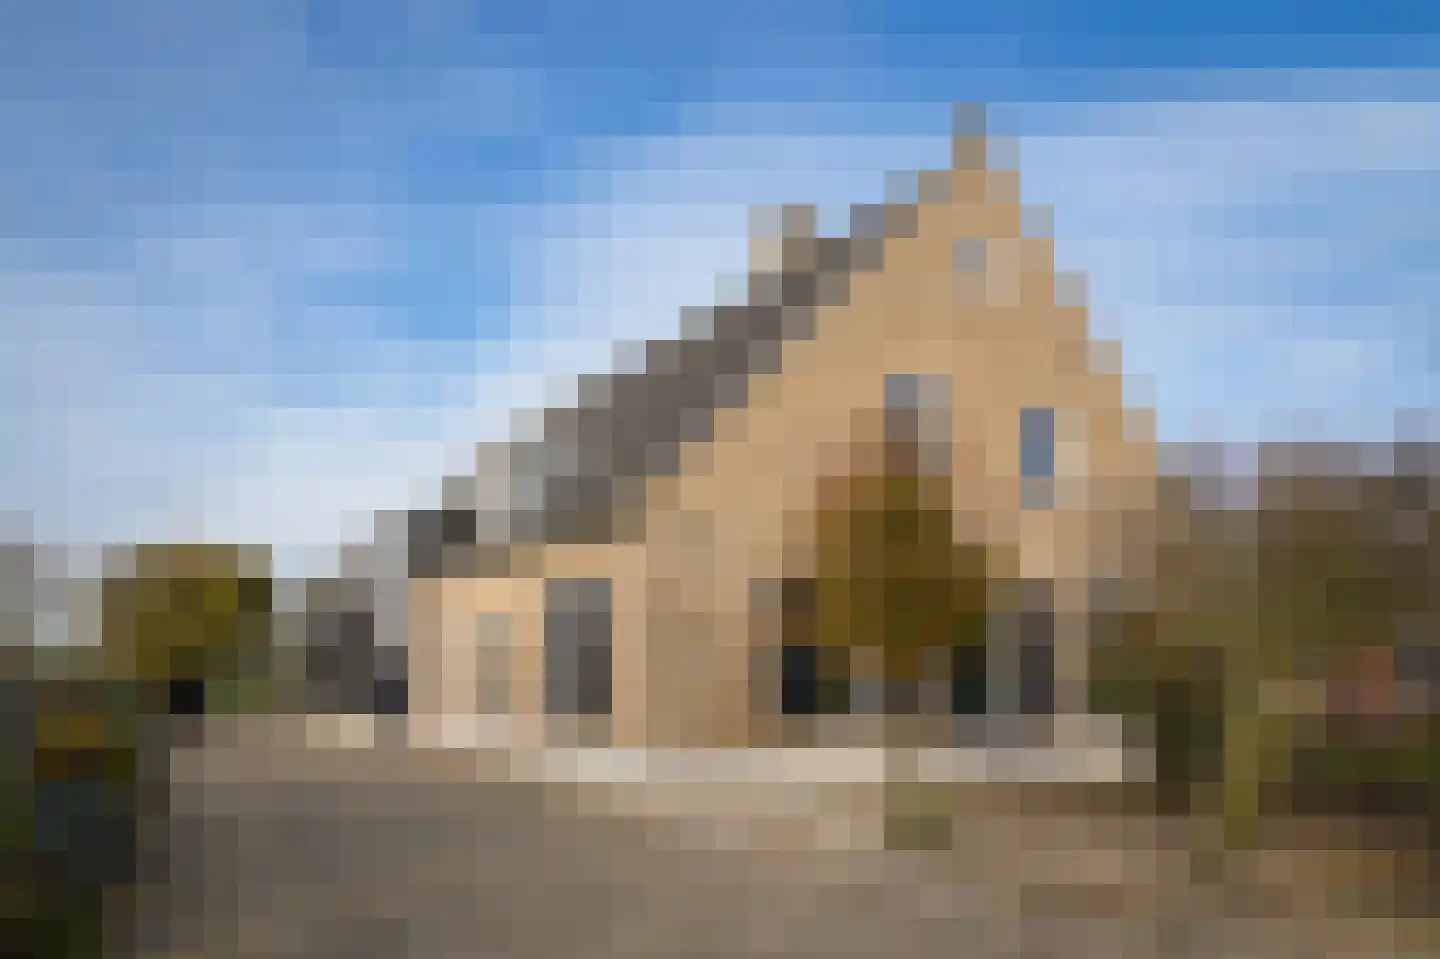
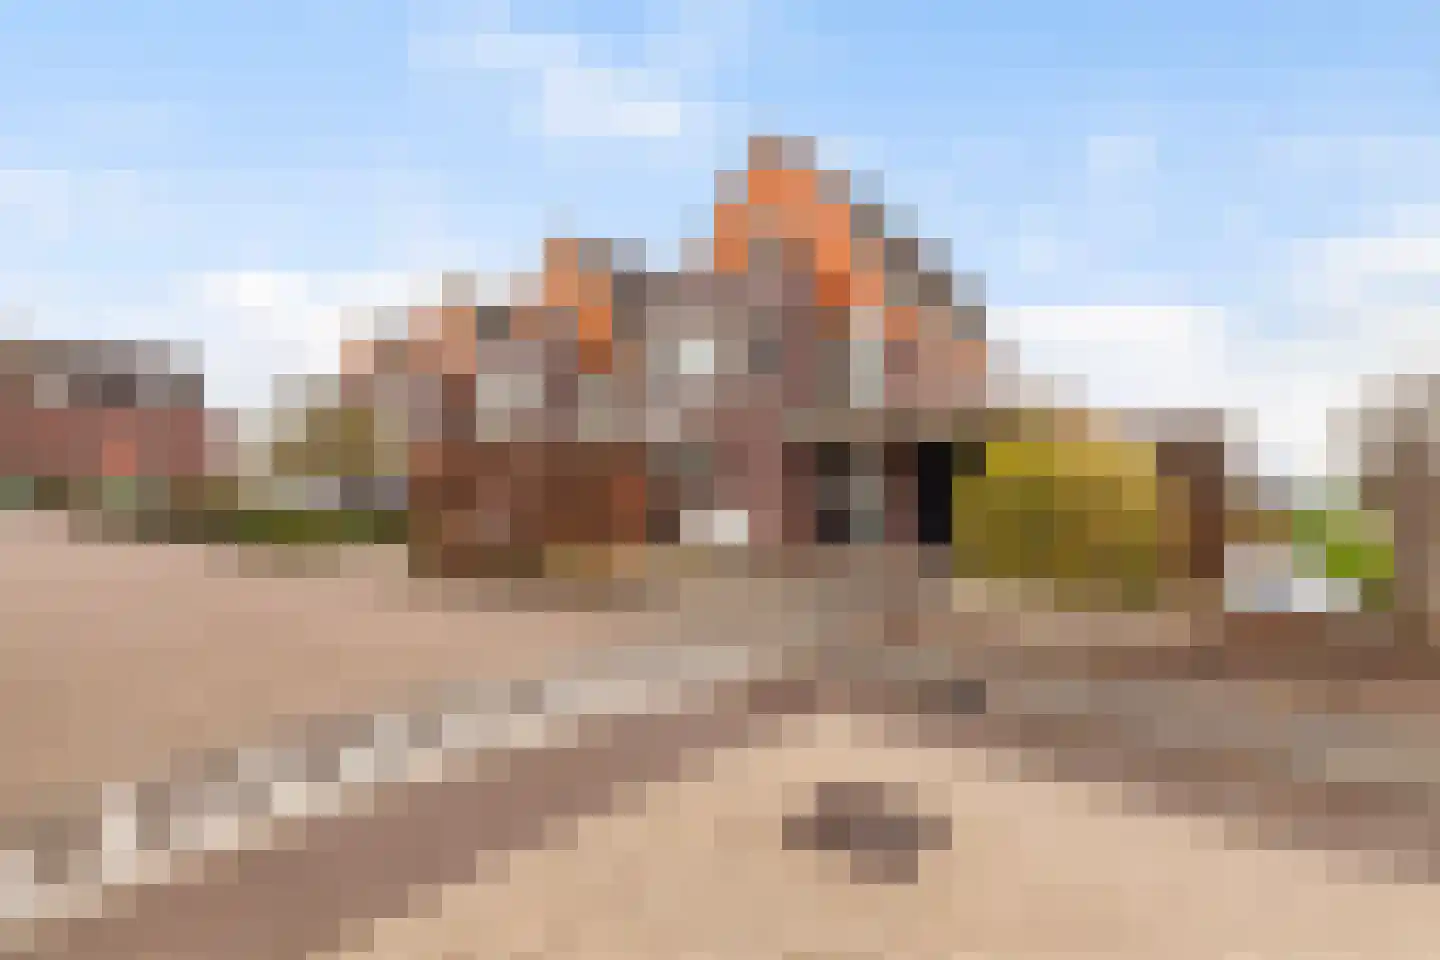
- Sold
Kamperfoelie 1
2974BM Brandwijk
€ 789.000 k.k.
€ 5.191/m²
- Living area
- 152 m²
- Land area
- 453 m²
- Bedrooms
- 3
View 12 sold houses in Brandwijk
Type to search. Use arrow down and arrow up to navigate through results and press Enter to open.
Hidden search suggestions.
Compare sold homes in Brandwijk or view the current offering in this location directly.
On this page you will find recently sold homes in Brandwijk. Use this overview to better estimate selling prices, popular neighborhoods, and the local housing supply before you choose a real estate agent. Also view the current housing supply with 16 houses in Brandwijk.
2974BM Brandwijk
€ 789.000 k.k.
€ 5.191/m²
2974BR Brandwijk
€ 369.000 k.k.
€ 5.426/m²
2974BJ Brandwijk
€ 400.000 k.k.
€ 4.878/m²
2974LC Brandwijk
€ 1.895.000 k.k.
€ 8.896/m²
2974LH Brandwijk
€ 475.000 k.k.
€ 3.625/m²
2974LC Brandwijk
€ 315.000 k.k.
€ 4.144/m²
2974LB Brandwijk
€ 1.050.000 k.k.
€ 4.320/m²
2974BM Brandwijk
€ 425.000 k.k.
€ 4.086/m²
2974VB Brandwijk
€ 295.000 k.k.
€ 0/m²
2974BM Brandwijk
€ 295.000 k.k.
€ 4.682/m²
2974LD Brandwijk
€ 750.000 k.k.
€ 7.142/m²
2974VE Brandwijk
€ 395.000 k.k.
€ 4.157/m²
Bekijk recente verkopen en ontvang gratis offertes van lokale makelaars. Vergelijk meer dan 22 makelaars in Brandwijk.
Zelf je woning verkopen in Brandwijk? Vergelijk verkoopmakelaars in Brandwijk of bekijk de beste verkoopmakelaars in Brandwijk als referentie bij jouw keuze.
Makelaars maken scherpere voorstellen als ze weten dat je vergelijkt — vraag offertes aan voor verkoop of aankoop.
Short answers about housing prices, sold homes and comparing real estate agents in Brandwijk.
De kosten van een makelaar in Brandwijk verschillen per kantoor, woningtype en verkoopaanpak. In Brandwijk kun je 22 real estate agents vergelijken; bekijk daarom ook de makelaars in Brandwijk om tarieven, presentatie en lokale ervaring beter naast elkaar te zetten.
On this page we currently show 12 sold houses in Brandwijk from our selection. This helps you to better assess recent transactions and the local housing market.
Houses sold in Brandwijk give insight into asking prices, house types and neighborhoods where recent transactions have taken place. Compare this also with the current housing stock in Brandwijk to better understand the market.
You can use sold homes as a first market indication, but a local real estate agent can better take into account finishing, location, maintenance and current demand in Brandwijk.
Vergelijk de 22 real estate agents in Brandwijk op lokale verkoopervaring, reviews, verwachte opbrengst, courtage en marketingaanpak. Bekijk verkoopmakelaars in Brandwijk of de top 10 makelaars in Brandwijk om snel sterke kantoren te ontdekken.
View current location data on residents, WOZ development, housing stock, energy consumption, business activity and safety in Brandwijk. In 2025 were there 1.400 residents. The average WOZ value in 2025 is EUR 478.000.
These figures help to better assess and compare the housing stock in Brandwijk with recent sold homes. Orient yourself then on suitable top real estate agents in Brandwijk for sales advice in this region.
Residents
1.400
Last year: 2025
Average WOZ
EUR 478.000
Last year: 2025
Average income per person.
EUR 33.400
Source: AllNumbers
Crimes (current year)
17
Total registered
| Year | Residents |
|---|---|
| 2021 | 1.350 |
| 2022 | 1.355 |
| 2023 | 1.370 |
| 2024 | 1.375 |
| 2025 | 1.400 |
| Year | Average WOZ |
|---|---|
| 2021 | EUR 346.000 |
| 2022 | EUR 383.000 |
| 2023 | EUR 432.000 |
| 2024 | EUR 463.000 |
| 2025 | EUR 478.000 |
Hoger
240
Praktisch
200
Middelbaar
580
Europa
55
Nederland
1.295
Buiten Europa
45
Label A
128
Label G
96
Label C
90
Label B
70
Label D
44
Label F
24
Label E
20
Label A+++
3
Label A+
1
Label A++
0
Label A++++
0
Label A+++++
0
| Year | Gas (m3) | Electricity (kWh) |
|---|---|---|
| 2020 | 1.420 | 3.200 |
| 2021 | 1.610 | 3.290 |
| 2022 | 1.250 | 3.130 |
| 2023 | 1.030 | 2.880 |
| 2024 | 1.010 | 2.950 |
Hoekwoning
Gas: 820 • Electricity: 2.090
Huurwoning
Gas: 890 • Electricity: 2.020
Koopwoning
Gas: 1.090 • Electricity: 3.280
Appartement
Gas: 750 • Electricity: 2.380
Tussenwoning
Gas: 720 • Electricity: 2.070
Vrijstaande woning
Gas: 1.360 • Electricity: 3.780
Twee-onder-één-kap woning
Gas: 1.180 • Electricity: 3.330
Total number of company establishments: 225
| Period | Crimes |
|---|---|
| jan 2025 | 0 |
| jan 2026 | 0 |
| jul 2025 | 1 |
| jun 2025 | 1 |
| mei 2025 | 1 |
| mrt 2025 | 2 |
| nov 2024 | 1 |
| nov 2025 | 3 |
| okt 2024 | 0 |
| okt 2025 | 2 |
| sep 2024 | 2 |
| sep 2025 | 1 |
These figures give an indicative picture of safety trends in the living environment of Brandwijk.
Short answers based on current local statistics, handy for a quick comparison of the living environment.
Brandwijk telt in 2025 ongeveer 1.400 inwoners.
De gemiddelde WOZ-waarde in Brandwijk is in 2025 circa € 478.000.
Het gemiddelde inkomen per inwoner in Brandwijk ligt rond € 33.400 per jaar.
Voor het huidige jaar gaat het om ongeveer 17 geregistreerde misdrijven. Gebruik deze cijfers als indicatie en vergelijk trends per periode.
In Brandwijk komt vooral "Vrijstaande woningen" veel voor, met ongeveer 181 woningen.