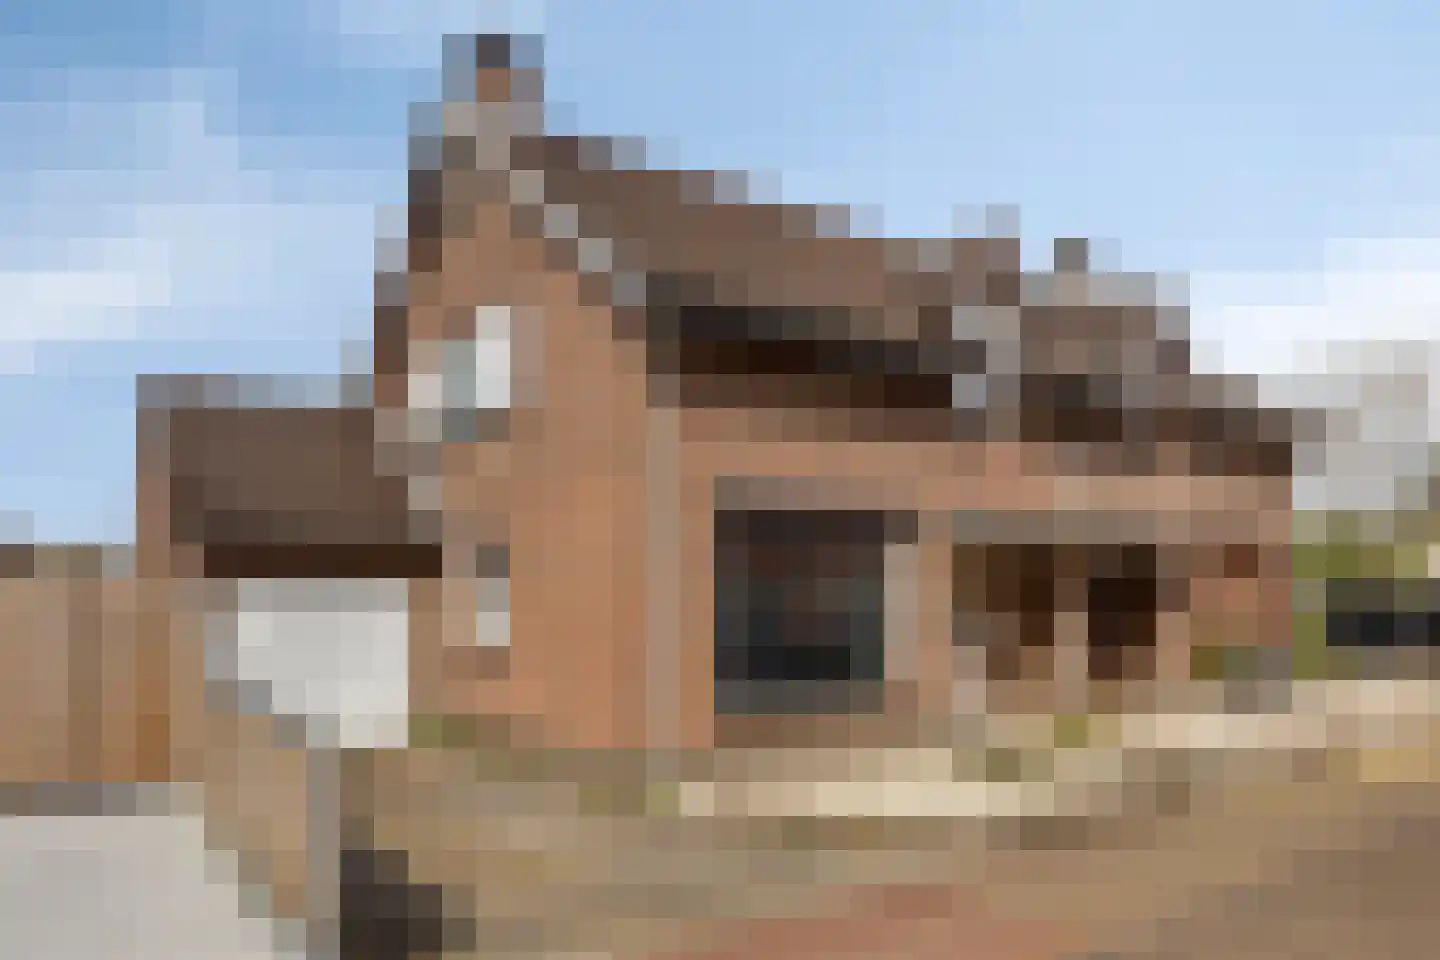
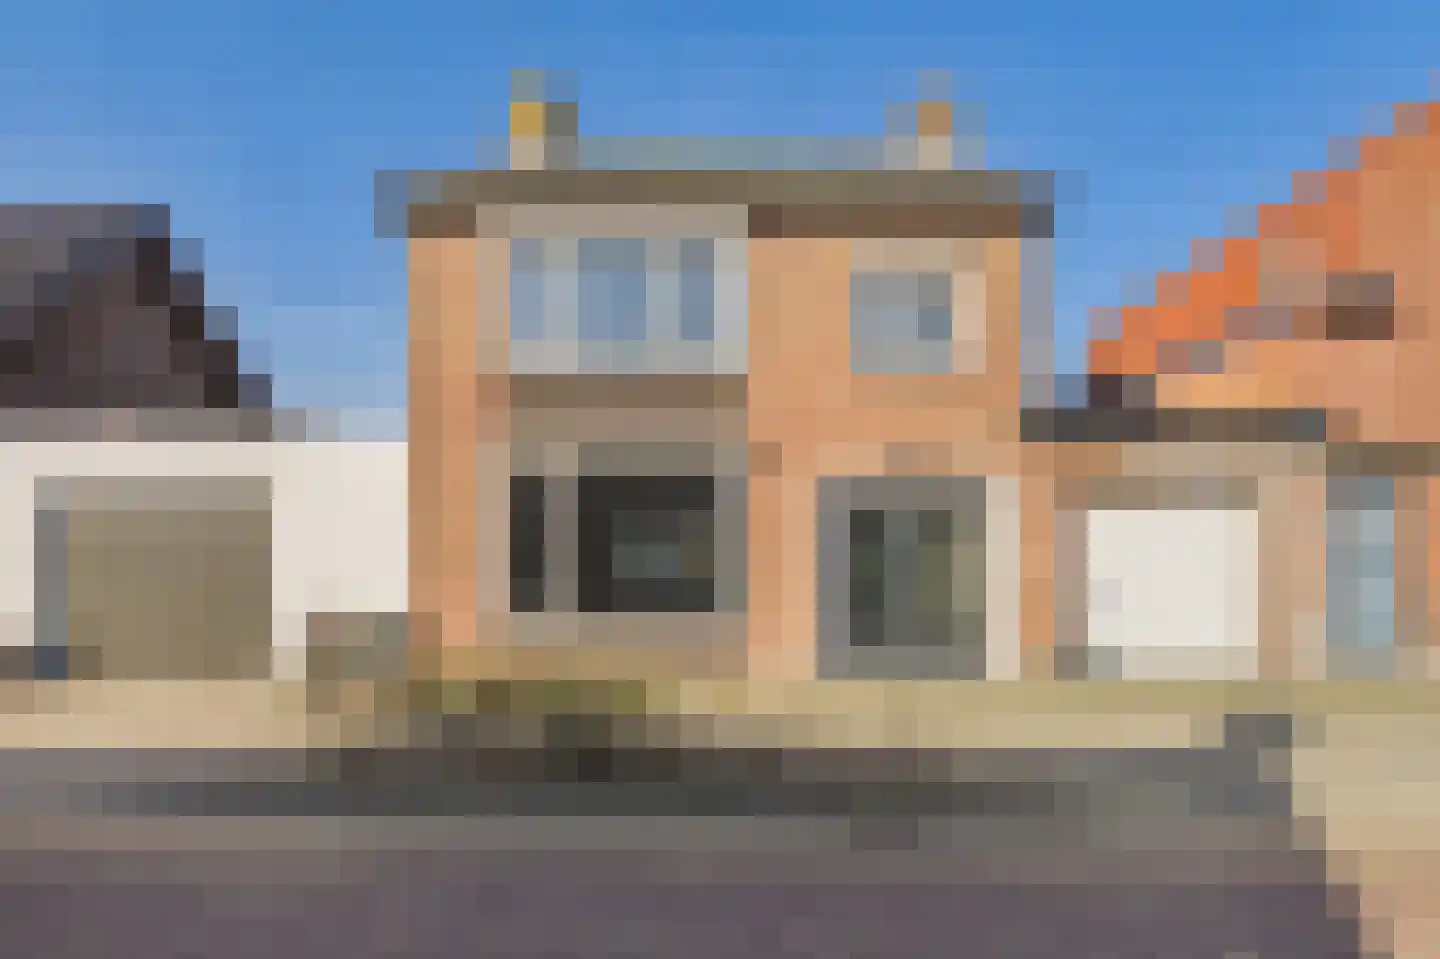
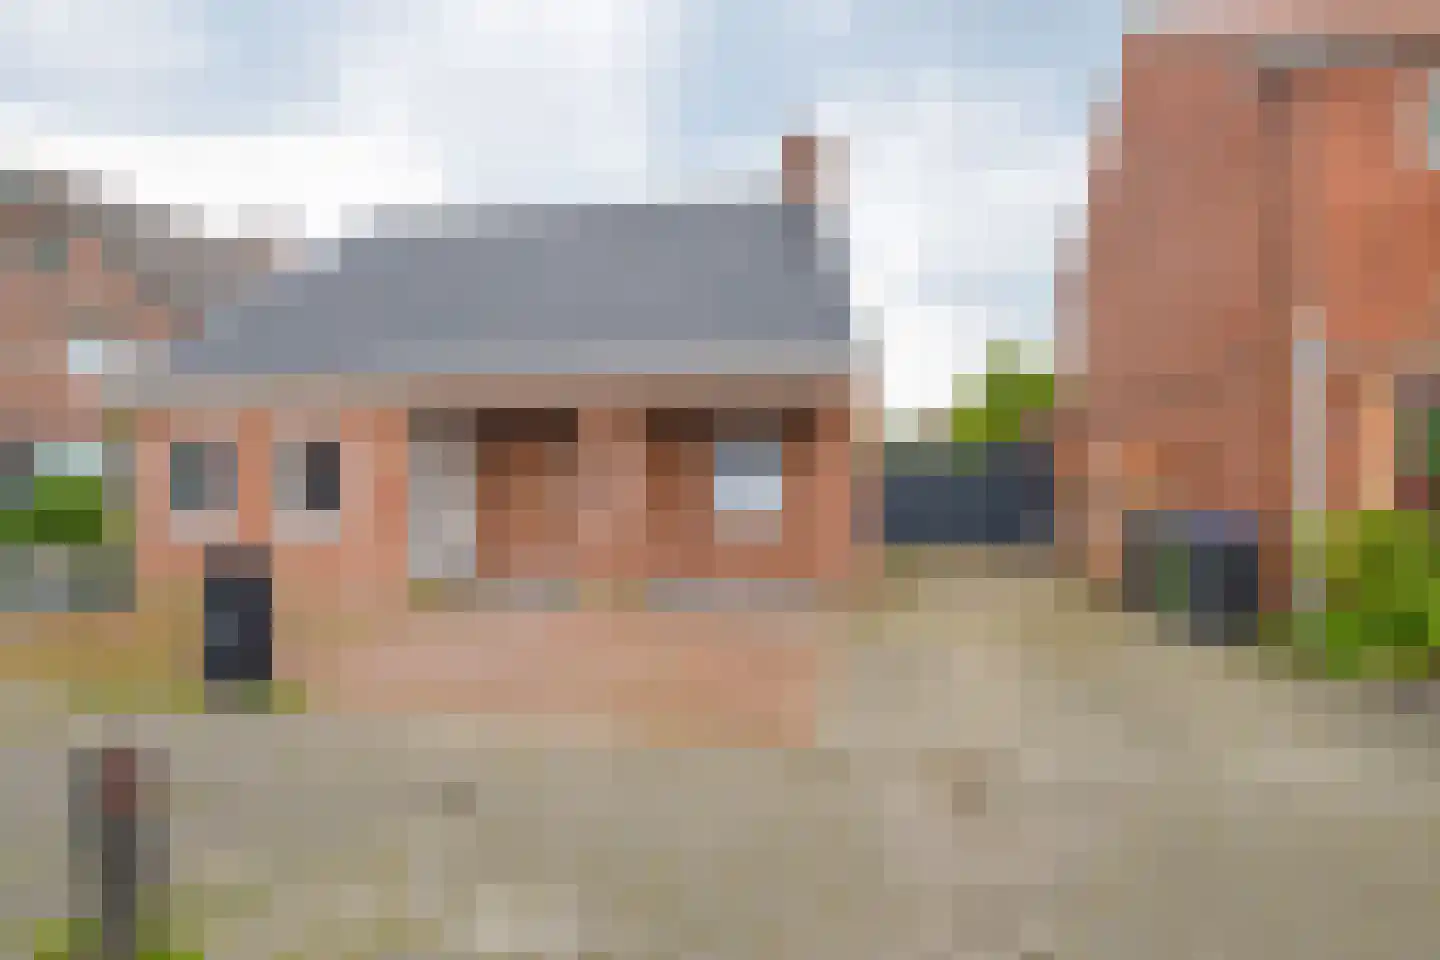
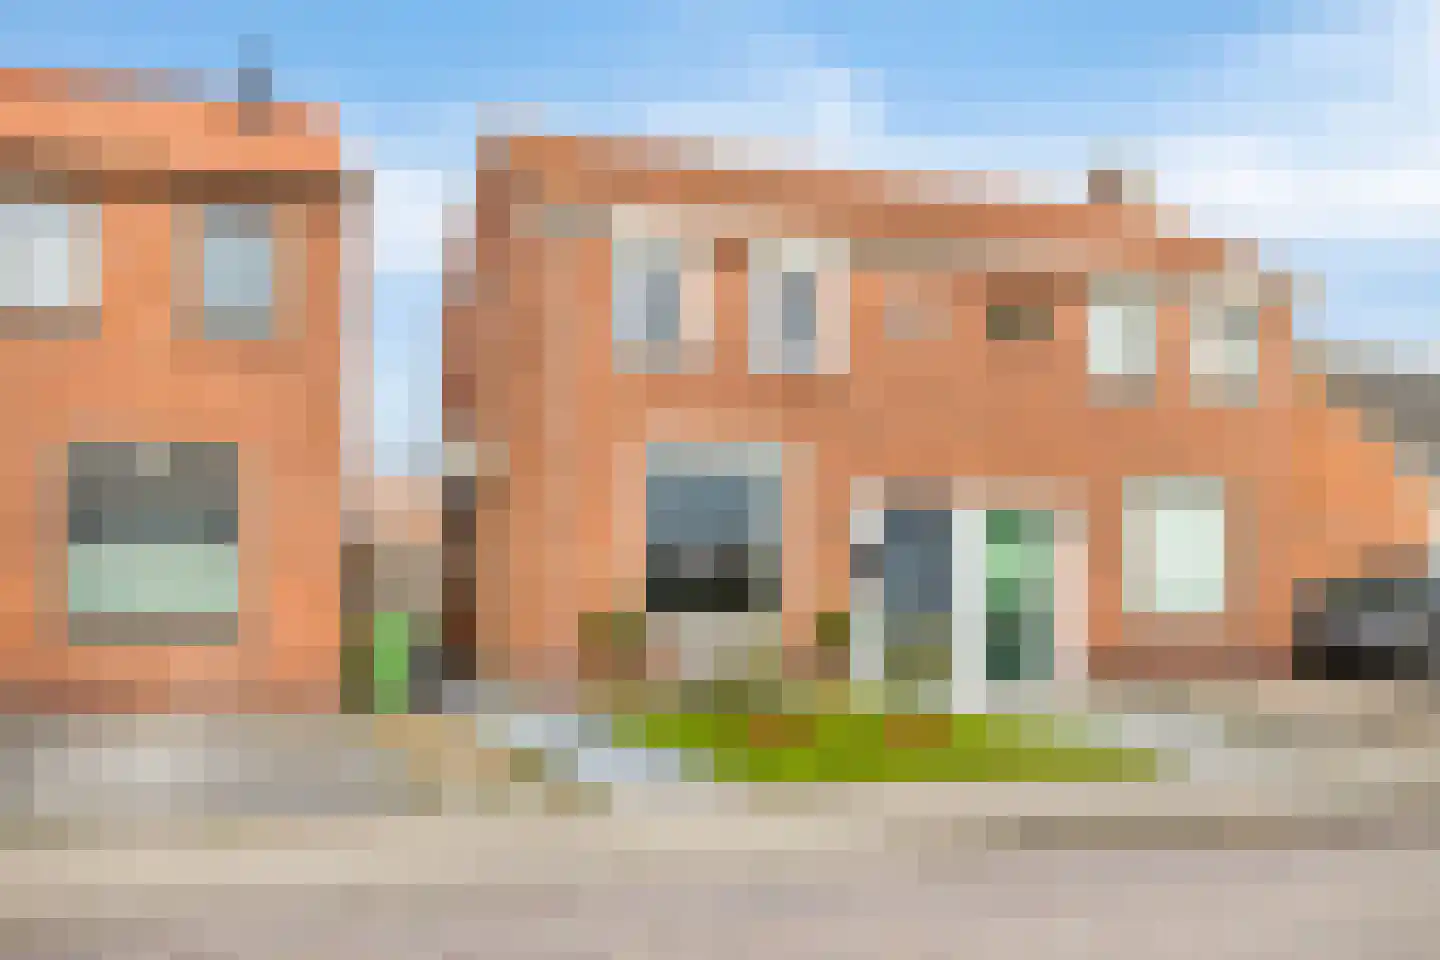
Housing offer in Clinge

Searching in 36 houses in Clinge

Connected to: Vastgoed Nederland NVM Makelaars

View the current housing stock in Clinge and quickly filter by price, living area, rooms and more. There are currently 36 houses in this place within our selection. View also 23 sold houses in Clinge for extra insight into the local housing market.

Selection

Search and filter homes

Set your preferences and discover homes that suit you.

Total supply 244.609
Filters

Set price, area and other characteristics. Adjust a filter or click on Show homes. Location changes directly above.

Reset filters

You search for

  • Place Clinge

Selling a home in Clinge? Compare realtor offers

Get free quotes from real estate agents with local market knowledge. Compare more than 16 real estate agents in Clinge.

Free request a quote

  • Quotes in Clinge
  • Non-binding
  • Personal
  • Compare free rates

Selling a home in Clinge? Compare all real estate agents in Clinge or view the top 10 real estate agents in Clinge for extra context for your choice.

Compare multiple quotes

Real estate agents make sharper offers when they know you're comparing — ask for quotes for sale or purchase.

Frequently asked questions about homes in Clinge

Practical answers about housing supply, sales and comparing real estate agents in Clinge.

Residential and neighborhood statistics in Clinge

View current location data on residents, WOZ development, housing stock, energy consumption, business activity and safety in Clinge. In 2025 were there 2.325 residents. The average WOZ value in 2025 is EUR 298.000.

These figures help to better assess and compare the housing stock in Clinge with recent sold homes. Orient yourself then on suitable top real estate agents in Clinge for sales advice in this region.

Residents

2.325

Last year: 2025

Average WOZ

EUR 298.000

Last year: 2025

Average income per person.

EUR 31.200

Source: AllNumbers

Crimes (current year)

62

Total registered

Demographics and WOZ development

Inhabitants per year

Inhabitants per year in Clinge
Year Residents
2021 2.350
2022 2.325
2023 2.305
2024 2.315
2025 2.325

Annual WOZ value

WOZ value per year in Clinge
Year Average WOZ
2021 EUR 219.000
2022 EUR 236.000
2023 EUR 255.000
2024 EUR 285.000
2025 EUR 298.000

Composition of residents

Age build-up

65+: 585 0-15: 265 15-25: 215 25-45: 500 45-65: 755

Education level

Hoger

470

Praktisch

630

Middelbaar

700

Origin of residents (2025)

Europa

980

Nederland

1.205

Buiten Europa

140

Housing stock and construction periods

Types of homes

Hoekwoningen 116
Appartementen 32
Tussenwoningen 159
Vrijstaande woningen 478
Twee-onder-één-kap woningen 312

Construction period of buildings

Voor 1700 0
1700 tot 1900 24
1900 tot 1925 96
1925 tot 1950 157
1950 tot 1970 376
1970 tot 1980 160
1980 tot 1990 99
1990 tot 2000 107
2000 tot 2010 66
2010 tot 2020 38
2020 en later 64

Energy and sustainability

Energy label distribution

Label C

208

Label G

195

Label F

173

Label B

160

Label A

143

Label D

121

Label E

61

Label A+++

17

Label A++++

3

Label A+

2

Label A++

0

Label A+++++

0

Average energy consumption per year

Average energy consumption per year in Clinge
Year Gas (m3) Electricity (kWh)
2020 1.430 3.000
2021 1.660 3.190
2022 1.330 3.040
2023 1.120 2.900
2024 1.070 2.990

Consumption per house type

Hoekwoning

Gas: 1.050 • Electricity: 2.440

Huurwoning

Gas: 1.010 • Electricity: 2.600

Koopwoning

Gas: 1.150 • Electricity: 2.970

Appartement

Gas: 760 • Electricity: 1.980

Tussenwoning

Gas: 900 • Electricity: 2.080

Vrijstaande woning

Gas: 1.240 • Electricity: 3.390

Twee-onder-één-kap woning

Gas: 1.100 • Electricity: 2.830

Business activity in Clinge (2025)

Handel en HORECA 35
Nijverheid en energie 40
Zakelijke dienstverlening 35
Overheid, onderwijs en zorg 35
Landbouw, bosbouw en visserij 20
Vervoer, informatie en communicatie 15
Financiele diensten en onroerendgoed 5
Cultuur, recreatie en overige diensten 15

Total number of company establishments: 200

Recent crime statistics

Recent crime statistics in Clinge
Period Crimes
jan 2026 3
jul 2025 8
jun 2025 4
mei 2025 6
mrt 2025 4
mrt 2026 1
nov 2024 6
nov 2025 3
okt 2024 5
okt 2025 6
sep 2024 6
sep 2025 5

These figures give an indicative picture of safety trends in the living environment of Clinge.

Frequently asked questions about living in Clinge

Short answers based on current local statistics, handy for a quick comparison of the living environment.

Hoeveel inwoners heeft Clinge?

Clinge telt in 2025 ongeveer 2.325 inwoners.

Wat is de gemiddelde WOZ-waarde in Clinge?

De gemiddelde WOZ-waarde in Clinge is in 2025 circa € 298.000.

Wat is het gemiddelde inkomen per inwoner in Clinge?

Het gemiddelde inkomen per inwoner in Clinge ligt rond € 31.200 per jaar.

Hoe veilig is wonen in Clinge?

Voor het huidige jaar gaat het om ongeveer 62 geregistreerde misdrijven. Gebruik deze cijfers als indicatie en vergelijk trends per periode.

Welke woningtypen komen het meest voor in Clinge?

In Clinge komt vooral "Vrijstaande woningen" veel voor, met ongeveer 478 woningen.

Receive free, non-binding quotes

Compare multiple real estate agents and choose the best match.