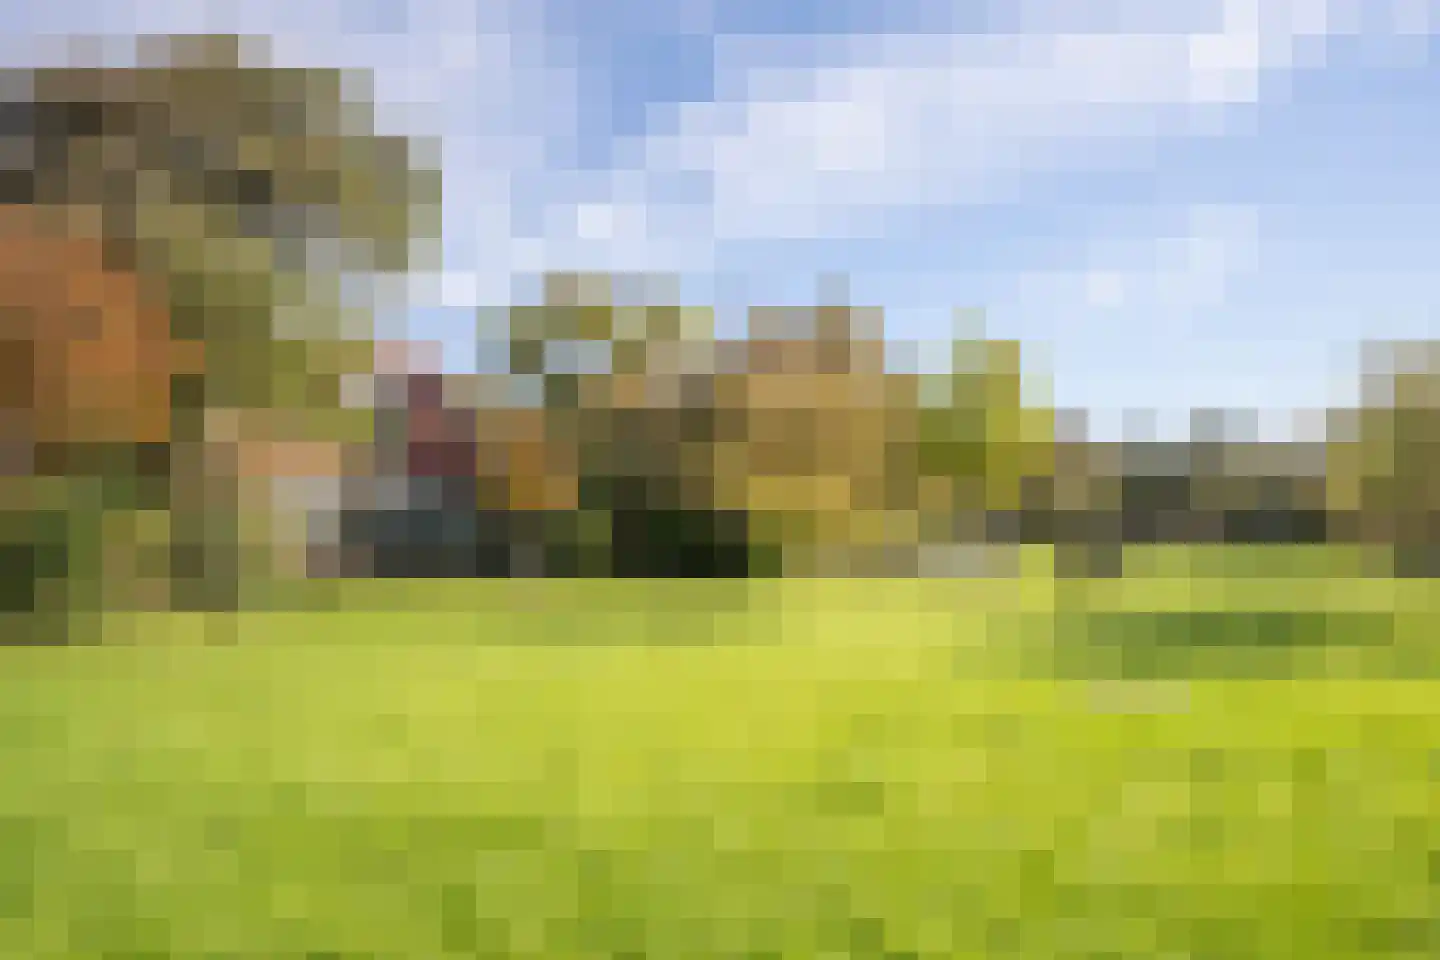
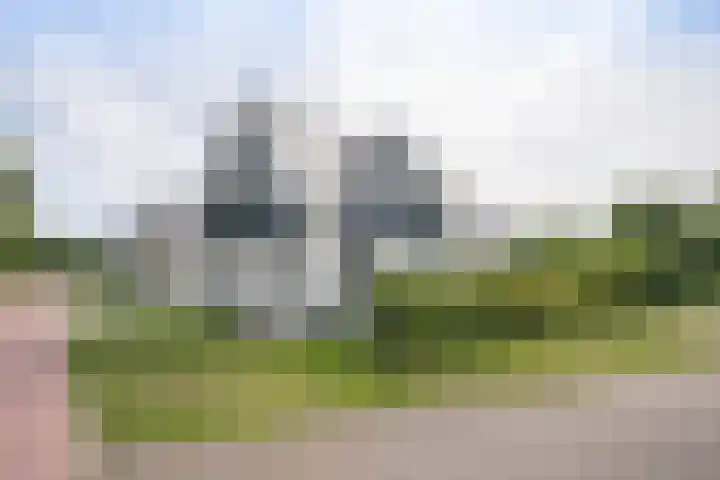
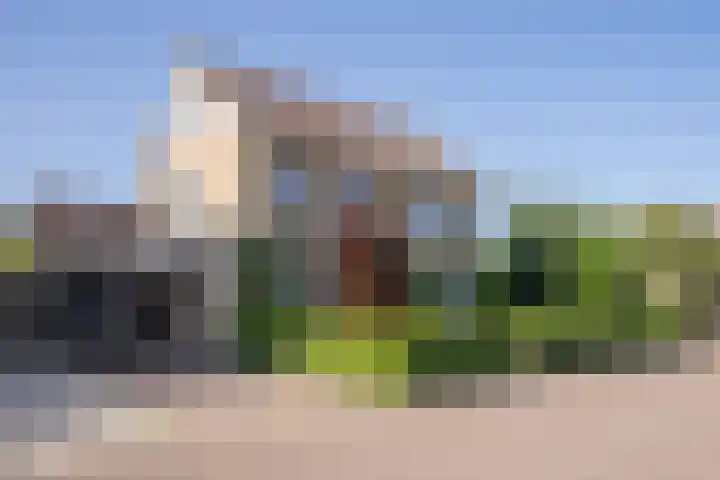
- Sold
Ruijslaan 3
1796AB De Koog
Price upon request
- Living area
- 149 m²
- Land area
- —
- Bedrooms
- 3
View 19 sold houses in De Koog
Type to search. Use arrow down and arrow up to navigate through results and press Enter to open.
Hidden search suggestions.
Compare sold homes in De Koog or view the current offering in this location directly.
On this page you will find recently sold homes in De Koog. Use this overview to better estimate selling prices, popular neighborhoods, and the local housing supply before you choose a real estate agent. Also view the current housing supply with 66 houses in De Koog.
1796AB De Koog
Price upon request
1796BK De Koog
€ 548.500 k.k.
€ 3.116/m²
1796NM De Koog
€ 235.000 k.k.
€ 5.595/m²
1796AM De Koog
€ 287.500 k.k.
€ 5.528/m²
1796BP De Koog
€ 245.000 k.k.
€ 5.697/m²
1796ML De Koog
€ 487.500 k.k.
€ 4.974/m²
1796PB De Koog
€ 625.000 k.k.
€ 6.720/m²
1796PN De Koog
€ 445.000 k.k.
€ 6.846/m²
1796AH De Koog
€ 730.000 k.k.
€ 4.171/m²
1796MB De Koog
€ 965.000 k.k.
€ 6.069/m²
1796PR De Koog
€ 445.000 k.k.
€ 7.063/m²
1796NE De Koog
€ 850.000
€ 8.673/m²
1796ML De Koog
€ 685.000 k.k.
€ 5.524/m²
1796PA De Koog
€ 861.500 k.k.
€ 5.317/m²
1796PS De Koog
€ 319.500 k.k.
€ 0/m²
1796BN De Koog
€ 735.000 k.k.
€ 4.038/m²
1796PD De Koog
€ 475.000 k.k.
€ 7.307/m²
1796CD De Koog
€ 139.000 k.k.
€ 3.756/m²
1796BP De Koog
€ 239.500 k.k.
€ 5.443/m²
Bekijk recente verkopen en ontvang gratis offertes van lokale verkoopmakelaars in De Koog.
Zelf je woning verkopen in De Koog? Vergelijk verkoopmakelaars in De Koog of bekijk de beste verkoopmakelaars in De Koog als referentie bij jouw keuze.
Makelaars maken scherpere voorstellen als ze weten dat je vergelijkt — vraag offertes aan voor verkoop of aankoop.
Short answers about housing prices, sold homes and comparing real estate agents in De Koog.
The costs of a real estate agent in De Koog vary per office, property type and sales approach. Therefore, compare multiple quotes and also look at the real estate agents in De Koog to better compare rates, presentation and local experience.
On this page we currently show 19 sold houses in De Koog from our selection. This helps you to better assess recent transactions and the local housing market.
Houses sold in De Koog give insight into asking prices, house types and neighborhoods where recent transactions have taken place. Compare this also with the current housing stock in De Koog to better understand the market.
You can use sold homes as a first market indication, but a local real estate agent can better take into account finishing, location, maintenance and current demand in De Koog.
Vergelijk makelaars in De Koog op lokale verkoopervaring, reviews, verwachte opbrengst, courtage en marketingaanpak. Bekijk verkoopmakelaars in De Koog of de top 10 makelaars in De Koog om snel sterke kantoren te ontdekken.
View current location data on residents, WOZ development, housing stock, energy consumption, business activity and safety in De Koog. In 2025 were there 1.343 residents. The average WOZ value in 2025 is EUR 465.644.
These figures help to better assess and compare the housing stock in De Koog with recent sold homes. Orient yourself then on suitable top real estate agents in De Koog for sales advice in this region.
Residents
1.343
Last year: 2025
Average WOZ
EUR 465.644
Last year: 2025
Average income per person.
EUR 31.232
Source: AllNumbers
Crimes (current year)
96
Total registered
| Year | Residents |
|---|---|
| 2021 | 1.372 |
| 2022 | 1.361 |
| 2023 | 1.377 |
| 2024 | 1.357 |
| 2025 | 1.343 |
| Year | Average WOZ |
|---|---|
| 2021 | EUR 369.603 |
| 2022 | EUR 382.363 |
| 2023 | EUR 422.182 |
| 2024 | EUR 448.579 |
| 2025 | EUR 465.644 |
Hoger
302
Praktisch
251
Middelbaar
499
Europa
167
Nederland
1.061
Buiten Europa
119
Label B
505
Label C
492
Label A
359
Label F
235
Label D
184
Label G
147
Label E
139
Label A+++
94
Label A+
63
Label A++++
25
Label A++
18
Label A+++++
1
| Year | Gas (m3) | Electricity (kWh) |
|---|---|---|
| 2020 | 1.601 | 3.152 |
| 2021 | 1.851 | 3.306 |
| 2022 | 1.468 | 3.083 |
| 2023 | 1.209 | 2.839 |
| 2024 | 1.175 | 2.919 |
Hoekwoning
Gas: 953 • Electricity: 2.050
Huurwoning
Gas: 939 • Electricity: 2.426
Koopwoning
Gas: 1.343 • Electricity: 3.082
Appartement
Gas: 698 • Electricity: 2.240
Tussenwoning
Gas: 839 • Electricity: 2.114
Vrijstaande woning
Gas: 1.522 • Electricity: 3.308
Twee-onder-één-kap woning
Gas: 1.479 • Electricity: 2.996
Total number of company establishments: 397
| Period | Crimes |
|---|---|
| jan 2025 | 6 |
| jan 2026 | 5 |
| jul 2025 | 12 |
| jun 2025 | 13 |
| mei 2025 | 12 |
| mrt 2025 | 4 |
| nov 2024 | 10 |
| nov 2025 | 7 |
| okt 2024 | 10 |
| okt 2025 | 5 |
| sep 2024 | 25 |
| sep 2025 | 13 |
These figures give an indicative picture of safety trends in the living environment of De Koog.
Short answers based on current local statistics, handy for a quick comparison of the living environment.
De Koog telt in 2025 ongeveer 1.343 inwoners.
De gemiddelde WOZ-waarde in De Koog is in 2025 circa € 465.644.
Het gemiddelde inkomen per inwoner in De Koog ligt rond € 31.232 per jaar.
Voor het huidige jaar gaat het om ongeveer 96 geregistreerde misdrijven. Gebruik deze cijfers als indicatie en vergelijk trends per periode.
In De Koog komt vooral "Vrijstaande woningen" veel voor, met ongeveer 347 woningen.