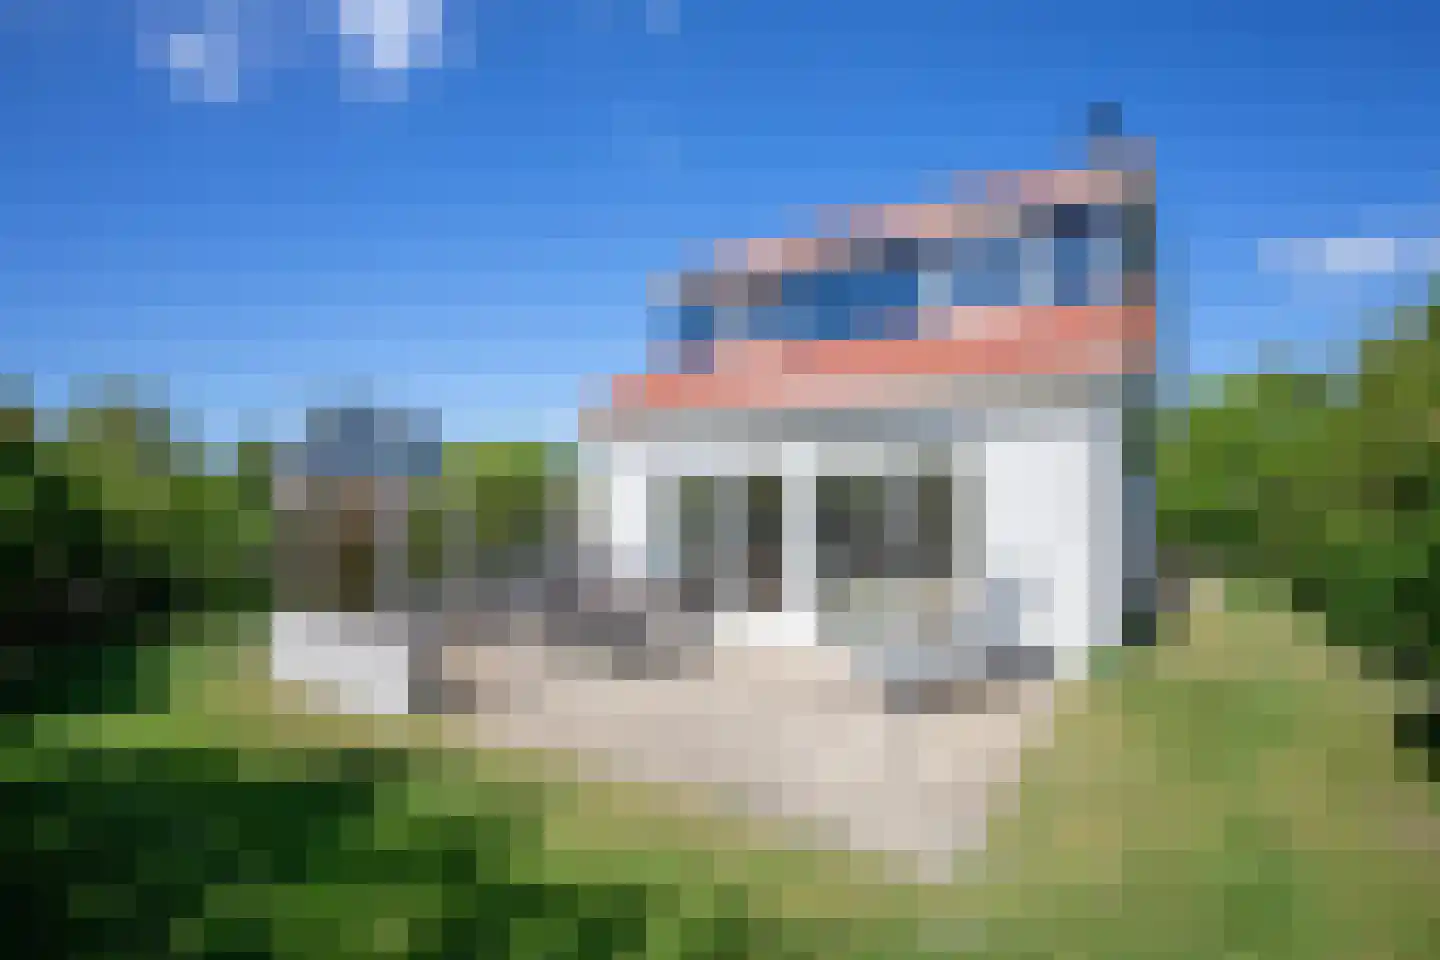
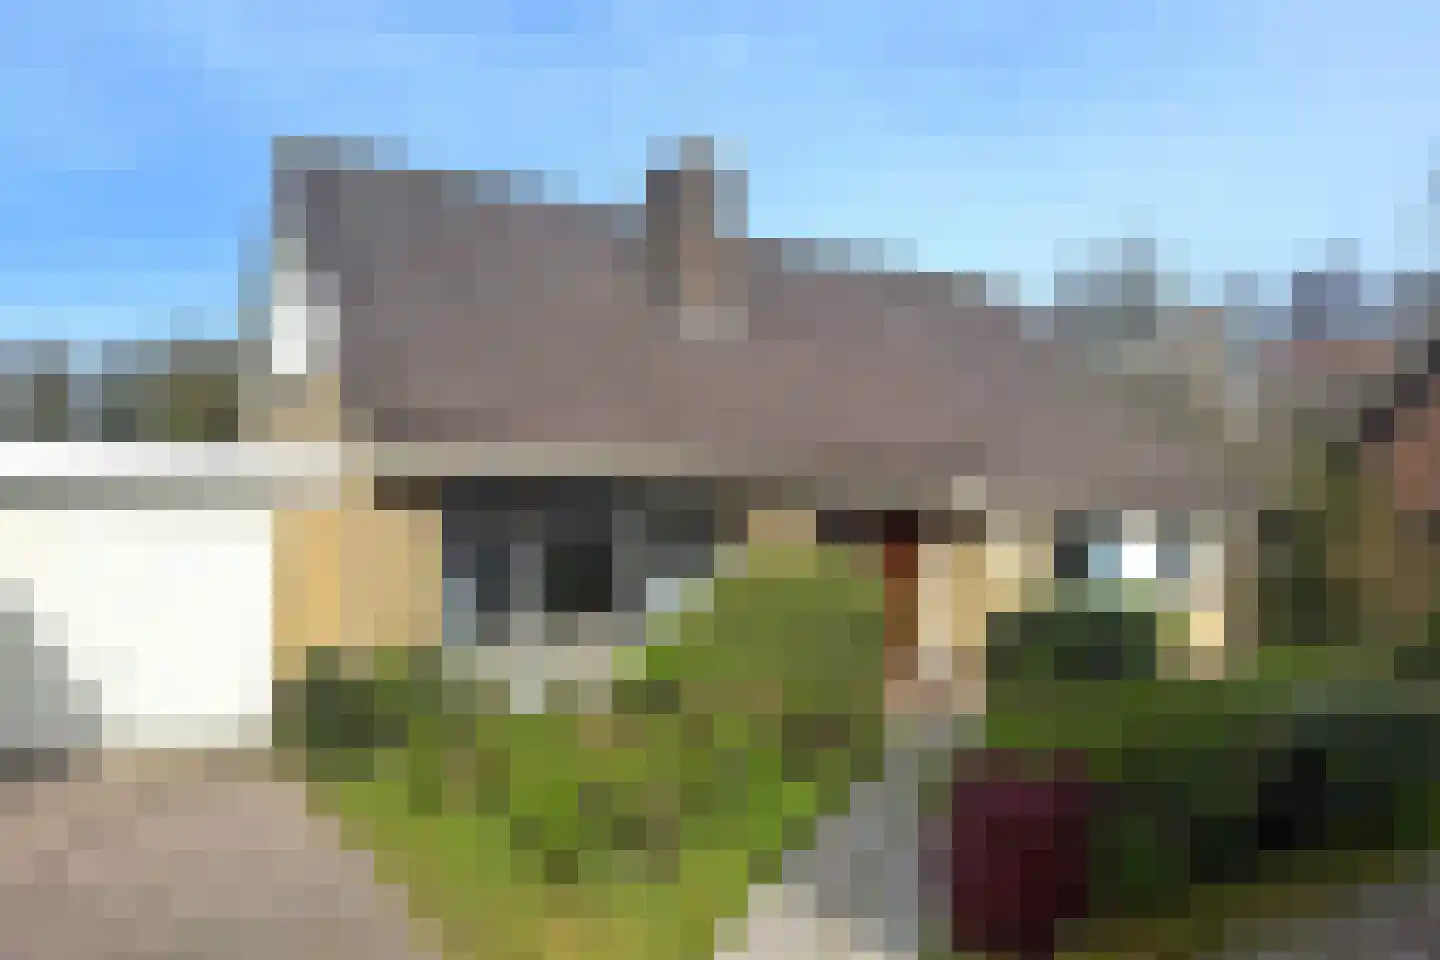
Housing offer in De Koog

Searching in 72 houses in De Koog

Connected to: Vastgoed Nederland NVM Makelaars

View the current housing stock in De Koog and quickly filter by price, living area, rooms and more. There are currently 72 houses in this place within our selection. View also 19 sold houses in De Koog for extra insight into the local housing market.

Selection

Search and filter homes

Set your preferences and discover homes that suit you.

Total supply 242.868
Filters

Set price, area and other characteristics. Adjust a filter or click on Show homes. Location changes directly above.

Reset filters

You search for

  • Place De Koog

Selling a home in De Koog? Compare realtor offers

Get free quotes from real estate agents with local market knowledge. Compare more than 15 real estate agents in De Koog.

Free request a quote

  • Quotes in De Koog
  • Non-binding
  • Personal
  • Compare free rates

Selling a home in De Koog? Compare all real estate agents in De Koog or view the top 10 real estate agents in De Koog for extra context for your choice.

Compare multiple quotes

Real estate agents make sharper offers when they know you're comparing — ask for quotes for sale or purchase.

Frequently asked questions about homes in De Koog

Practical answers about housing supply, sales and comparing real estate agents in De Koog.

Residential and neighborhood statistics in De Koog

View current location data on residents, WOZ development, housing stock, energy consumption, business activity and safety in De Koog. In 2025 were there 1.343 residents. The average WOZ value in 2025 is EUR 465.644.

These figures help to better assess and compare the housing stock in De Koog with recent sold homes. Orient yourself then on suitable top real estate agents in De Koog for sales advice in this region.

Residents

1.343

Last year: 2025

Average WOZ

EUR 465.644

Last year: 2025

Average income per person.

EUR 31.232

Source: AllNumbers

Crimes (current year)

96

Total registered

Demographics and WOZ development

Inhabitants per year

Inhabitants per year in De Koog
Year Residents
2021 1.372
2022 1.361
2023 1.377
2024 1.357
2025 1.343

Annual WOZ value

WOZ value per year in De Koog
Year Average WOZ
2021 EUR 369.603
2022 EUR 382.363
2023 EUR 422.182
2024 EUR 448.579
2025 EUR 465.644

Composition of residents

Age build-up

65+: 332 0-15: 135 15-25: 133 25-45: 310 45-65: 430

Education level

Hoger

302

Praktisch

251

Middelbaar

499

Origin of residents (2025)

Europa

167

Nederland

1.061

Buiten Europa

119

Housing stock and construction periods

Types of homes

Hoekwoningen 39
Appartementen 297
Tussenwoningen 63
Vrijstaande woningen 347
Twee-onder-één-kap woningen 121

Construction period of buildings

Voor 1700 0
1700 tot 1900 24
1900 tot 1925 25
1925 tot 1950 109
1950 tot 1970 519
1970 tot 1980 204
1980 tot 1990 78
1990 tot 2000 378
2000 tot 2010 338
2010 tot 2020 239
2020 en later 65

Energy and sustainability

Energy label distribution

Label B

505

Label C

492

Label A

359

Label F

235

Label D

184

Label G

147

Label E

139

Label A+++

94

Label A+

63

Label A++++

25

Label A++

18

Label A+++++

1

Average energy consumption per year

Average energy consumption per year in De Koog
Year Gas (m3) Electricity (kWh)
2020 1.601 3.152
2021 1.851 3.306
2022 1.468 3.083
2023 1.209 2.839
2024 1.175 2.919

Consumption per house type

Hoekwoning

Gas: 953 • Electricity: 2.050

Huurwoning

Gas: 939 • Electricity: 2.426

Koopwoning

Gas: 1.343 • Electricity: 3.082

Appartement

Gas: 698 • Electricity: 2.240

Tussenwoning

Gas: 839 • Electricity: 2.114

Vrijstaande woning

Gas: 1.522 • Electricity: 3.308

Twee-onder-één-kap woning

Gas: 1.479 • Electricity: 2.996

Business activity in De Koog (2025)

Handel en HORECA 178
Nijverheid en energie 26
Zakelijke dienstverlening 76
Overheid, onderwijs en zorg 21
Landbouw, bosbouw en visserij 16
Vervoer, informatie en communicatie 13
Financiele diensten en onroerendgoed 29
Cultuur, recreatie en overige diensten 29

Total number of company establishments: 397

Recent crime statistics

Recent crime statistics in De Koog
Period Crimes
jan 2025 6
jan 2026 5
jul 2025 12
jun 2025 13
mei 2025 12
mrt 2025 4
nov 2024 10
nov 2025 7
okt 2024 10
okt 2025 5
sep 2024 25
sep 2025 13

These figures give an indicative picture of safety trends in the living environment of De Koog.

Frequently asked questions about living in De Koog

Short answers based on current local statistics, handy for a quick comparison of the living environment.

Hoeveel inwoners heeft De Koog?

De Koog telt in 2025 ongeveer 1.343 inwoners.

Wat is de gemiddelde WOZ-waarde in De Koog?

De gemiddelde WOZ-waarde in De Koog is in 2025 circa € 465.644.

Wat is het gemiddelde inkomen per inwoner in De Koog?

Het gemiddelde inkomen per inwoner in De Koog ligt rond € 31.232 per jaar.

Hoe veilig is wonen in De Koog?

Voor het huidige jaar gaat het om ongeveer 96 geregistreerde misdrijven. Gebruik deze cijfers als indicatie en vergelijk trends per periode.

Welke woningtypen komen het meest voor in De Koog?

In De Koog komt vooral "Vrijstaande woningen" veel voor, met ongeveer 347 woningen.

Receive free, non-binding quotes

Compare multiple real estate agents and choose the best match.