
Residents
22.040
Last year: 2025
3453MJ De Meern • Utrecht
€ 795.000 k.k.
Cost of copper (estimated): € 17.750
2% transfer tax (€ 15.900) + notary (€ 1.150) + valuation (€ 700)
Total incl. VAT: € 812.750
Purchase price /m²: € 4.732
Korne 15 in Veldhuizen is een royale geschakelde twee-onder-een-kapwoning met optimale energieprestaties en veel leefruimte. De woning heeft een diepe, zonnige tuin, eigen oprit en luxe bijbehorende comfortfasiliteiten zoals een jacuzzi. Het huis is uitgerust met zonnepanelen, heeft energielabel A en biedt via grote ramen een fijne verbinding tussen binnen en buiten. De ruime multifunctionele kamers, inclusief een luxueuze badkamer en open keuken, maken van het pand een toekomstbestendige woning met optimale dagelijkse faciliteiten in de buurt. De wijk is rustig en groen en bereikbaar via openbaar vervoer of autosnelweg.
€ 795.000
Cost of copper (estimated): € 17.750
2% transfer tax (€ 15.900) + notary (€ 1.150) + valuation (€ 700)
Total purchase (incl. p.p.): € 812.750
3,34%
Yearly
€ 39.750
Direct available
Estimated mortgage
Indicative gross monthly cost
Based on annuity and 30 year term
Indicative net monthly cost
iDisclaimer: this mortgage calculation is a simplified indication based on general assumptions. No rights can be derived from the results shown. Calculated with 10-annual interest (zonder NHG), automatically determined based on the price limit € 470.000. Source: 10-jaars rente uit mortgage_rates (16-06-2026 03:45). For non-NHG, an 80% mortgage of the market value has been used in this indication.
Douche, dubbele wastafel, toilet, wastafelmeubel, en whirlpool
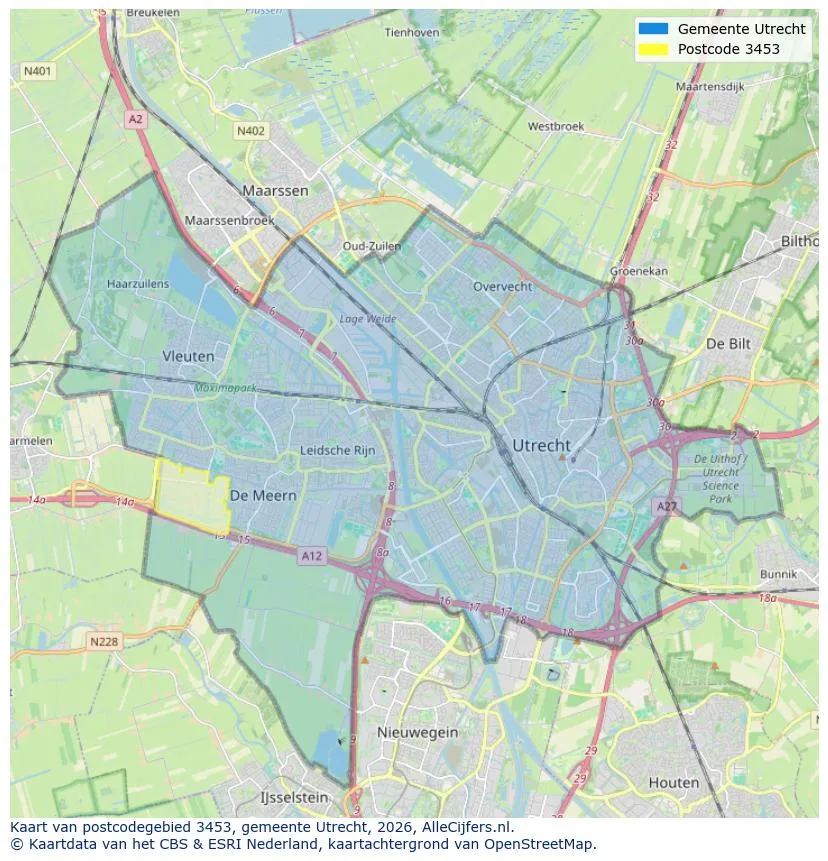
Geographic orientation and real estate agent density in De Meern
View current location data on residents, WOZ development, housing stock, energy consumption, business activity and safety in De Meern. In 2025 were there 22.040 residents. The average WOZ value in 2025 is EUR 578.098.
Residents
22.040
Last year: 2025
Average WOZ
EUR 578.098
Last year: 2025
Average income per person.
EUR 39.181
Source: AllNumbers
Crimes (current year)
900
Total registered
| Year | Residents |
|---|---|
| 2021 | 21.815 |
| 2022 | 21.825 |
| 2023 | 21.965 |
| 2024 | 21.980 |
| 2025 | 22.040 |
| Year | Average WOZ |
|---|---|
| 2021 | EUR 400.197 |
| 2022 | EUR 447.015 |
| 2023 | EUR 545.234 |
| 2024 | EUR 536.126 |
| 2025 | EUR 578.098 |
Hoger
6.850
Praktisch
3.740
Middelbaar
5.530
Europa
1.615
Nederland
15.565
Buiten Europa
4.865
Label A
3.517
Label B
2.648
Label C
1.305
Label D
427
Label E
335
Label F
237
Label A+
212
Label G
177
Label A+++
127
Label A++
71
Label A++++
39
Label A+++++
4
| Year | Gas (m3) | Electricity (kWh) |
|---|---|---|
| 2020 | 1.063 | 3.099 |
| 2021 | 1.213 | 3.175 |
| 2022 | 935 | 2.962 |
| 2023 | 810 | 2.756 |
| 2024 | 781 | 2.808 |
Hoekwoning
Gas: 892 • Electricity: 2.920
Huurwoning
Gas: 652 • Electricity: 2.003
Koopwoning
Gas: 869 • Electricity: 3.002
Appartement
Gas: 484 • Electricity: 1.810
Tussenwoning
Gas: 787 • Electricity: 2.649
Vrijstaande woning
Gas: 1.400 • Electricity: 4.762
Twee-onder-één-kap woning
Gas: 1.062 • Electricity: 3.374
Total number of company establishments: 3.355
| Period | Crimes |
|---|---|
| jan 2025 | 63 |
| jan 2026 | 91 |
| jul 2025 | 85 |
| jun 2025 | 77 |
| mei 2025 | 75 |
| mrt 2025 | 74 |
| nov 2024 | 94 |
| nov 2025 | 93 |
| okt 2024 | 92 |
| okt 2025 | 76 |
| sep 2024 | 61 |
| sep 2025 | 71 |
These figures give an indicative picture of safety trends in the living environment of De Meern.
Short answers based on current local statistics, handy for a quick comparison of the living environment.
De Meern telt in 2025 ongeveer 22.040 inwoners.
De gemiddelde WOZ-waarde in De Meern is in 2025 circa € 578.098.
Het gemiddelde inkomen per inwoner in De Meern ligt rond € 39.181 per jaar.
Voor het huidige jaar gaat het om ongeveer 900 geregistreerde misdrijven. Gebruik deze cijfers als indicatie en vergelijk trends per periode.
In De Meern komt vooral "Tussenwoningen" veel voor, met ongeveer 4.636 woningen.
View more homes in this location.
3454VR De Meern
€ 798.000 k.k.
€ 4.640/m²

3454JC De Meern
€ 2.850.000 k.k.
€ 5.172/m²

3453NZ De Meern
€ 585.000 k.k.
€ 3.874/m²

3454DT De Meern
€ 725.000 k.k.
€ 4.290/m²

3453SV De Meern
€ 450.000 k.k.
€ 5.056/m²

3453NX De Meern
€ 875.000 k.k.
€ 5.117/m²
3454AR De Meern
€ 550.000 k.k.
€ 3.741/m²

3454AV De Meern
€ 775.000 k.k.
€ 4.936/m²
