- Sold
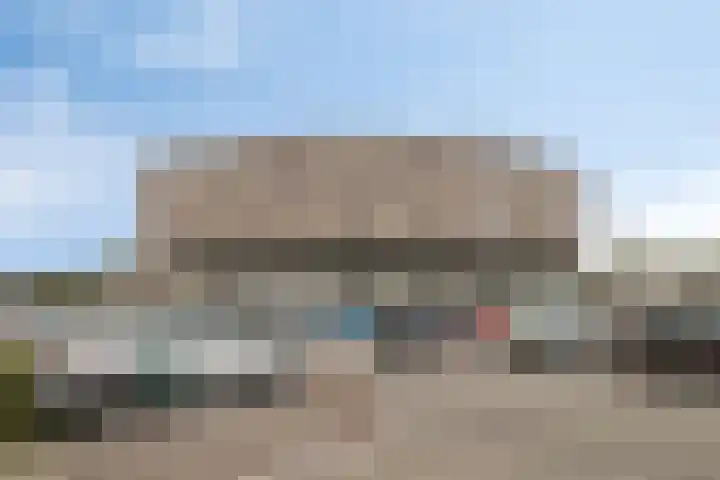
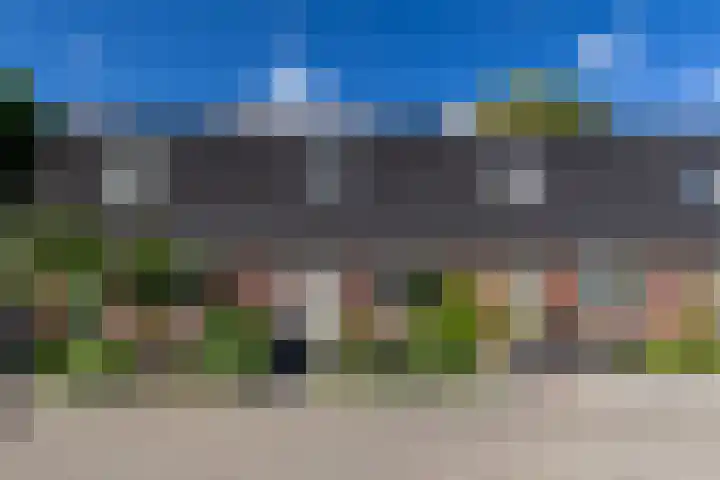
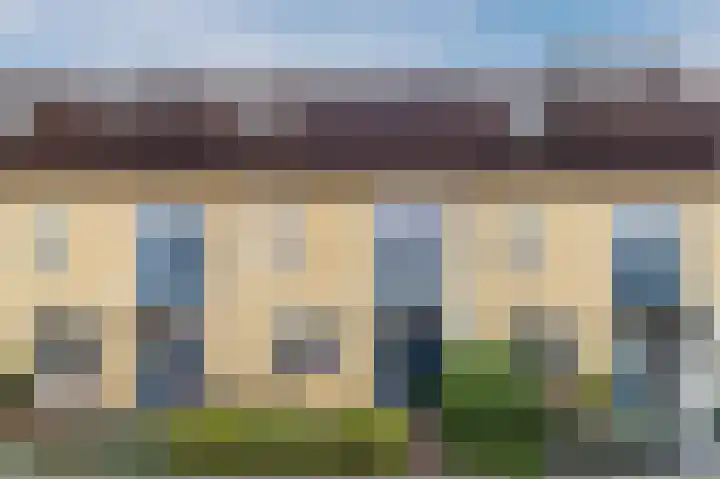
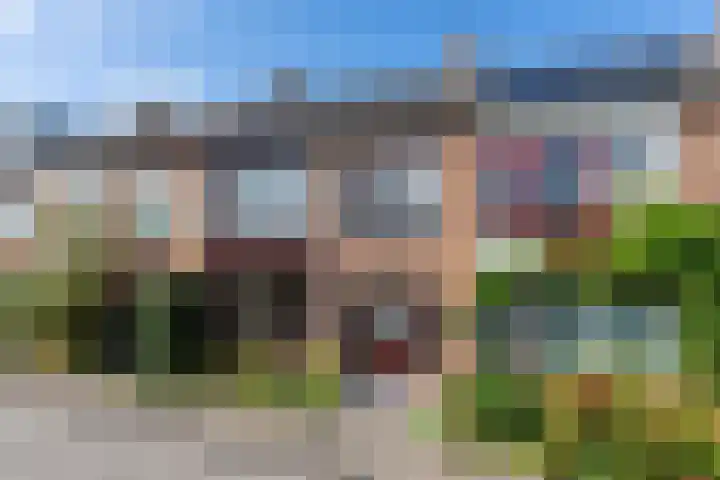
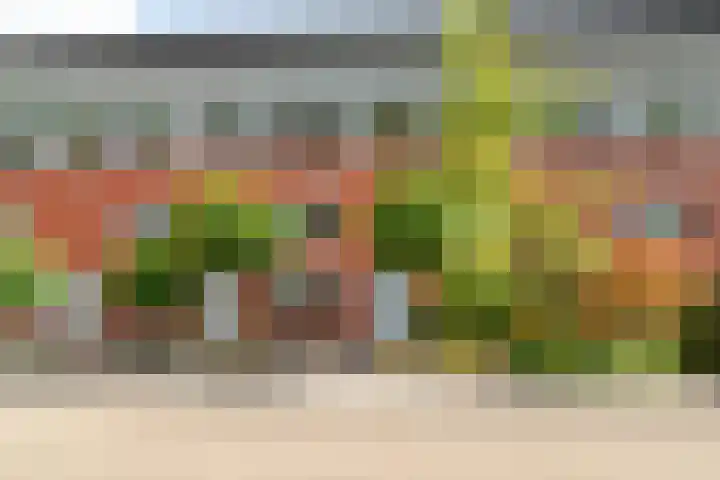
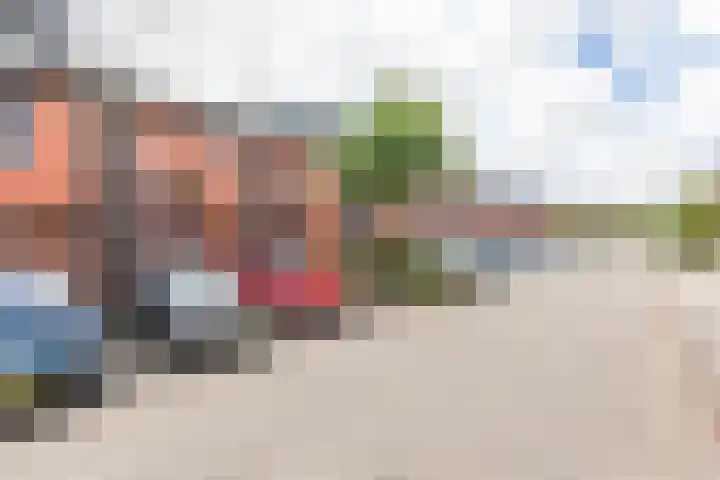
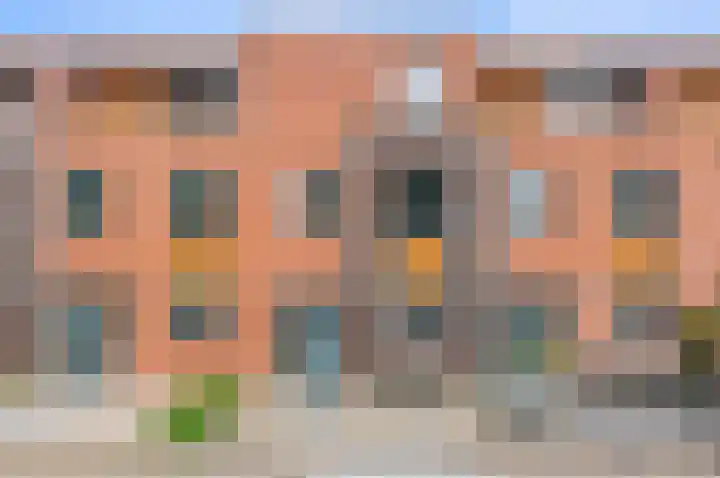
Schimmelpenninck van der Oyeweg 40
2645ND Delfgauw
€ 499.000 k.k.
€ 5.252/m²
- Living area
- 95 m²
- Land area
- 166 m²
- Bedrooms
- 3
View 70 sold houses in Delfgauw
Type to search. Use arrow down and arrow up to navigate through results and press Enter to open.
Hidden search suggestions.
Compare sold homes in Delfgauw or view the current offering in this location directly.
On this page you will find recently sold homes in Delfgauw. Use this overview to better estimate selling prices, popular neighborhoods, and the local housing supply before you choose a real estate agent. Also view the current housing supply with 91 houses in Delfgauw.
2645ND Delfgauw
€ 499.000 k.k.
€ 5.252/m²
2645KW Delfgauw
€ 585.000 k.k.
€ 4.398/m²
2645HK Delfgauw
€ 565.000 k.k.
€ 5.136/m²
2645EZ Delfgauw
€ 399.000 k.k.
€ 5.115/m²
2645MH Delfgauw
€ 649.000 k.k.
€ 4.992/m²
2645NJ Delfgauw
€ 450.000 k.k.
€ 5.844/m²
2645MC Delfgauw
€ 825.000 k.k.
€ 4.411/m²
2645MC Delfgauw
€ 865.000 k.k.
€ 4.675/m²
2645HC Delfgauw
€ 598.000 k.k.
€ 4.784/m²
2645NM Delfgauw
€ 495.000 k.k.
€ 4.194/m²
2645GS Delfgauw
€ 625.000 k.k.
€ 4.562/m²
2645GR Delfgauw
€ 415.000 k.k.
€ 5.763/m²
2645AP Delfgauw
€ 425.000 k.k.
€ 4.941/m²
2645GC Delfgauw
€ 795.000 k.k.
€ 4.818/m²
2645JN Delfgauw
€ 629.000 k.k.
€ 4.838/m²
2645JH Delfgauw
€ 500.000 k.k.
€ 0/m²
2645LP Delfgauw
€ 589.000 k.k.
€ 0/m²
2645NL Delfgauw
€ 425.000 k.k.
€ 0/m²
2645KC Delfgauw
€ 565.000 k.k.
€ 4.669/m²
2645GR Delfgauw
€ 415.000 k.k.
€ 5.763/m²
2645JH Delfgauw
€ 595.000 k.k.
€ 5.219/m²
2645AA Delfgauw
€ 785.000 k.k.
€ 5.304/m²
2645AT Delfgauw
€ 895.000 k.k.
€ 4.735/m²
2645JN Delfgauw
€ 625.000 k.k.
€ 4.401/m²
2645GG Delfgauw
€ 465.000 k.k.
€ 5.406/m²
2645GC Delfgauw
€ 575.000 k.k.
€ 5.000/m²
2645NL Delfgauw
€ 495.000 k.k.
€ 4.267/m²
2645GB Delfgauw
€ 720.000 k.k.
€ 5.217/m²
Get free quotes from realtors with local market knowledge in Delfgauw.
Selling a home in Delfgauw? Compare real estate agents who know the local housing market. Also check out all real estate agents in Delfgauw or the top 10 real estate agents in Delfgauw for extra context for your choice.
By comparing brokers and requesting quotes
Short answers about housing prices, sold homes and comparing real estate agents in Delfgauw.
The costs of a real estate agent in Delfgauw vary per office, property type and sales approach. Therefore, compare multiple quotes and also look at the real estate agents in Delfgauw to better compare rates, presentation and local experience.
On this page we currently show 70 sold houses in Delfgauw from our selection. This helps you to better assess recent transactions and the local housing market.
Houses sold in Delfgauw give insight into asking prices, house types and neighborhoods where recent transactions have taken place. Compare this also with the current housing stock in Delfgauw to better understand the market.
You can use sold homes as a first market indication, but a local real estate agent can better take into account finishing, location, maintenance and current demand in Delfgauw.
Compare realtors in Delfgauw on local sales experience, reviews, expected yield, commission and marketing approach. The top 10 realtors in Delfgauw helps to quickly discover strong offices.
View current location data on residents, WOZ development, housing stock, energy consumption, business activity and safety in Delfgauw. In 2025 were there 8.890 residents. The average WOZ value in 2025 is EUR 519.000.
These figures help to better assess and compare the housing stock in Delfgauw with recent sold homes. Orient yourself then on suitable top real estate agents in Delfgauw for sales advice in this region.
Residents
8.890
Last year: 2025
Average WOZ
EUR 519.000
Last year: 2025
Average income per person.
EUR 40.700
Source: AllNumbers
Crimes (current year)
242
Total registered
| Year | Residents |
|---|---|
| 2021 | 9.100 |
| 2022 | 9.065 |
| 2023 | 9.045 |
| 2024 | 8.975 |
| 2025 | 8.890 |
| Year | Average WOZ |
|---|---|
| 2021 | EUR 366.000 |
| 2022 | EUR 395.000 |
| 2023 | EUR 468.000 |
| 2024 | EUR 494.000 |
| 2025 | EUR 519.000 |
Hoger
3.030
Praktisch
1.350
Middelbaar
2.600
Europa
730
Nederland
6.545
Buiten Europa
1.615
Label A
1.419
Label B
1.209
Label C
276
Label A+
144
Label D
127
Label F
123
Label G
98
Label E
75
Label A++
47
Label A+++
37
Label A++++
5
Label A+++++
3
| Year | Gas (m3) | Electricity (kWh) |
|---|---|---|
| 2020 | 980 | 3.110 |
| 2021 | 1.100 | 3.180 |
| 2022 | 870 | 2.960 |
| 2023 | 750 | 2.720 |
| 2024 | 740 | 2.750 |
Hoekwoning
Gas: 890 • Electricity: 2.810
Huurwoning
Gas: 570 • Electricity: 2.020
Koopwoning
Gas: 810 • Electricity: 2.960
Appartement
Gas: 430 • Electricity: 1.880
Tussenwoning
Gas: 740 • Electricity: 2.730
Vrijstaande woning
Gas: 1.340 • Electricity: 4.440
Twee-onder-één-kap woning
Gas: 1.040 • Electricity: 3.520
Total number of company establishments: 1.195
| Period | Crimes |
|---|---|
| jan 2025 | 25 |
| jan 2026 | 26 |
| jul 2025 | 21 |
| jun 2025 | 22 |
| mei 2025 | 27 |
| mrt 2025 | 19 |
| nov 2024 | 19 |
| nov 2025 | 12 |
| okt 2024 | 25 |
| okt 2025 | 21 |
| sep 2024 | 32 |
| sep 2025 | 22 |
These figures give an indicative picture of safety trends in the living environment of Delfgauw.
Short answers based on current local statistics, handy for a quick comparison of the living environment.
Delfgauw telt in 2025 ongeveer 8.890 inwoners.
De gemiddelde WOZ-waarde in Delfgauw is in 2025 circa € 519.000.
Het gemiddelde inkomen per inwoner in Delfgauw ligt rond € 40.700 per jaar.
Voor het huidige jaar gaat het om ongeveer 242 geregistreerde misdrijven. Gebruik deze cijfers als indicatie en vergelijk trends per periode.
In Delfgauw komt vooral "Tussenwoningen" veel voor, met ongeveer 1.744 woningen.