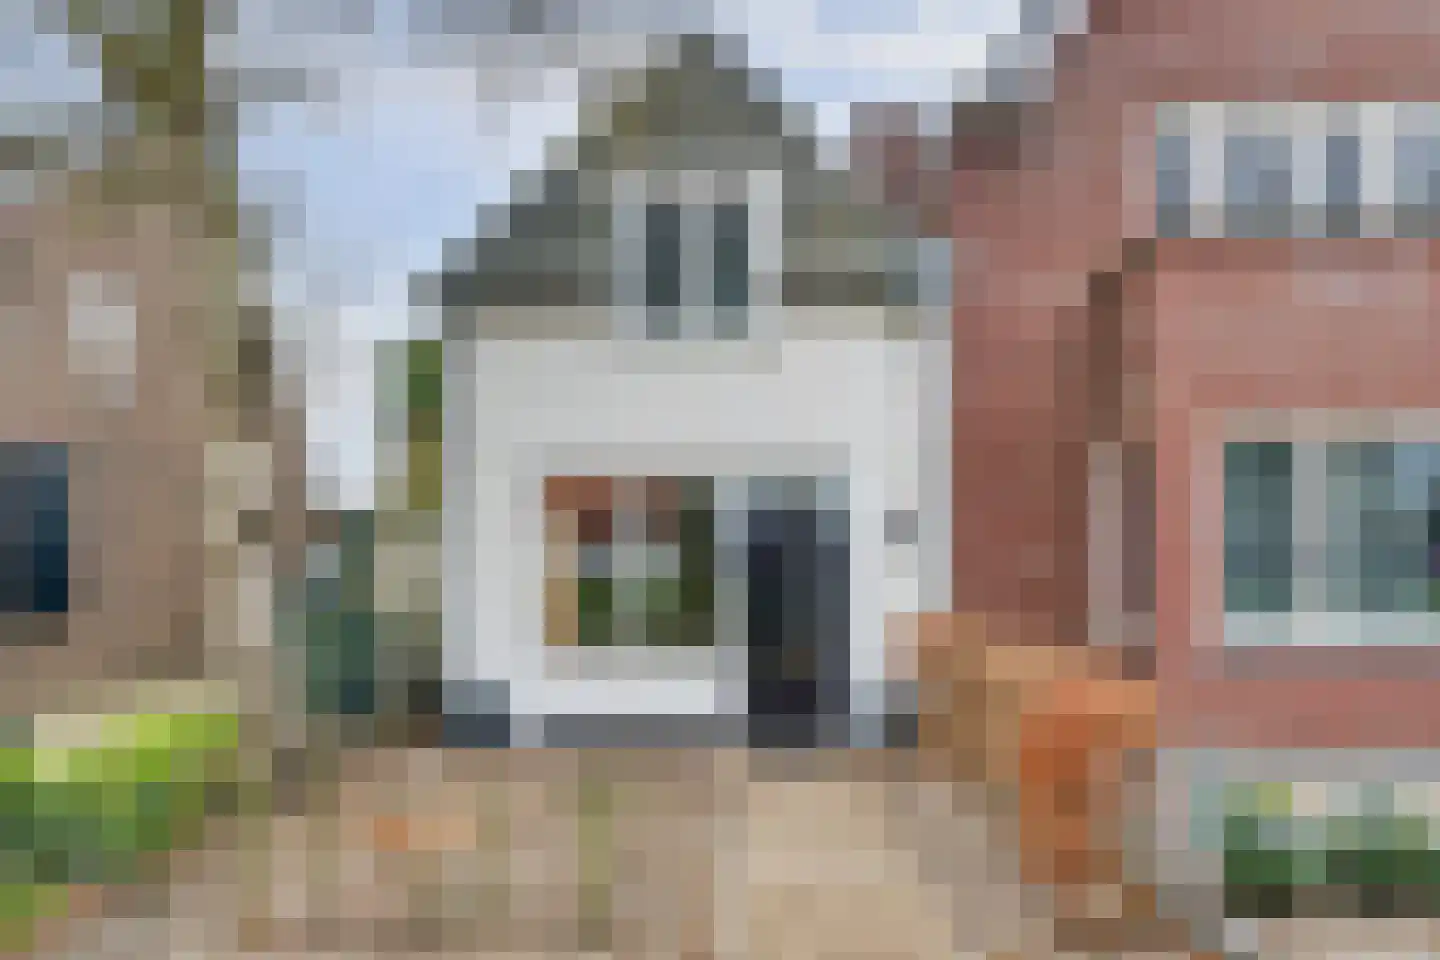
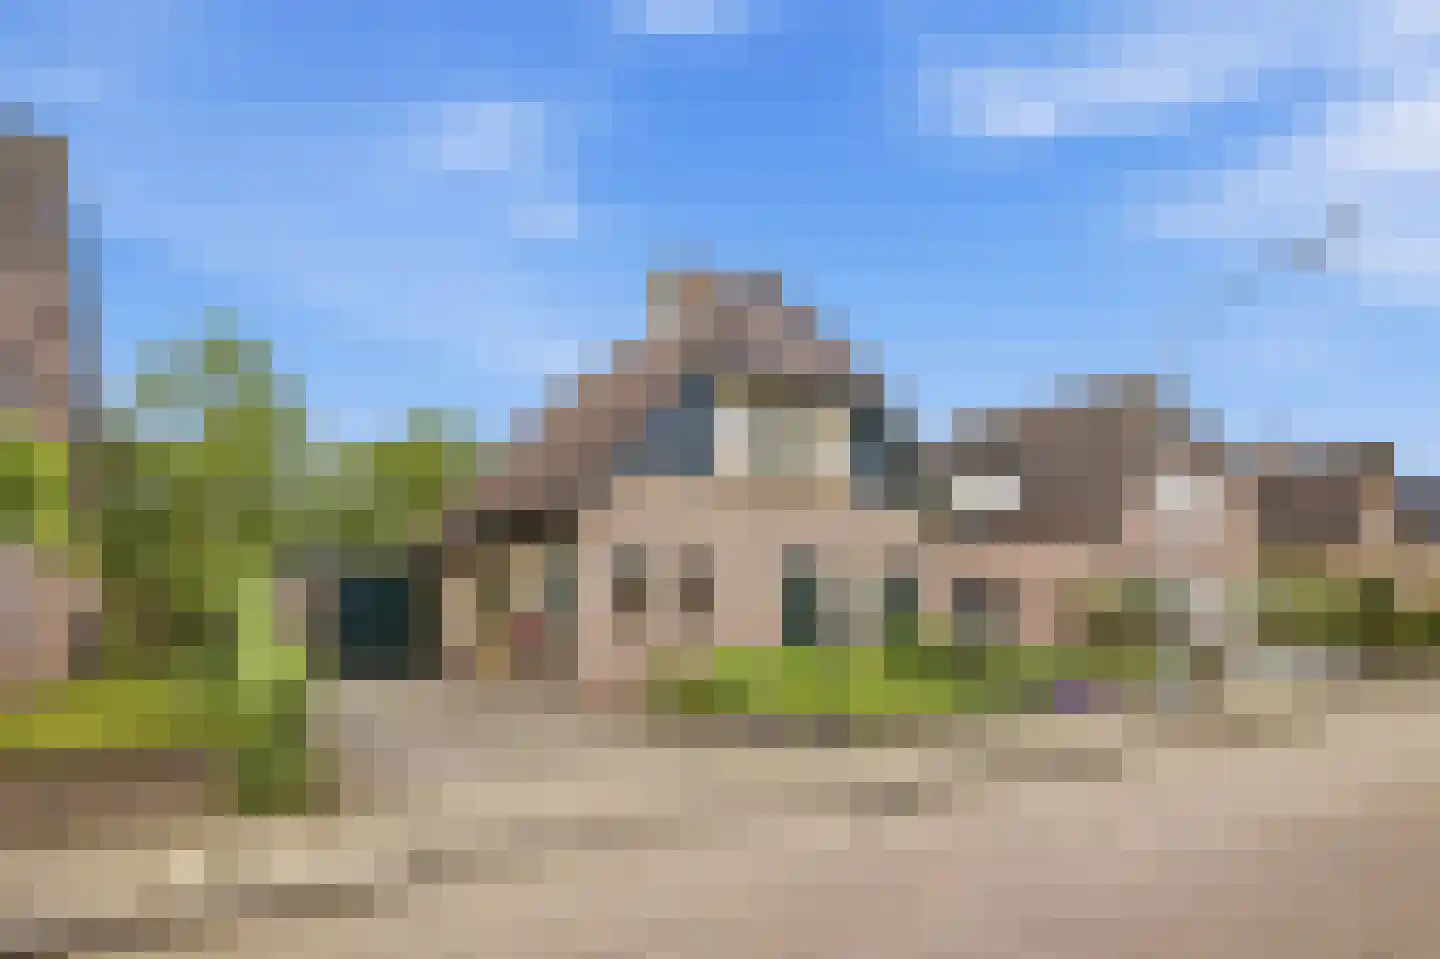
Housing offer in Den Hout

Searching in 14 houses in Den Hout

Connected to: Vastgoed Nederland NVM Makelaars

View the current housing stock in Den Hout and quickly filter by price, living area, rooms and more. There are currently 14 houses in this place within our selection. View also 10 sold houses in Den Hout for extra insight into the local housing market.

Selection

Search and filter homes

Set your preferences and discover homes that suit you.

Total supply 244.789
Filters

Set price, area and other characteristics. Adjust a filter or click on Show homes. Location changes directly above.

Reset filters

You search for

  • Place Den Hout

Selling a home in Den Hout? Compare realtor offers

Get free quotes from real estate agents with local market knowledge. Compare more than 87 real estate agents in Den Hout.

Free request a quote

  • Quotes in Den Hout
  • Non-binding
  • Personal
  • Compare free rates

Selling a home in Den Hout? Compare all real estate agents in Den Hout or view the top 10 real estate agents in Den Hout for extra context for your choice.

Compare multiple quotes

Real estate agents make sharper offers when they know you're comparing — ask for quotes for sale or purchase.

Frequently asked questions about homes in Den Hout

Practical answers about housing supply, sales and comparing real estate agents in Den Hout.

Residential and neighborhood statistics in Den Hout

View current location data on residents, WOZ development, housing stock, energy consumption, business activity and safety in Den Hout. In 2025 were there 1.285 residents. The average WOZ value in 2025 is EUR 643.000.

These figures help to better assess and compare the housing stock in Den Hout with recent sold homes. Orient yourself then on suitable top real estate agents in Den Hout for sales advice in this region.

Residents

1.285

Last year: 2025

Average WOZ

EUR 643.000

Last year: 2025

Average income per person.

EUR 39.800

Source: AllNumbers

Crimes (current year)

85

Total registered

Demographics and WOZ development

Inhabitants per year

Inhabitants per year in Den Hout
Year Residents
2021 1.240
2022 1.270
2023 1.275
2024 1.270
2025 1.285

Annual WOZ value

WOZ value per year in Den Hout
Year Average WOZ
2021 EUR 497.000
2022 EUR 523.000
2023 EUR 580.000
2024 EUR 598.000
2025 EUR 643.000

Composition of residents

Age build-up

65+: 250 0-15: 190 15-25: 170 25-45: 200 45-65: 475

Education level

Hoger

330

Praktisch

200

Middelbaar

470

Origin of residents (2025)

Europa

55

Nederland

1.185

Buiten Europa

45

Housing stock and construction periods

Types of homes

Hoekwoningen 38
Tussenwoningen 53
Vrijstaande woningen 290
Twee-onder-één-kap woningen 113

Construction period of buildings

Voor 1700 3
1700 tot 1900 26
1900 tot 1925 23
1925 tot 1950 62
1950 tot 1970 88
1970 tot 1980 90
1980 tot 1990 49
1990 tot 2000 90
2000 tot 2010 36
2010 tot 2020 44
2020 en later 22

Energy and sustainability

Energy label distribution

Label B

109

Label A

97

Label C

94

Label G

66

Label D

50

Label F

47

Label E

18

Label A+++

9

Label A+

4

Label A++

2

Label A++++

1

Label A+++++

0

Average energy consumption per year

Average energy consumption per year in Den Hout
Year Gas (m3) Electricity (kWh)
2020 1.800 4.280
2021 2.040 4.340
2022 1.510 4.140
2023 1.270 3.860
2024 1.240 4.010

Consumption per house type

Hoekwoning

Gas: 1.000 • Electricity: 2.900

Huurwoning

Gas: 1.090 • Electricity: 2.310

Koopwoning

Gas: 1.290 • Electricity: 4.010

Tussenwoning

Gas: 900 • Electricity: 2.530

Vrijstaande woning

Gas: 1.400 • Electricity: 4.320

Twee-onder-één-kap woning

Gas: 1.220 • Electricity: 3.680

Business activity in Den Hout (2025)

Handel en HORECA 35
Nijverheid en energie 40
Zakelijke dienstverlening 65
Overheid, onderwijs en zorg 35
Landbouw, bosbouw en visserij 25
Vervoer, informatie en communicatie 20
Financiele diensten en onroerendgoed 15
Cultuur, recreatie en overige diensten 30

Total number of company establishments: 270

Recent crime statistics

Recent crime statistics in Den Hout
Period Crimes
jan 2026 7
jul 2025 9
jun 2025 5
mei 2025 6
mrt 2025 11
mrt 2026 11
nov 2024 3
nov 2025 5
okt 2024 7
okt 2025 4
sep 2024 7
sep 2025 4

These figures give an indicative picture of safety trends in the living environment of Den Hout.

Frequently asked questions about living in Den Hout

Short answers based on current local statistics, handy for a quick comparison of the living environment.

Hoeveel inwoners heeft Den Hout?

Den Hout telt in 2025 ongeveer 1.285 inwoners.

Wat is de gemiddelde WOZ-waarde in Den Hout?

De gemiddelde WOZ-waarde in Den Hout is in 2025 circa € 643.000.

Wat is het gemiddelde inkomen per inwoner in Den Hout?

Het gemiddelde inkomen per inwoner in Den Hout ligt rond € 39.800 per jaar.

Hoe veilig is wonen in Den Hout?

Voor het huidige jaar gaat het om ongeveer 85 geregistreerde misdrijven. Gebruik deze cijfers als indicatie en vergelijk trends per periode.

Welke woningtypen komen het meest voor in Den Hout?

In Den Hout komt vooral "Vrijstaande woningen" veel voor, met ongeveer 290 woningen.

Receive free, non-binding quotes

Compare multiple real estate agents and choose the best match.