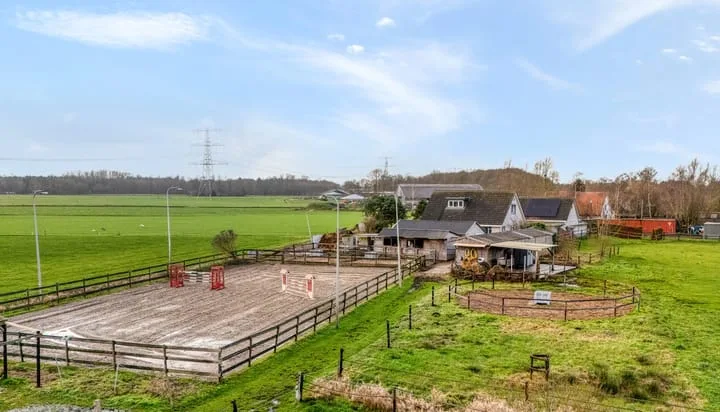
- Sold
Prieswijk 44
7916RD Elim
€ 350.000 k.k.
€ 3.465/m²
- Living area
- 101 m²
- Land area
- 280 m²
- Bedrooms
- 3
View 12 sold houses in Elim
Type to search. Use arrow down and arrow up to navigate through results and press Enter to open.
Hidden search suggestions.
Compare sold homes in Elim or view the current offering in this location directly.
On this page you will find recently sold homes in Elim. Use this overview to better estimate selling prices, popular neighborhoods, and the local housing supply before you choose a real estate agent. Also view the current housing supply with 20 houses in Elim.
7916RD Elim
€ 350.000 k.k.
€ 3.465/m²
7916VM Elim
€ 525.000 k.k.
€ 3.977/m²
7916PA Elim
€ 399.500 k.k.
€ 3.443/m²
7916TE Elim
€ 685.000 k.k.
€ 5.569/m²
7916TR Elim
€ 265.000 k.k.
€ 3.897/m²
7916TD Elim
€ 520.000 k.k.
€ 3.939/m²
7916PJ Elim
€ 225.000 k.k.
€ 0/m²
7916PD Elim
€ 425.000 k.k.
€ 0/m²
7916PP Elim
€ 255.000 k.k.
€ 2.833/m²
7916RD Elim
€ 375.000 k.k.
€ 3.826/m²
7916PA Elim
€ 350.000 k.k.
€ 3.500/m²
7916PC Elim
€ 325.000 k.k.
€ 3.009/m²
Bekijk recente verkopen en ontvang gratis offertes van lokale makelaars. Vergelijk meer dan 21 makelaars in Elim.
Zelf je woning verkopen in Elim? Vergelijk verkoopmakelaars in Elim of bekijk de beste verkoopmakelaars in Elim als referentie bij jouw keuze.
Makelaars maken scherpere voorstellen als ze weten dat je vergelijkt — vraag offertes aan voor verkoop of aankoop.
Short answers about housing prices, sold homes and comparing real estate agents in Elim.
De kosten van een makelaar in Elim verschillen per kantoor, woningtype en verkoopaanpak. In Elim kun je 21 real estate agents vergelijken; bekijk daarom ook de makelaars in Elim om tarieven, presentatie en lokale ervaring beter naast elkaar te zetten.
On this page we currently show 12 sold houses in Elim from our selection. This helps you to better assess recent transactions and the local housing market.
Houses sold in Elim give insight into asking prices, house types and neighborhoods where recent transactions have taken place. Compare this also with the current housing stock in Elim to better understand the market.
You can use sold homes as a first market indication, but a local real estate agent can better take into account finishing, location, maintenance and current demand in Elim.
Vergelijk de 21 real estate agents in Elim op lokale verkoopervaring, reviews, verwachte opbrengst, courtage en marketingaanpak. Bekijk verkoopmakelaars in Elim of de top 10 makelaars in Elim om snel sterke kantoren te ontdekken.
View current location data on residents, WOZ development, housing stock, energy consumption, business activity and safety in Elim. In 2026 were there 2.489 residents. The average WOZ value in 2025 is EUR 320.582.
These figures help to better assess and compare the housing stock in Elim with recent sold homes. Orient yourself then on suitable top real estate agents in Elim for sales advice in this region.
Residents
2.489
Last year: 2026
Average WOZ
EUR 320.582
Last year: 2025
Average income per person.
EUR 27.111
Source: AllNumbers
Crimes (current year)
57
Total registered
| Year | Residents |
|---|---|
| 2021 | 2.419 |
| 2022 | 2.364 |
| 2023 | 2.414 |
| 2024 | 2.413 |
| 2025 | 2.440 |
| 2026 | 2.489 |
| Year | Average WOZ |
|---|---|
| 2021 | EUR 225.447 |
| 2022 | EUR 248.124 |
| 2023 | EUR 286.996 |
| 2024 | EUR 306.063 |
| 2025 | EUR 320.582 |
Hoger
222
Praktisch
640
Middelbaar
860
Europa
80
Nederland
2.294
Buiten Europa
57
Label A
219
Label C
171
Label B
141
Label D
135
Label G
132
Label F
97
Label E
49
Label A+
10
Label A+++
10
Label A++
5
Label A++++
0
Label A+++++
0
| Year | Gas (m3) | Electricity (kWh) |
|---|---|---|
| 2020 | 1.631 | 3.386 |
| 2021 | 1.795 | 3.363 |
| 2022 | 1.425 | 3.204 |
| 2023 | 1.138 | 3.137 |
| 2024 | 1.102 | 3.231 |
Hoekwoning
Gas: 730 • Electricity: 1.734
Huurwoning
Gas: 1.041 • Electricity: 2.487
Koopwoning
Gas: 1.189 • Electricity: 3.467
Appartement
Gas: 769 • Electricity: 1.811
Tussenwoning
Gas: 635 • Electricity: 1.751
Vrijstaande woning
Gas: 1.266 • Electricity: 3.732
Twee-onder-één-kap woning
Gas: 1.087 • Electricity: 2.881
Total number of company establishments: 308
| Period | Crimes |
|---|---|
| jan 2026 | 6 |
| jul 2025 | 4 |
| jun 2025 | 5 |
| mei 2025 | 4 |
| mrt 2025 | 6 |
| mrt 2026 | 1 |
| nov 2024 | 2 |
| nov 2025 | 3 |
| okt 2024 | 6 |
| okt 2025 | 6 |
| sep 2024 | 4 |
| sep 2025 | 4 |
These figures give an indicative picture of safety trends in the living environment of Elim.
Short answers based on current local statistics, handy for a quick comparison of the living environment.
Elim telt in 2026 ongeveer 2.489 inwoners.
De gemiddelde WOZ-waarde in Elim is in 2025 circa € 320.582.
Het gemiddelde inkomen per inwoner in Elim ligt rond € 27.111 per jaar.
Voor het huidige jaar gaat het om ongeveer 57 geregistreerde misdrijven. Gebruik deze cijfers als indicatie en vergelijk trends per periode.
In Elim komt vooral "Vrijstaande woningen" veel voor, met ongeveer 460 woningen.