- Sold
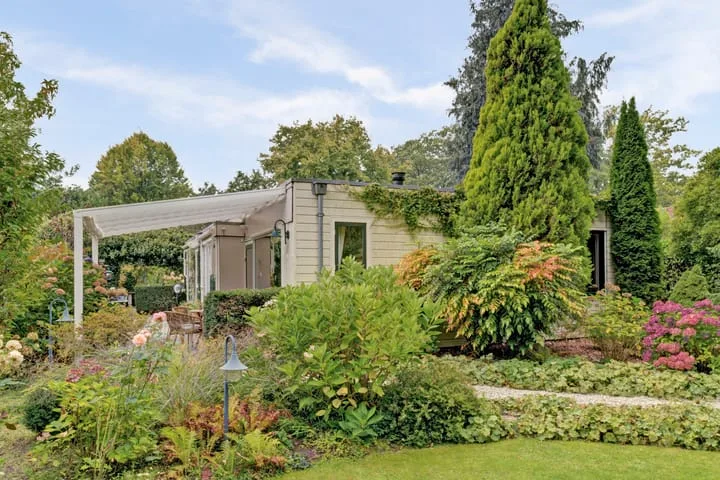
Bernhaldelaan 30
6955BR Ellecom
€ 635.000 k.k.
€ 5.000/m²
C
Save as favorite
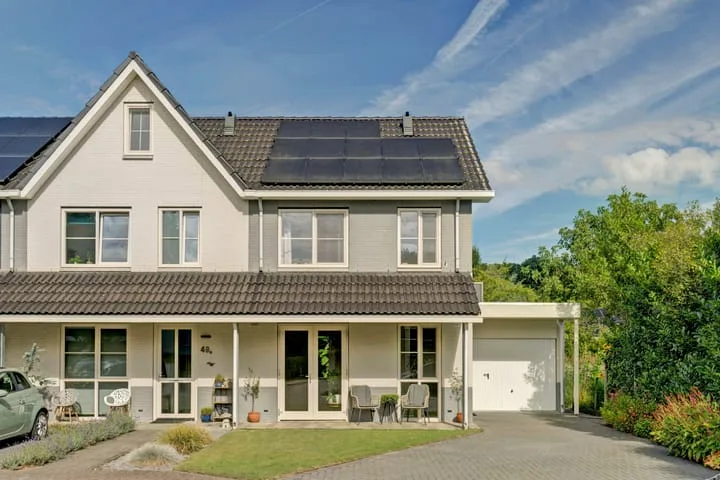
- Living area
- 127 m²
- Land area
- 425 m²
- Bedrooms
- 4