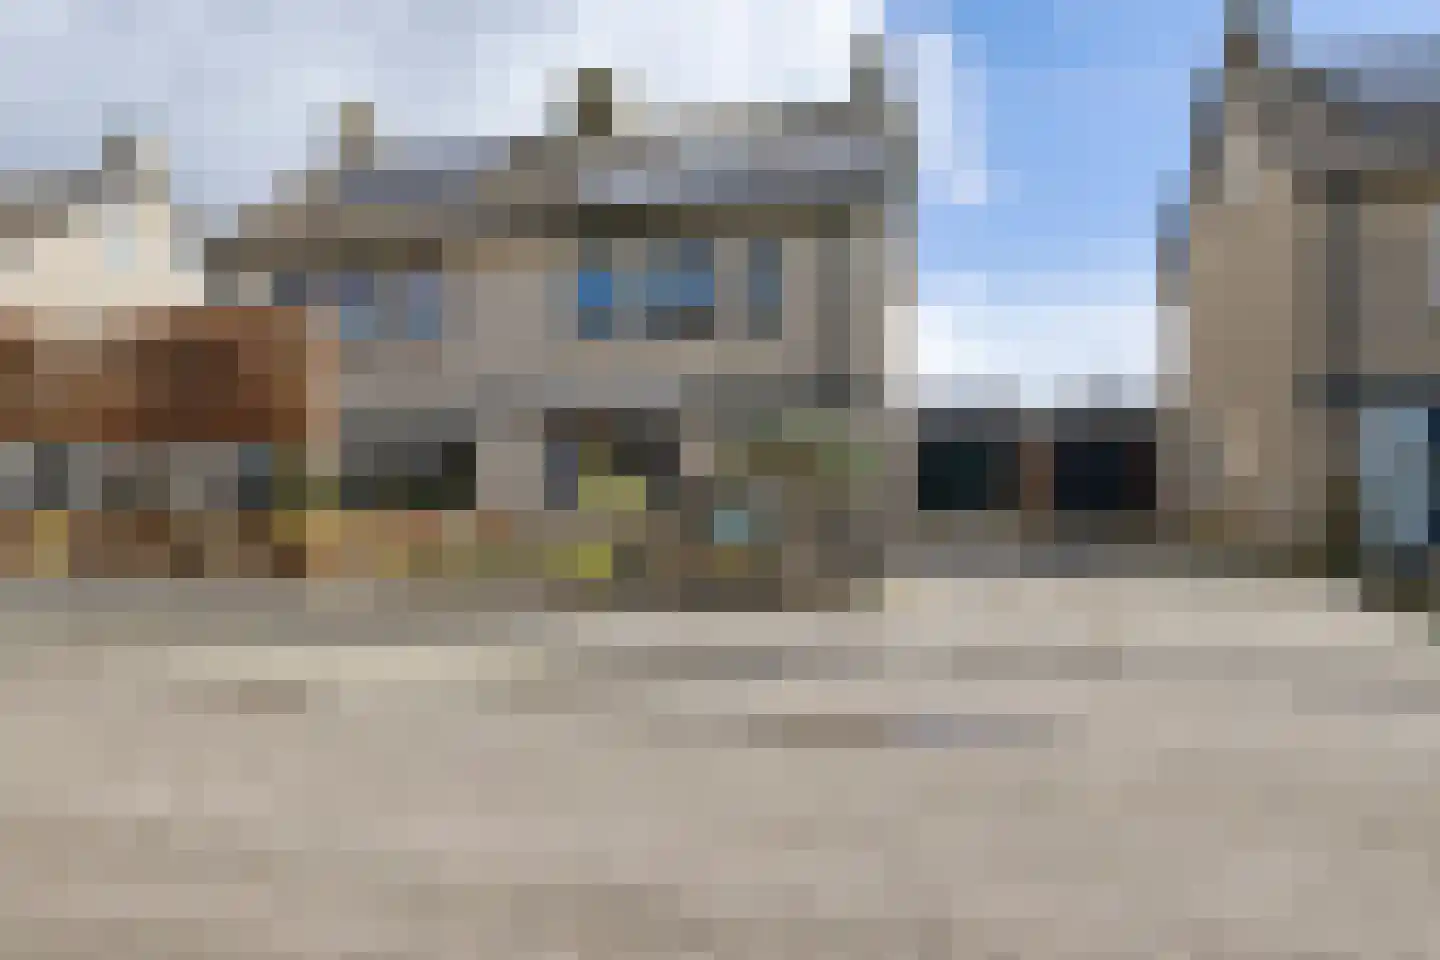
- Available
Noorderrand 32
8311AX Espel
€ 289.000 k.k.
€ 3.042/m²
- Living area
- 95 m²
- Land area
- 337 m²
- Bedrooms
- 3
Searching in 22 houses in Espel
Type to search. Use arrow down and arrow up to navigate through results and press Enter to open.
Hidden search suggestions.
View current properties in Espel or search targeted on street, postal code and property characteristics.
View the current housing stock in Espel and quickly filter by price, living area, rooms and more. There are currently 22 houses in this place within our selection. View also 14 sold houses in Espel for extra insight into the local housing market.
8311AX Espel
€ 289.000 k.k.
€ 3.042/m²
8311AL Espel
€ 419.500 k.k.
€ 3.131/m²
8311BJ Espel
€ 750.000 k.k.
€ 4.688/m²
8311BB Espel
€ 479.500 k.k.
€ 3.930/m²
8311BB Espel
€ 495.000 k.k.
€ 3.808/m²
8311BE Espel
€ 549.000 k.k.
€ 2.678/m²
8311PW Espel
€ 325.000 k.k.
€ 3.963/m²
8311AZ Espel
€ 249.000 k.k.
€ 4.788/m²
8311BD Espel
€ 475.000 k.k.
€ 2.950/m²
8311PD Espel
€ 965.000 k.k.
€ 3.814/m²
8311PW Espel
€ 545.000 k.k.
€ 2.558/m²
8311RE Espel
€ 322.000 k.k.
€ 3.066/m²
8311BZ Espel
€ 257.500
€ 5.255/m²
8311BZ Espel
€ 254.500
€ 5.193/m²
8311BZ Espel
€ 262.500
€ 5.357/m²
8311BZ Espel
€ 257.500
€ 5.255/m²
8311BZ Espel
€ 247.500
€ 4.759/m²
8311BZ Espel
€ 249.500
€ 4.798/m²
8311BD Espel
€ 425.000 k.k.
€ 2.972/m²
8311AK Espel
€ 259.000 k.k.
€ 0/m²
8311AH Espel
€ 249.500 k.k.
€ 2.901/m²
8311AK Espel
€ 225.000 k.k.
€ 2.616/m²
Get free quotes from real estate agents with local market knowledge. Compare more than 17 real estate agents in Espel.
Selling a home in Espel? Compare all real estate agents in Espel or view the top 10 real estate agents in Espel for extra context for your choice.
Real estate agents make sharper offers when they know you're comparing — ask for quotes for sale or purchase.
Practical answers about housing supply, sales and comparing real estate agents in Espel.
The costs of a real estate agent in Espel depend on commission, setup costs, property presentation and the chosen service. Compare the 17 real estate agents in Espel via the real estate agent page and request multiple quotes to compare rates and approach well.
Within our selection, we are currently showing 22 houses in Espel. View also the sold houses in Espel to compare the current offering with recent transactions.
Take into account not only price and living area but also maintenance, energy label, location, outdoor space and sales status. This way you compare houses in Espel on more than just the asking price.
A local real estate agent knows the neighborhoods, recent transactions and demand in Espel. By comparing 17 real estate agents in the region you get a better insight into prices, sales strategy and expected yield; the top 10 in Espel provides a useful starting point.
Yes, when making a sales plan, a valuation in Espel is wise. You gain insight into a realistic asking price and can then compare offers from real estate agents specifically.
View current location data on residents, WOZ development, housing stock, energy consumption, business activity and safety in Espel. In 2026 were there 1.743 residents. The average WOZ value in 2025 is EUR 403.000.
These figures help to better assess and compare the housing stock in Espel with recent sold homes. Orient yourself then on suitable top real estate agents in Espel for sales advice in this region.
Residents
1.743
Last year: 2026
Average WOZ
EUR 403.000
Last year: 2025
Average income per person.
EUR 32.000
Source: AllNumbers
Crimes (current year)
20
Total registered
| Year | Residents |
|---|---|
| 2021 | 1.515 |
| 2022 | 1.575 |
| 2023 | 1.680 |
| 2024 | 1.720 |
| 2025 | 1.735 |
| 2026 | 1.743 |
| Year | Average WOZ |
|---|---|
| 2021 | EUR 288.000 |
| 2022 | EUR 310.000 |
| 2023 | EUR 363.000 |
| 2024 | EUR 387.000 |
| 2025 | EUR 403.000 |
Hoger
290
Praktisch
290
Middelbaar
720
Europa
200
Nederland
1.445
Buiten Europa
90
Label A
165
Label C
127
Label F
124
Label B
79
Label E
50
Label D
31
Label A+++
30
Label A+
10
Label G
9
Label A++++
9
Label A++
4
Label A+++++
0
| Year | Gas (m3) | Electricity (kWh) |
|---|---|---|
| 2020 | 1.630 | 3.570 |
| 2021 | 1.750 | 3.670 |
| 2022 | 1.340 | 3.570 |
| 2023 | 1.090 | 3.390 |
| 2024 | 1.010 | 3.410 |
Hoekwoning
Gas: 880 • Electricity: 2.940
Huurwoning
Gas: 1.050 • Electricity: 2.750
Koopwoning
Gas: 1.100 • Electricity: 3.580
Appartement
Gas: 820 • Electricity: 2.330
Tussenwoning
Gas: 810 • Electricity: 2.550
Vrijstaande woning
Gas: 1.570 • Electricity: 4.580
Twee-onder-één-kap woning
Gas: 920 • Electricity: 3.160
Total number of company establishments: 335
| Period | Crimes |
|---|---|
| jan 2026 | 2 |
| jul 2025 | 3 |
| jun 2025 | 1 |
| mei 2025 | 1 |
| mrt 2025 | 1 |
| mrt 2026 | 1 |
| nov 2024 | 3 |
| nov 2025 | 0 |
| okt 2024 | 6 |
| okt 2025 | 4 |
| sep 2024 | 0 |
| sep 2025 | 2 |
These figures give an indicative picture of safety trends in the living environment of Espel.
Short answers based on current local statistics, handy for a quick comparison of the living environment.
Espel telt in 2026 ongeveer 1.743 inwoners.
De gemiddelde WOZ-waarde in Espel is in 2025 circa € 403.000.
Het gemiddelde inkomen per inwoner in Espel ligt rond € 32.000 per jaar.
Voor het huidige jaar gaat het om ongeveer 20 geregistreerde misdrijven. Gebruik deze cijfers als indicatie en vergelijk trends per periode.
In Espel komt vooral "Vrijstaande woningen" veel voor, met ongeveer 226 woningen.