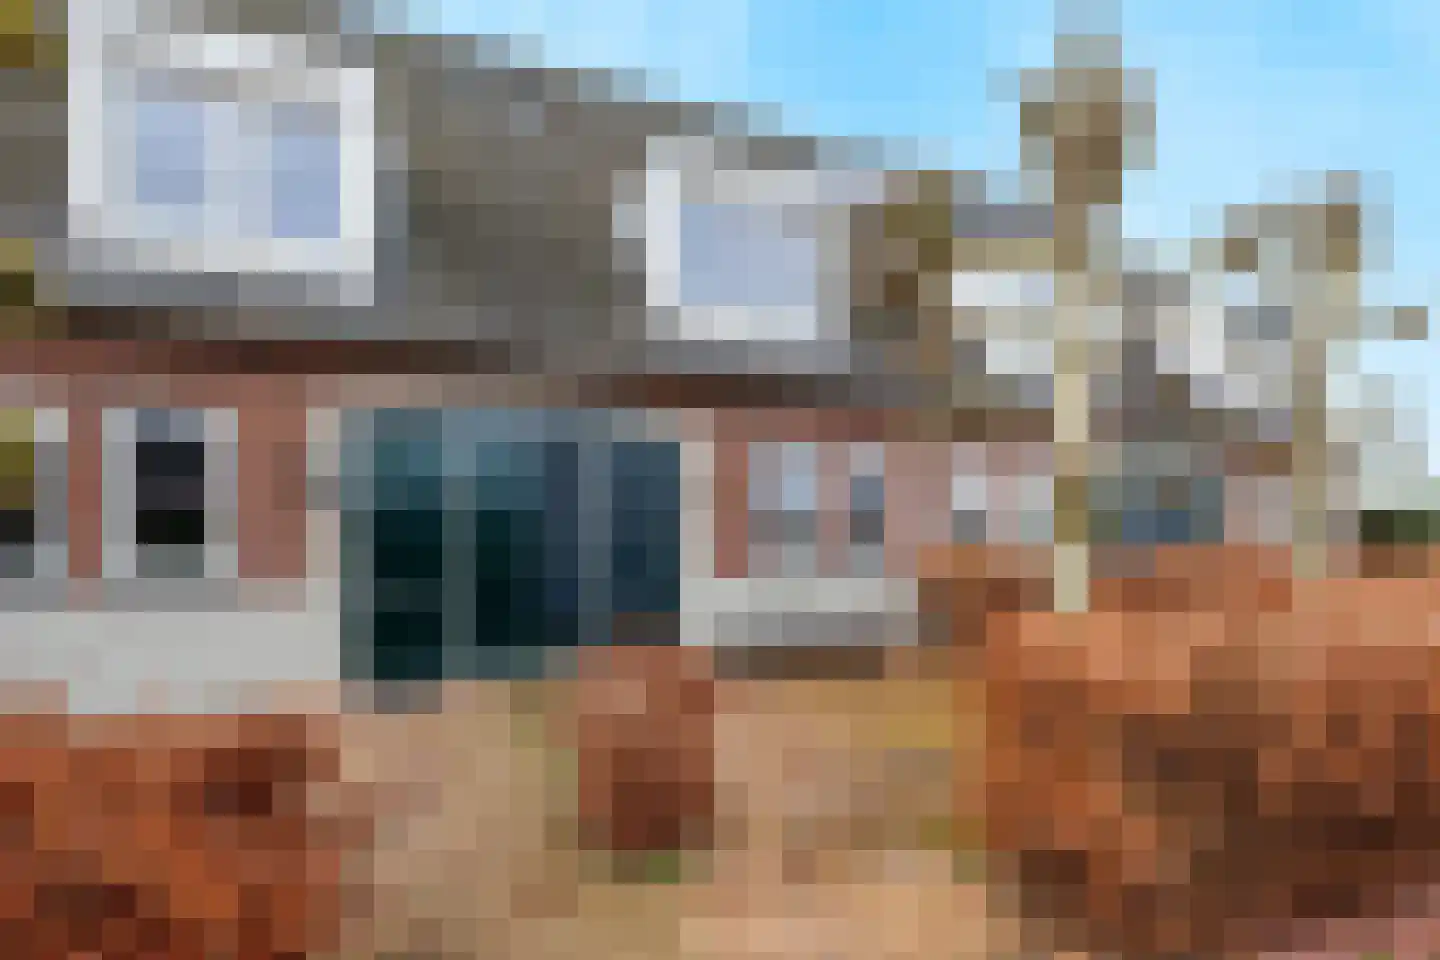
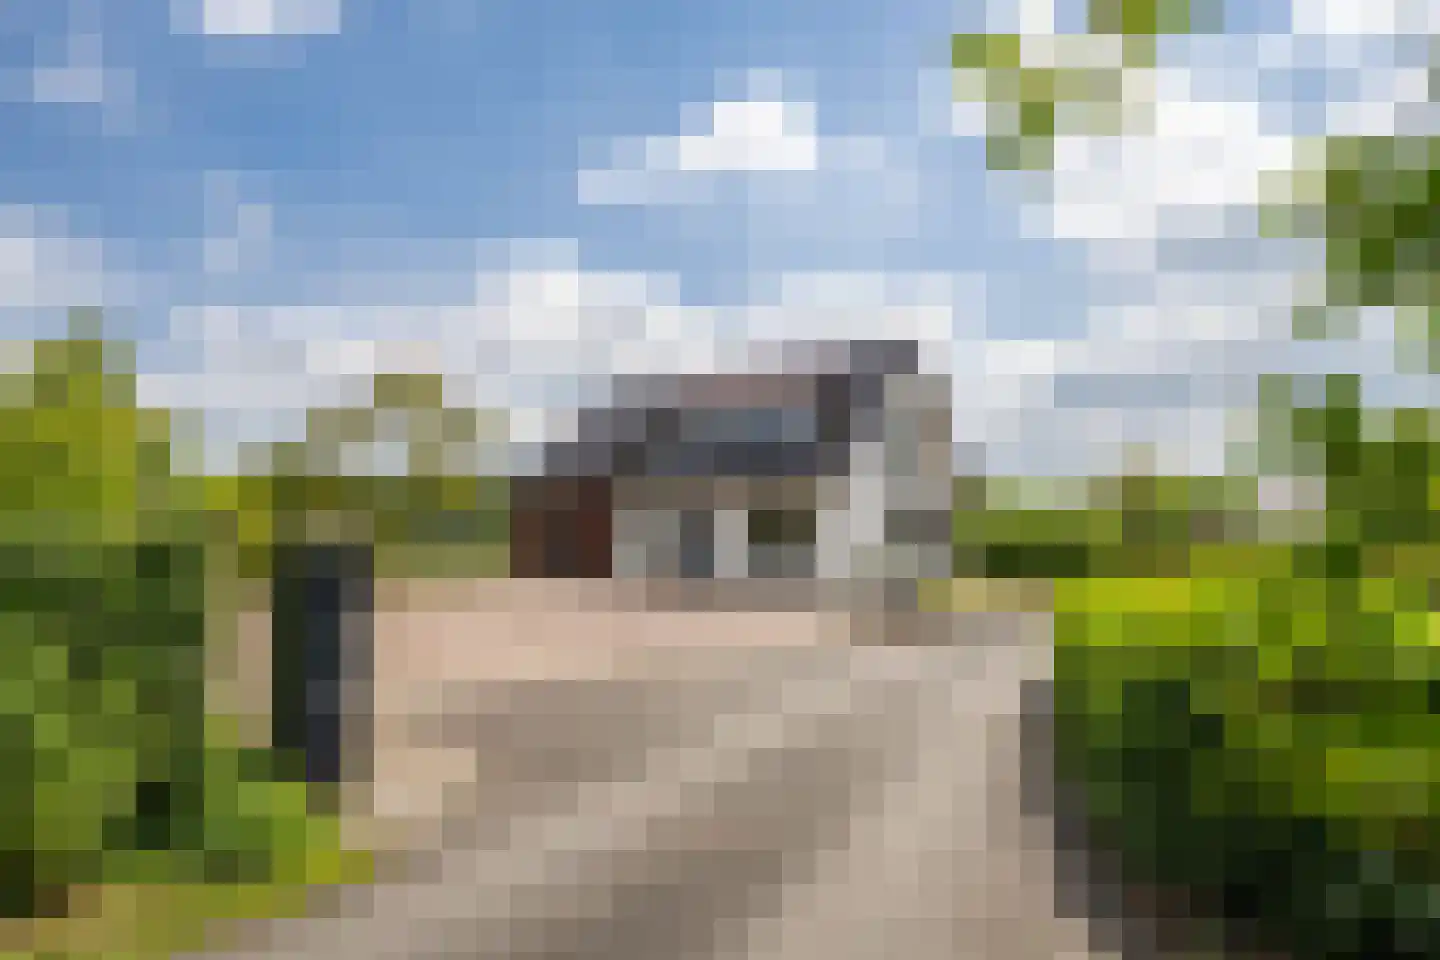
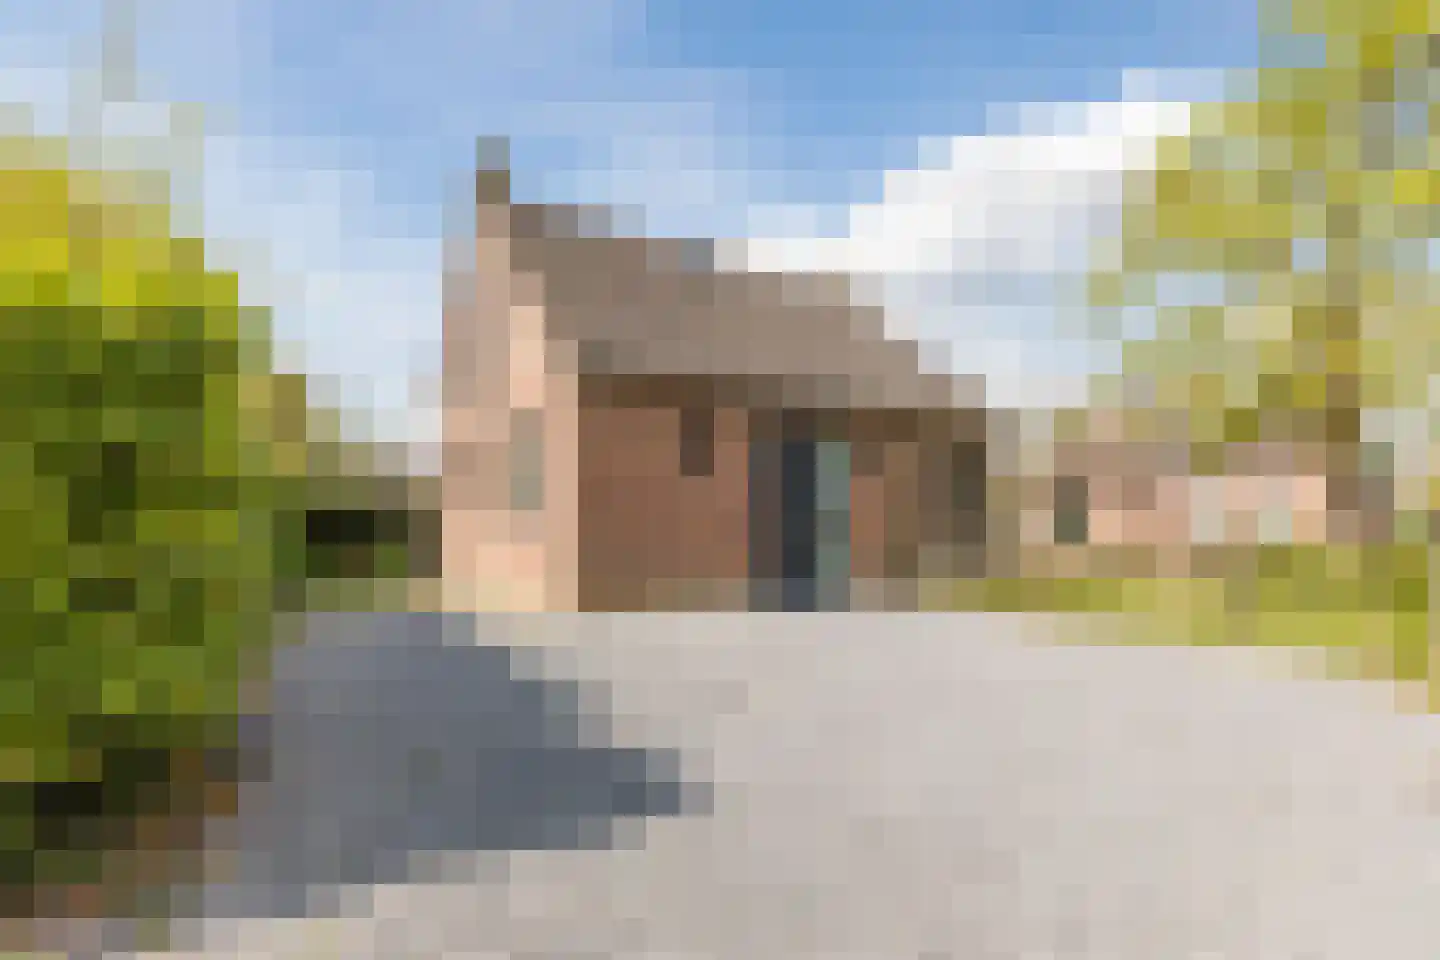
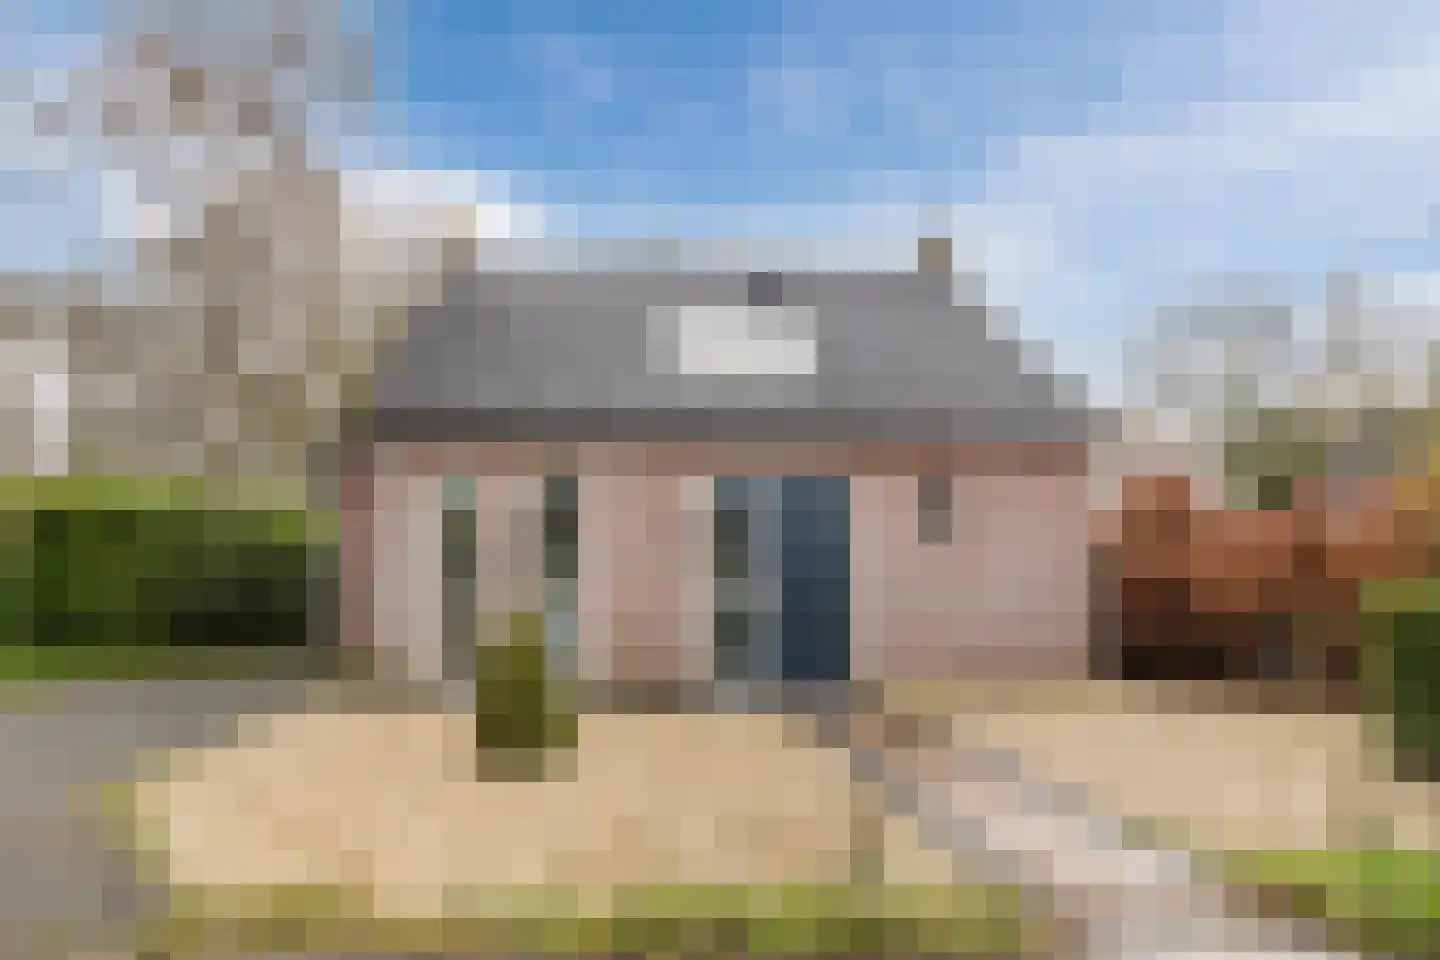
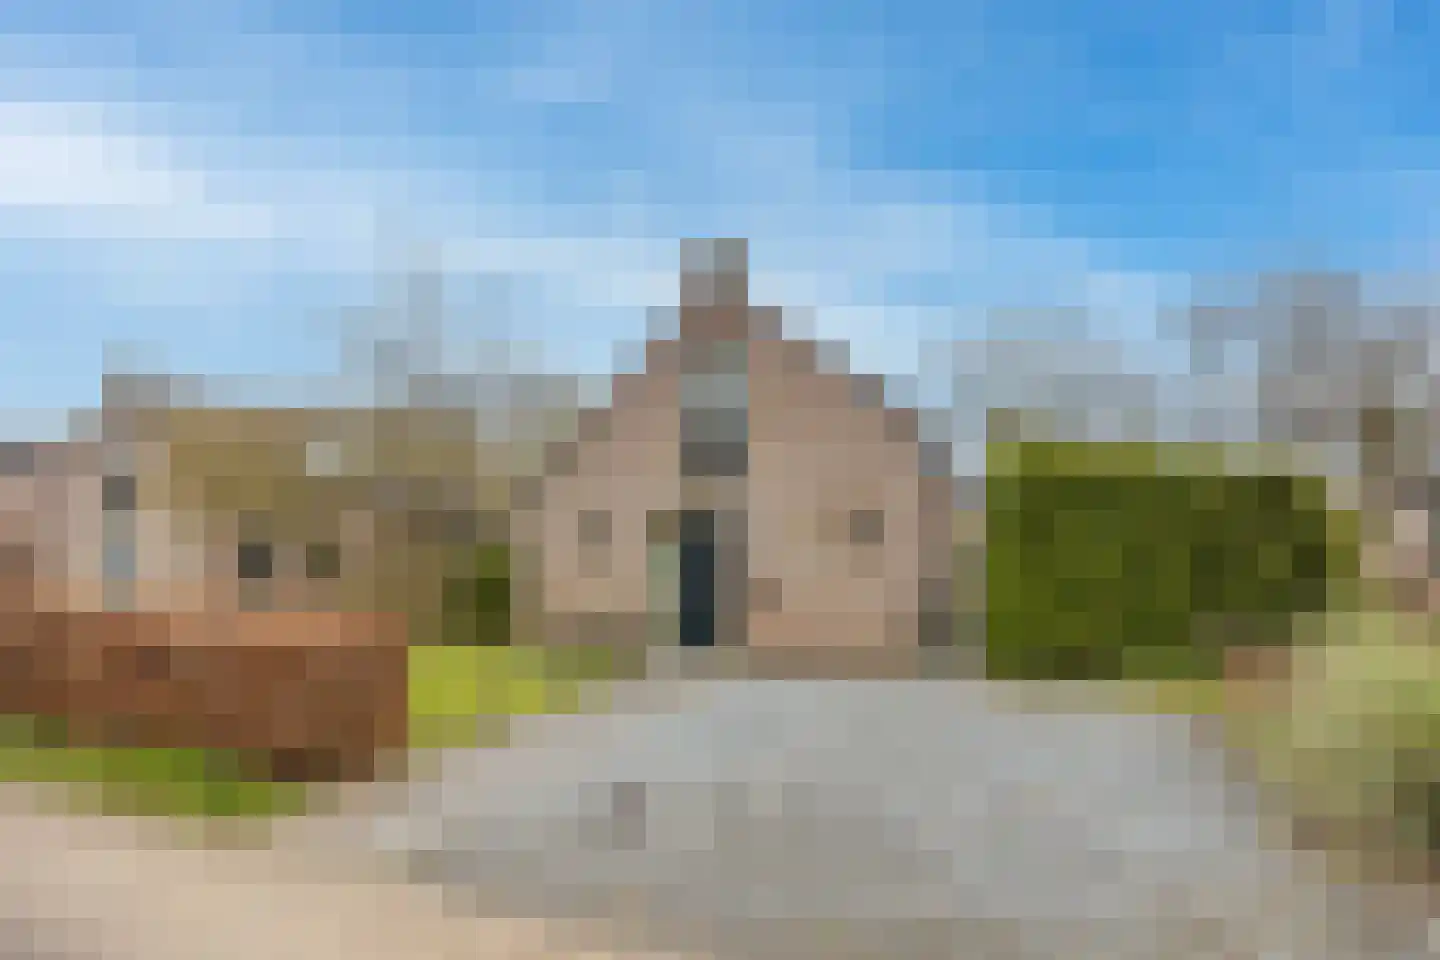
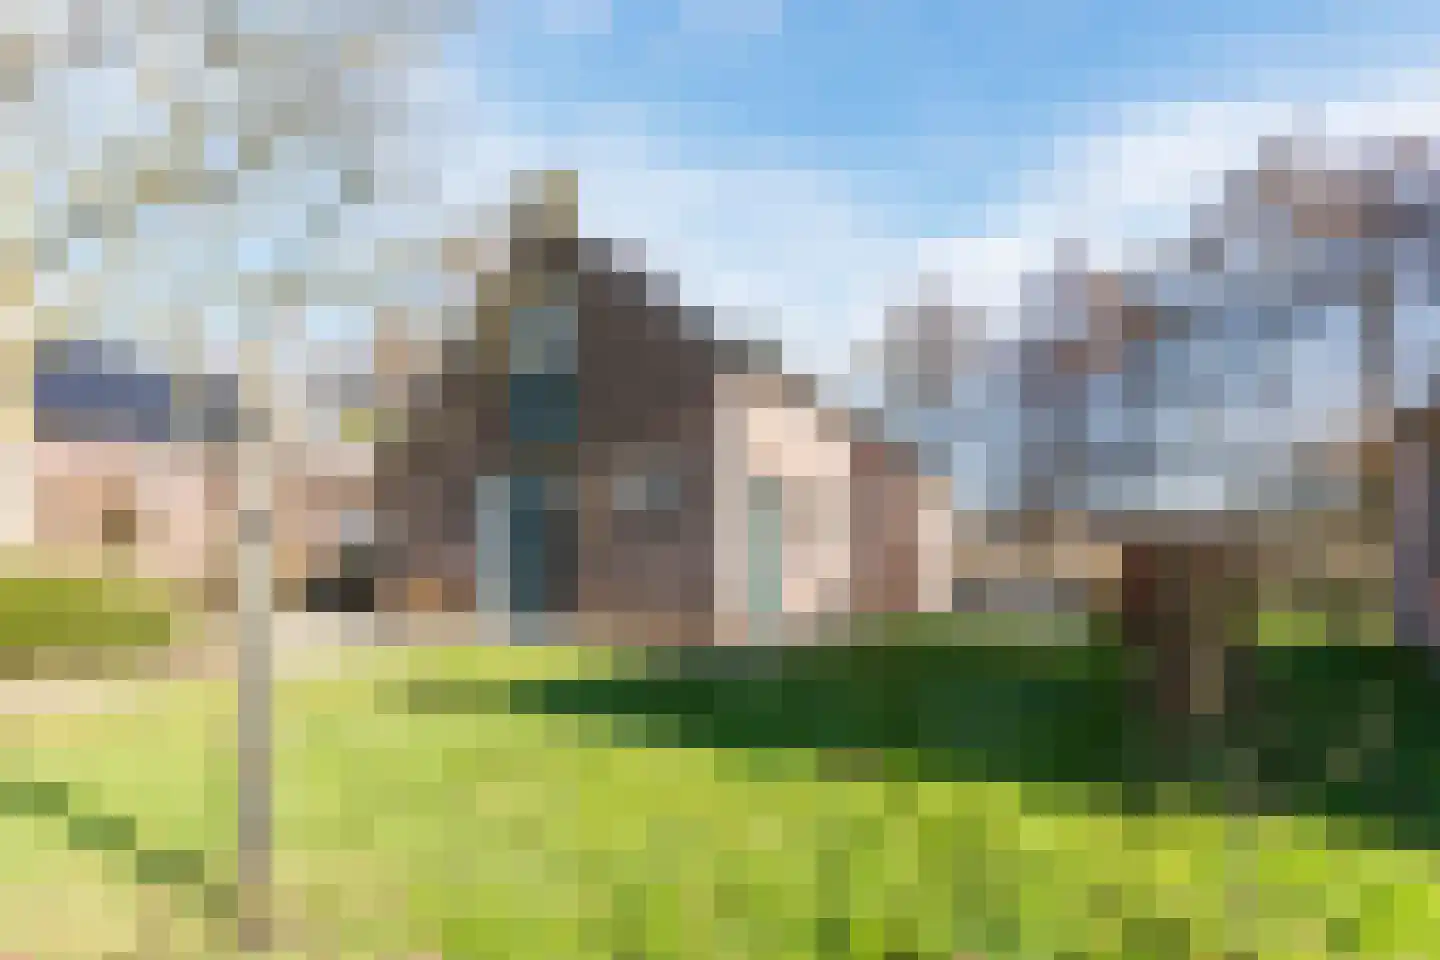
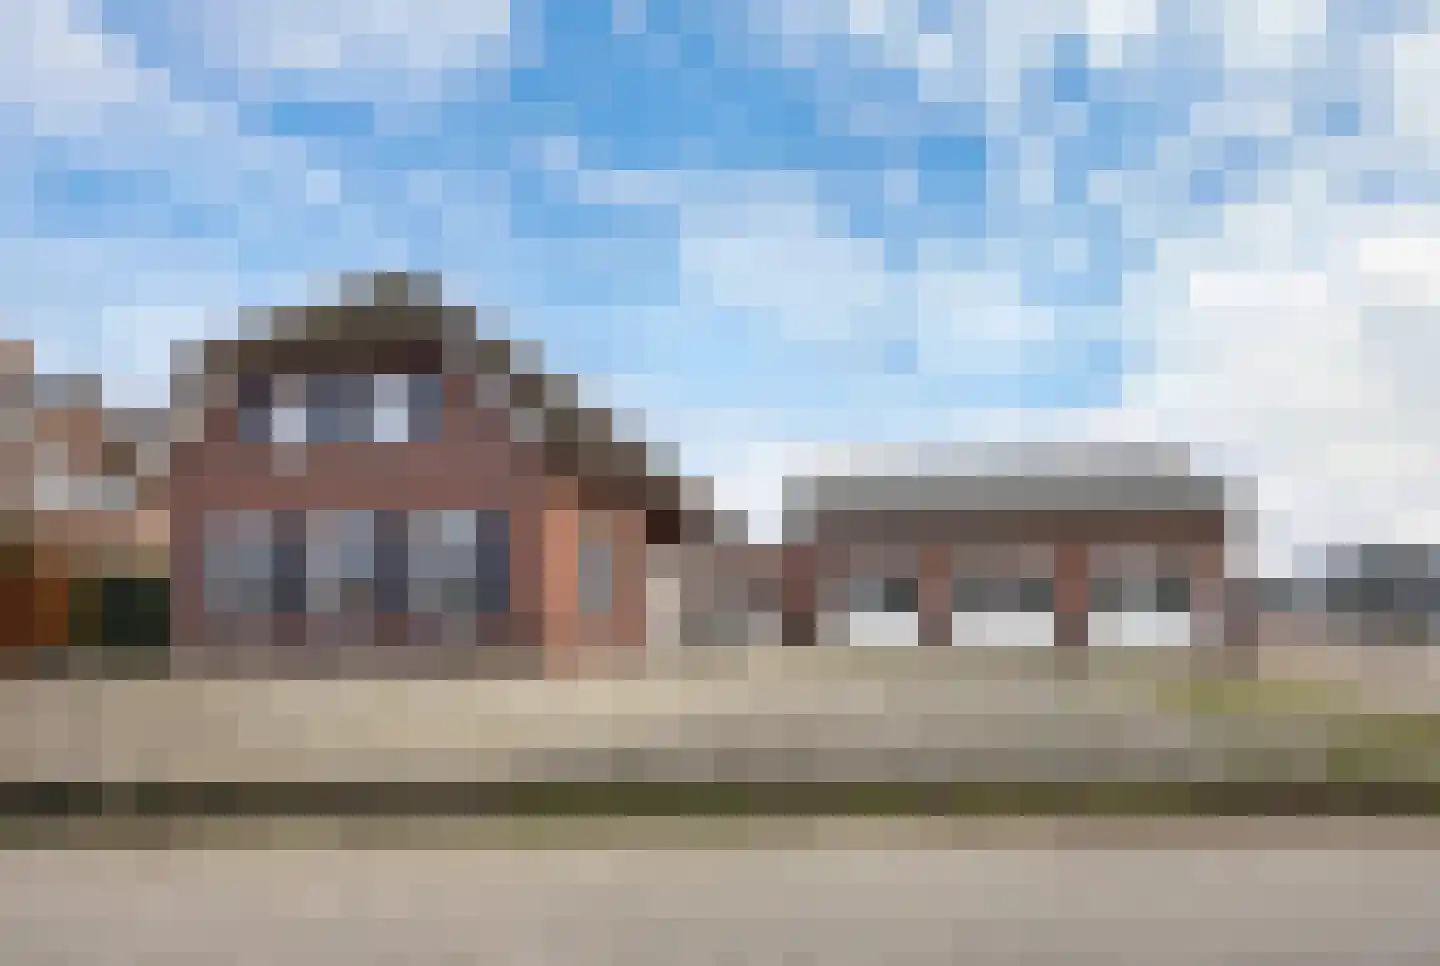
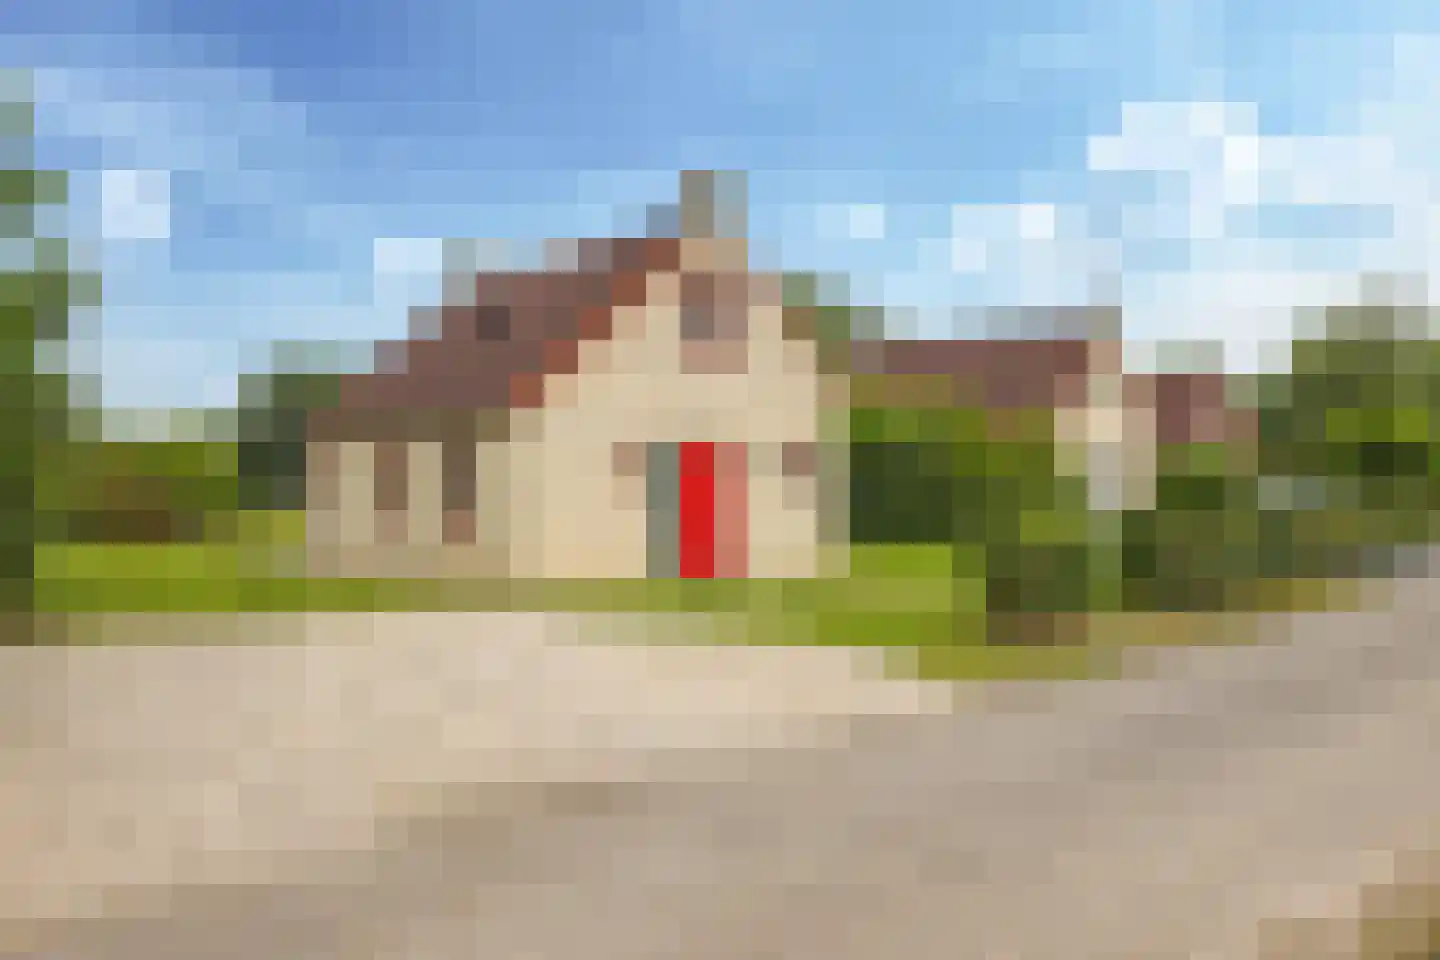
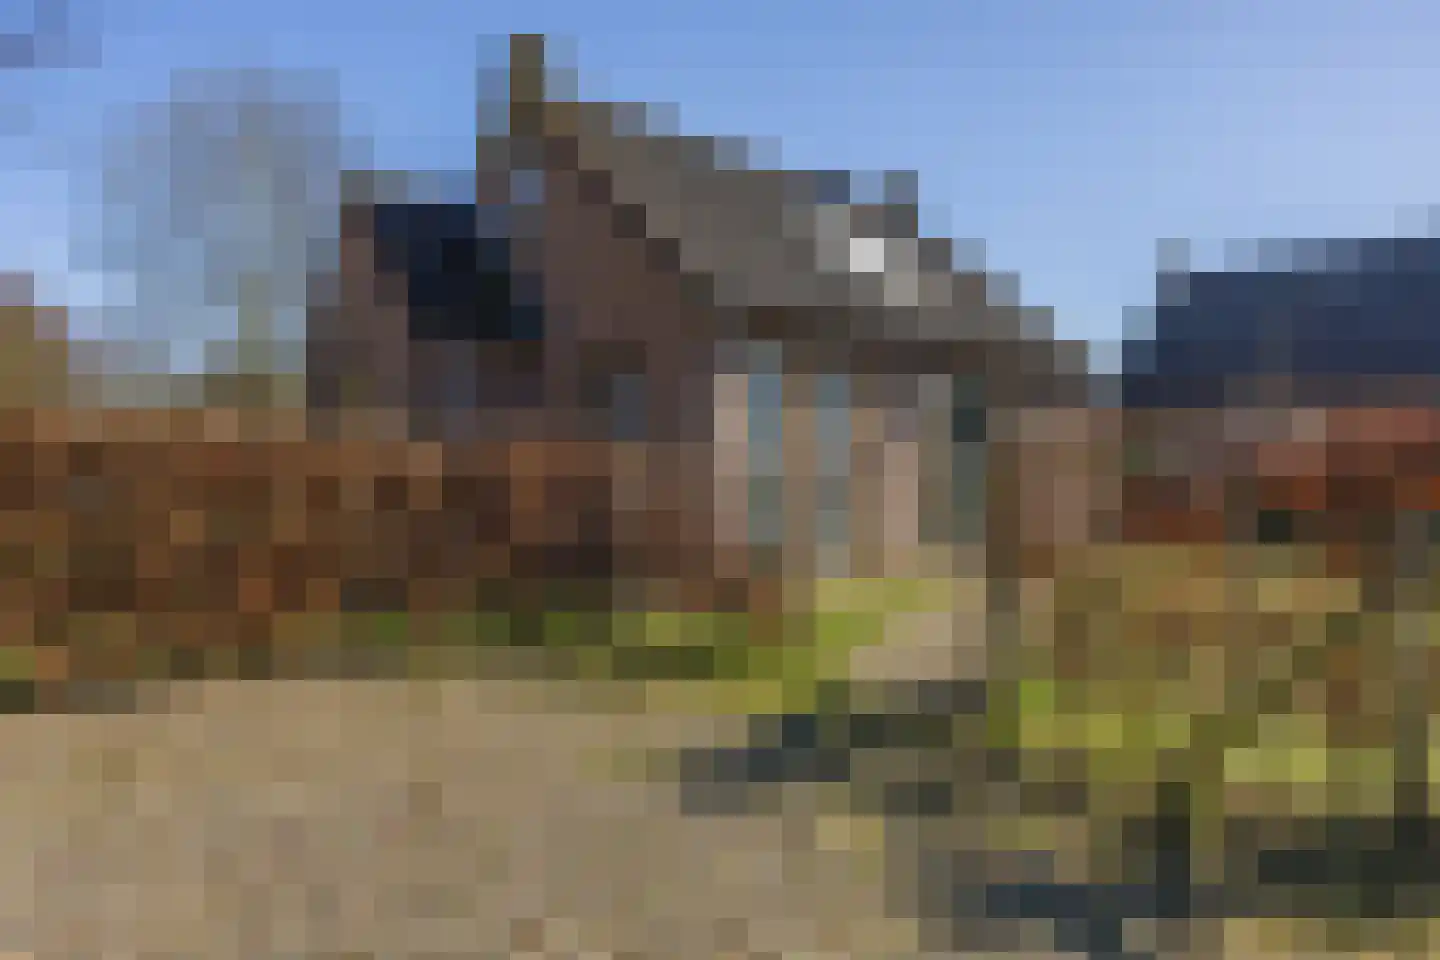
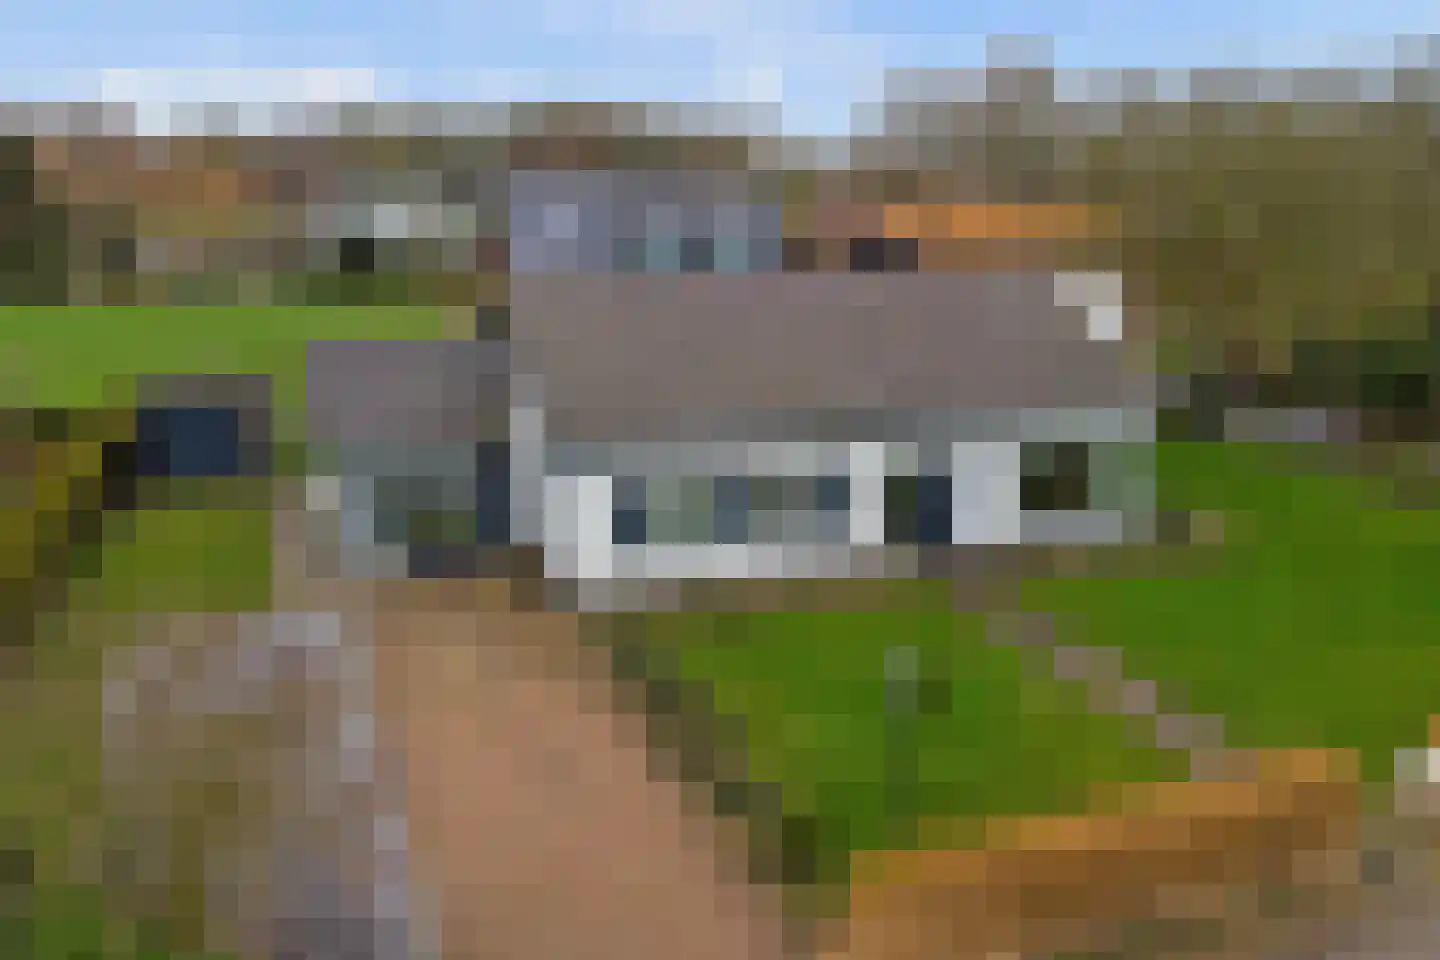
Housing offer in Ewijk

Searching in 52 houses in Ewijk

Connected to: Vastgoed Nederland NVM Makelaars

View the current housing stock in Ewijk and quickly filter by price, living area, rooms and more. There are currently 52 houses in this place within our selection. View also 31 sold houses in Ewijk for extra insight into the local housing market.

Selection

Search and filter homes

Set your preferences and discover homes that suit you.

Total supply 242.647
Filters

Set price, area and other characteristics. Adjust a filter or click on Show homes. Location changes directly above.

Reset filters

You search for

  • Place Ewijk

Selling a home in Ewijk? Compare realtor offers

Get free quotes from real estate agents with local market knowledge. Compare more than 73 real estate agents in Ewijk.

Free request a quote

  • Quotes in Ewijk
  • Non-binding
  • Personal
  • Compare free rates

Selling a home in Ewijk? Compare all real estate agents in Ewijk or view the top 10 real estate agents in Ewijk for extra context for your choice.

Compare multiple quotes

Real estate agents make sharper offers when they know you're comparing — ask for quotes for sale or purchase.

Frequently asked questions about homes in Ewijk

Practical answers about housing supply, sales and comparing real estate agents in Ewijk.

Residential and neighborhood statistics in Ewijk

View current location data on residents, WOZ development, housing stock, energy consumption, business activity and safety in Ewijk. In 2026 were there 4.564 residents. The average WOZ value in 2025 is EUR 432.000.

These figures help to better assess and compare the housing stock in Ewijk with recent sold homes. Orient yourself then on suitable top real estate agents in Ewijk for sales advice in this region.

Residents

4.564

Last year: 2026

Average WOZ

EUR 432.000

Last year: 2025

Average income per person.

EUR 35.200

Source: AllNumbers

Crimes (current year)

144

Total registered

Demographics and WOZ development

Inhabitants per year

Inhabitants per year in Ewijk
Year Residents
2021 4.140
2022 4.160
2023 4.215
2024 4.515
2025 4.545
2026 4.564

Annual WOZ value

WOZ value per year in Ewijk
Year Average WOZ
2021 EUR 298.000
2022 EUR 339.000
2023 EUR 387.000
2024 EUR 406.000
2025 EUR 432.000

Composition of residents

Age build-up

65+: 890 0-15: 870 15-25: 410 25-45: 1.245 45-65: 1.125

Education level

Hoger

1.080

Praktisch

720

Middelbaar

1.530

Origin of residents (2025)

Europa

205

Nederland

3.980

Buiten Europa

360

Housing stock and construction periods

Types of homes

Hoekwoningen 339
Appartementen 146
Tussenwoningen 582
Vrijstaande woningen 542
Twee-onder-één-kap woningen 271

Construction period of buildings

Voor 1700 5
1700 tot 1900 49
1900 tot 1925 57
1925 tot 1950 67
1950 tot 1970 250
1970 tot 1980 427
1980 tot 1990 301
1990 tot 2000 327
2000 tot 2010 112
2010 tot 2020 231
2020 en later 169

Energy and sustainability

Energy label distribution

Label C

585

Label A

511

Label B

384

Label D

113

Label G

102

Label A+++

94

Label F

65

Label A++++

54

Label E

37

Label A+

13

Label A++

12

Label A+++++

0

Average energy consumption per year

Average energy consumption per year in Ewijk
Year Gas (m3) Electricity (kWh)
2020 1.310 3.270
2021 1.490 3.350
2022 1.120 3.210
2023 920 3.050
2024 860 3.190

Consumption per house type

Hoekwoning

Gas: 780 • Electricity: 2.880

Huurwoning

Gas: 720 • Electricity: 2.240

Koopwoning

Gas: 1.010 • Electricity: 3.390

Appartement

Gas: 590 • Electricity: 1.960

Tussenwoning

Gas: 730 • Electricity: 2.400

Vrijstaande woning

Gas: 1.290 • Electricity: 4.070

Twee-onder-één-kap woning

Gas: 980 • Electricity: 3.190

Business activity in Ewijk (2025)

Handel en HORECA 95
Nijverheid en energie 85
Zakelijke dienstverlening 150
Overheid, onderwijs en zorg 105
Landbouw, bosbouw en visserij 20
Vervoer, informatie en communicatie 30
Financiele diensten en onroerendgoed 30
Cultuur, recreatie en overige diensten 75

Total number of company establishments: 585

Recent crime statistics

Recent crime statistics in Ewijk
Period Crimes
jan 2026 6
jul 2025 26
jun 2025 10
mei 2025 9
mrt 2025 8
mrt 2026 7
nov 2024 4
nov 2025 10
okt 2024 5
okt 2025 7
sep 2024 10
sep 2025 13

These figures give an indicative picture of safety trends in the living environment of Ewijk.

Frequently asked questions about living in Ewijk

Short answers based on current local statistics, handy for a quick comparison of the living environment.

Hoeveel inwoners heeft Ewijk?

Ewijk telt in 2026 ongeveer 4.564 inwoners.

Wat is de gemiddelde WOZ-waarde in Ewijk?

De gemiddelde WOZ-waarde in Ewijk is in 2025 circa € 432.000.

Wat is het gemiddelde inkomen per inwoner in Ewijk?

Het gemiddelde inkomen per inwoner in Ewijk ligt rond € 35.200 per jaar.

Hoe veilig is wonen in Ewijk?

Voor het huidige jaar gaat het om ongeveer 144 geregistreerde misdrijven. Gebruik deze cijfers als indicatie en vergelijk trends per periode.

Welke woningtypen komen het meest voor in Ewijk?

In Ewijk komt vooral "Tussenwoningen" veel voor, met ongeveer 582 woningen.

Receive free, non-binding quotes

Compare multiple real estate agents and choose the best match.