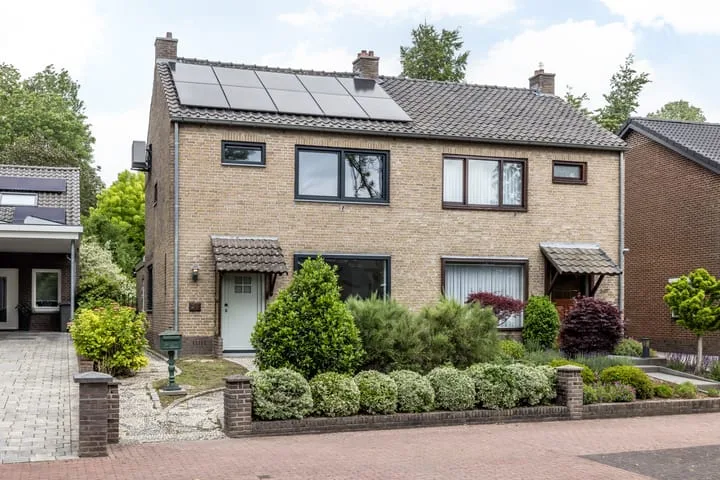
- Sold
Taan-Del 16
6287BM Eys
€ 640.000 k.k.
€ 3.810/m²
- Living area
- 168 m²
- Land area
- 504 m²
- Bedrooms
- 5
View 10 sold houses in Eys
Type to search. Use arrow down and arrow up to navigate through results and press Enter to open.
Hidden search suggestions.
Compare sold homes in Eys or view the current offering in this location directly.
On this page you will find recently sold homes in Eys. Use this overview to better estimate selling prices, popular neighborhoods, and the local housing supply before you choose a real estate agent. Also view the current housing supply with 16 houses in Eys.
6287BM Eys
€ 640.000 k.k.
€ 3.810/m²
6287BP Eys
€ 389.000 k.k.
€ 2.839/m²
6287AG Eys
€ 790.000 k.k.
€ 3.708/m²
6287AP Eys
€ 397.500 k.k.
€ 3.549/m²
6287BB Eys
€ 389.500 k.k.
€ 3.606/m²
6287AL Eys
€ 345.000 k.k.
€ 3.750/m²
6287AR Eys
€ 349.000 k.k.
€ 3.116/m²
6287BG Eys
€ 449.500 k.k.
€ 3.405/m²
6287CC Eys
€ 450.000 k.k.
€ 3.543/m²
6287AJ Eys
€ 249.000 k.k.
€ 2.515/m²
Bekijk recente verkopen en ontvang gratis offertes van lokale makelaars. Vergelijk meer dan 58 makelaars in Eys.
Zelf je woning verkopen in Eys? Vergelijk verkoopmakelaars in Eys of bekijk de beste verkoopmakelaars in Eys als referentie bij jouw keuze.
Makelaars maken scherpere voorstellen als ze weten dat je vergelijkt — vraag offertes aan voor verkoop of aankoop.
Short answers about housing prices, sold homes and comparing real estate agents in Eys.
De kosten van een makelaar in Eys verschillen per kantoor, woningtype en verkoopaanpak. In Eys kun je 58 real estate agents vergelijken; bekijk daarom ook de makelaars in Eys om tarieven, presentatie en lokale ervaring beter naast elkaar te zetten.
On this page we currently show 10 sold houses in Eys from our selection. This helps you to better assess recent transactions and the local housing market.
Houses sold in Eys give insight into asking prices, house types and neighborhoods where recent transactions have taken place. Compare this also with the current housing stock in Eys to better understand the market.
You can use sold homes as a first market indication, but a local real estate agent can better take into account finishing, location, maintenance and current demand in Eys.
Vergelijk de 58 real estate agents in Eys op lokale verkoopervaring, reviews, verwachte opbrengst, courtage en marketingaanpak. Bekijk verkoopmakelaars in Eys of de top 10 makelaars in Eys om snel sterke kantoren te ontdekken.
View current location data on residents, WOZ development, housing stock, energy consumption, business activity and safety in Eys. In 2025 were there 1.615 residents. The average WOZ value in 2025 is EUR 383.000.
These figures help to better assess and compare the housing stock in Eys with recent sold homes. Orient yourself then on suitable top real estate agents in Eys for sales advice in this region.
Residents
1.615
Last year: 2025
Average WOZ
EUR 383.000
Last year: 2025
Average income per person.
EUR 35.600
Source: AllNumbers
Crimes (current year)
23
Total registered
| Year | Residents |
|---|---|
| 2021 | 1.680 |
| 2022 | 1.675 |
| 2023 | 1.665 |
| 2024 | 1.640 |
| 2025 | 1.615 |
| Year | Average WOZ |
|---|---|
| 2021 | EUR 290.000 |
| 2022 | EUR 305.000 |
| 2023 | EUR 353.000 |
| 2024 | EUR 356.000 |
| 2025 | EUR 383.000 |
Hoger
460
Praktisch
220
Middelbaar
520
Europa
175
Nederland
1.380
Buiten Europa
60
Label C
169
Label D
149
Label G
132
Label A
99
Label F
95
Label B
86
Label E
39
Label A+++
1
Label A+
0
Label A++
0
Label A++++
0
Label A+++++
0
| Year | Gas (m3) | Electricity (kWh) |
|---|---|---|
| 2020 | 1.560 | 3.120 |
| 2021 | 1.780 | 3.240 |
| 2022 | 1.420 | 3.000 |
| 2023 | 1.140 | 2.890 |
| 2024 | 1.110 | 3.010 |
Hoekwoning
Gas: 1.120 • Electricity: 2.880
Huurwoning
Gas: 930 • Electricity: 2.140
Koopwoning
Gas: 1.180 • Electricity: 3.070
Appartement
Gas: 870 • Electricity: 2.280
Tussenwoning
Gas: 1.010 • Electricity: 2.700
Vrijstaande woning
Gas: 1.360 • Electricity: 3.390
Twee-onder-één-kap woning
Gas: 1.100 • Electricity: 2.740
Total number of company establishments: 200
| Period | Crimes |
|---|---|
| jan 2025 | 2 |
| jan 2026 | 1 |
| jul 2025 | 3 |
| jun 2025 | 1 |
| mei 2025 | 2 |
| mrt 2025 | 2 |
| nov 2024 | 4 |
| nov 2025 | 2 |
| okt 2024 | 1 |
| okt 2025 | 0 |
| sep 2024 | 1 |
| sep 2025 | 4 |
These figures give an indicative picture of safety trends in the living environment of Eys.
Short answers based on current local statistics, handy for a quick comparison of the living environment.
Eys telt in 2025 ongeveer 1.615 inwoners.
De gemiddelde WOZ-waarde in Eys is in 2025 circa € 383.000.
Het gemiddelde inkomen per inwoner in Eys ligt rond € 35.600 per jaar.
Voor het huidige jaar gaat het om ongeveer 23 geregistreerde misdrijven. Gebruik deze cijfers als indicatie en vergelijk trends per periode.
In Eys komt vooral "Twee-onder-één-kap woningen" veel voor, met ongeveer 222 woningen.