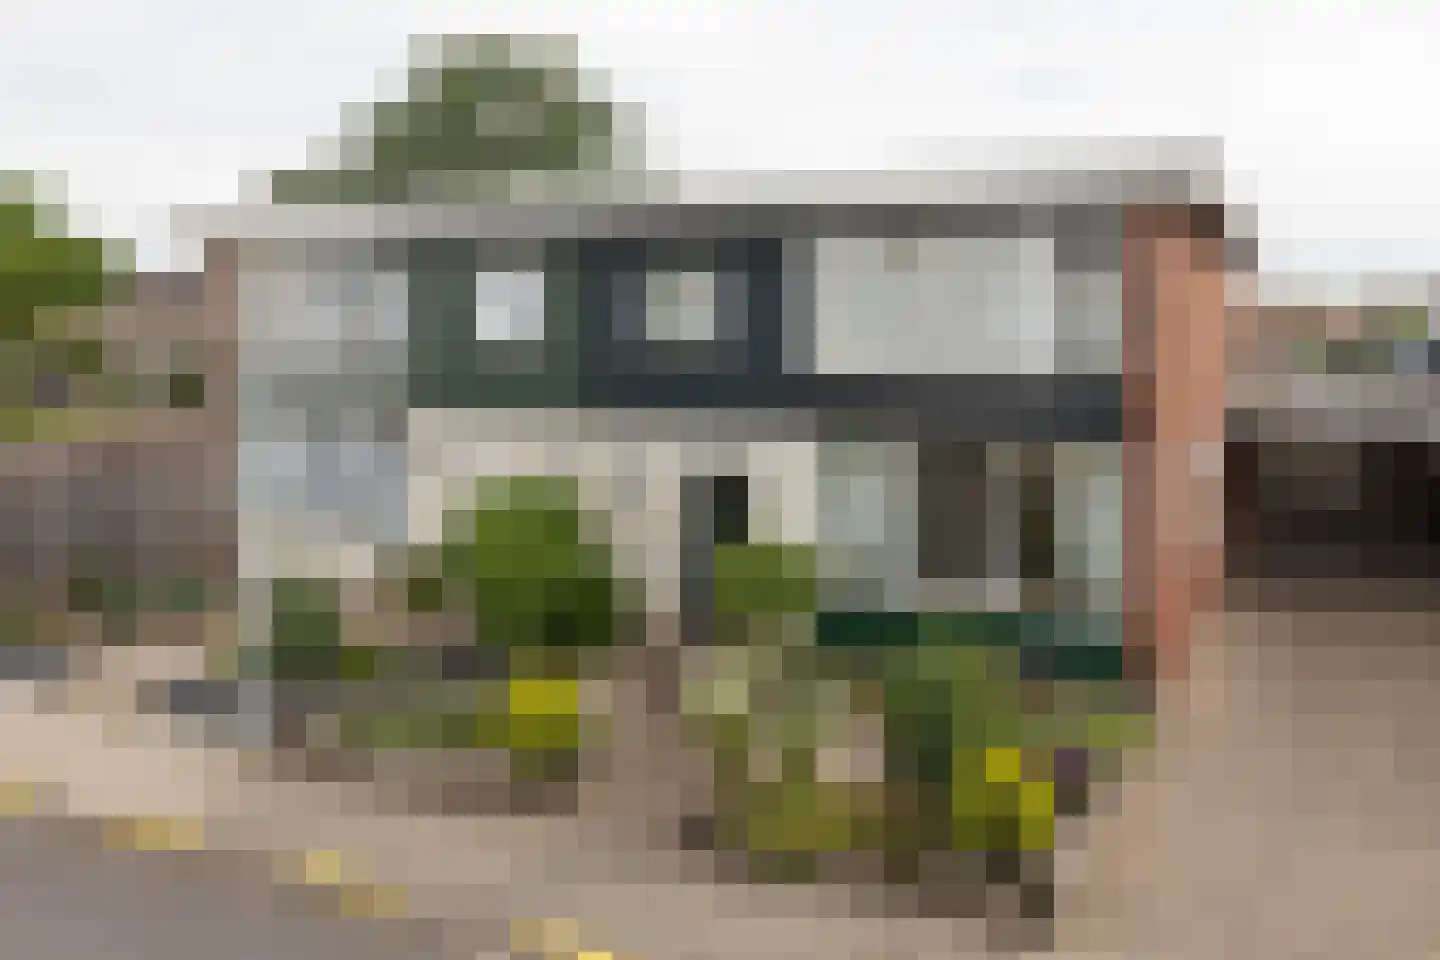
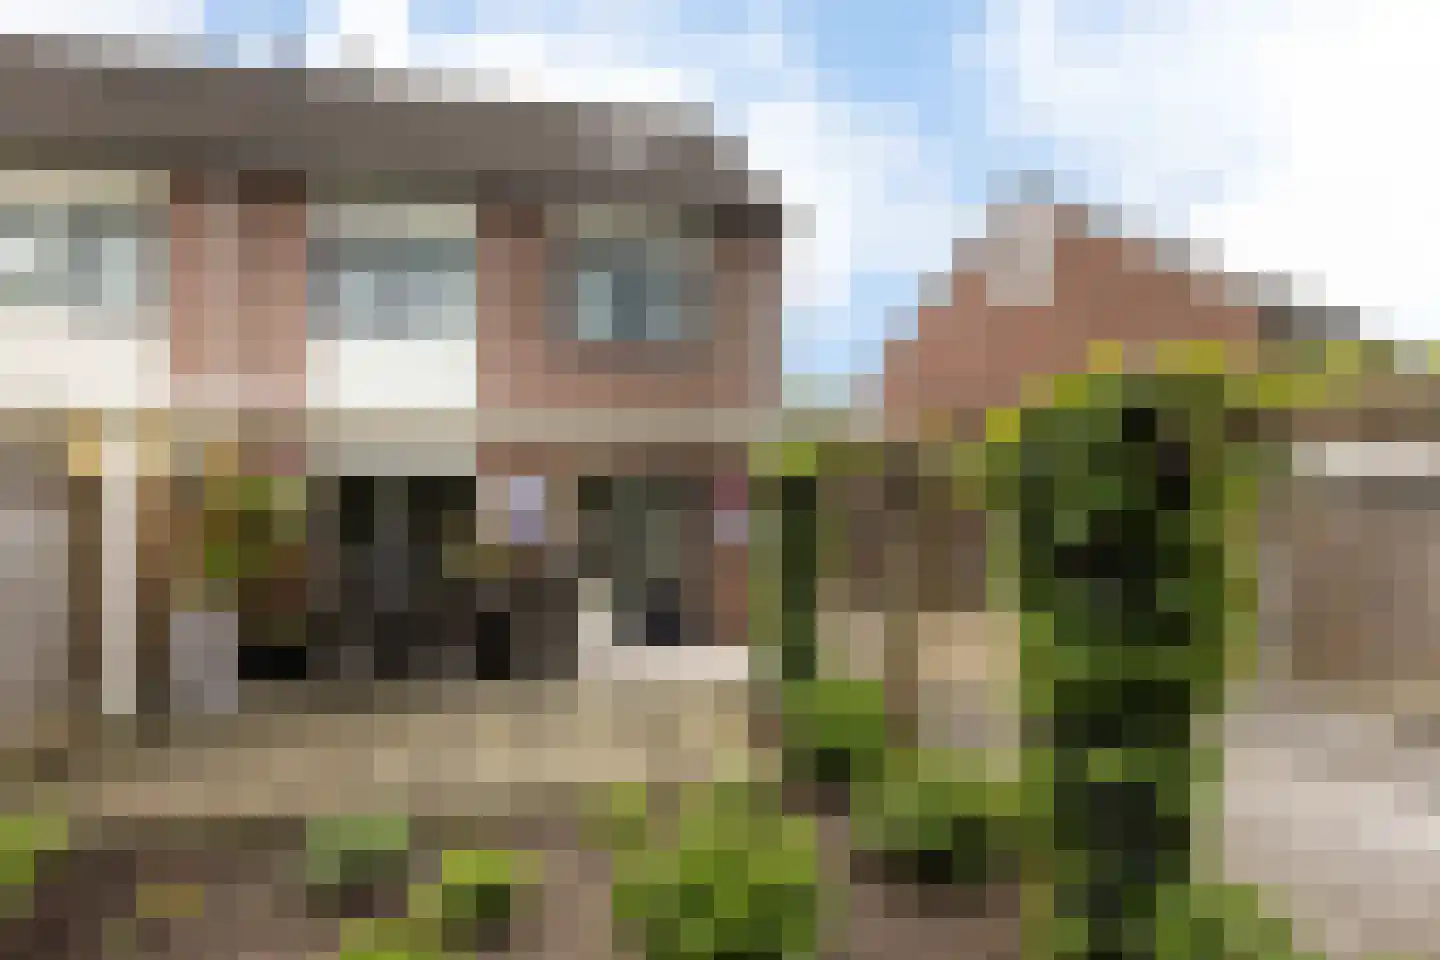
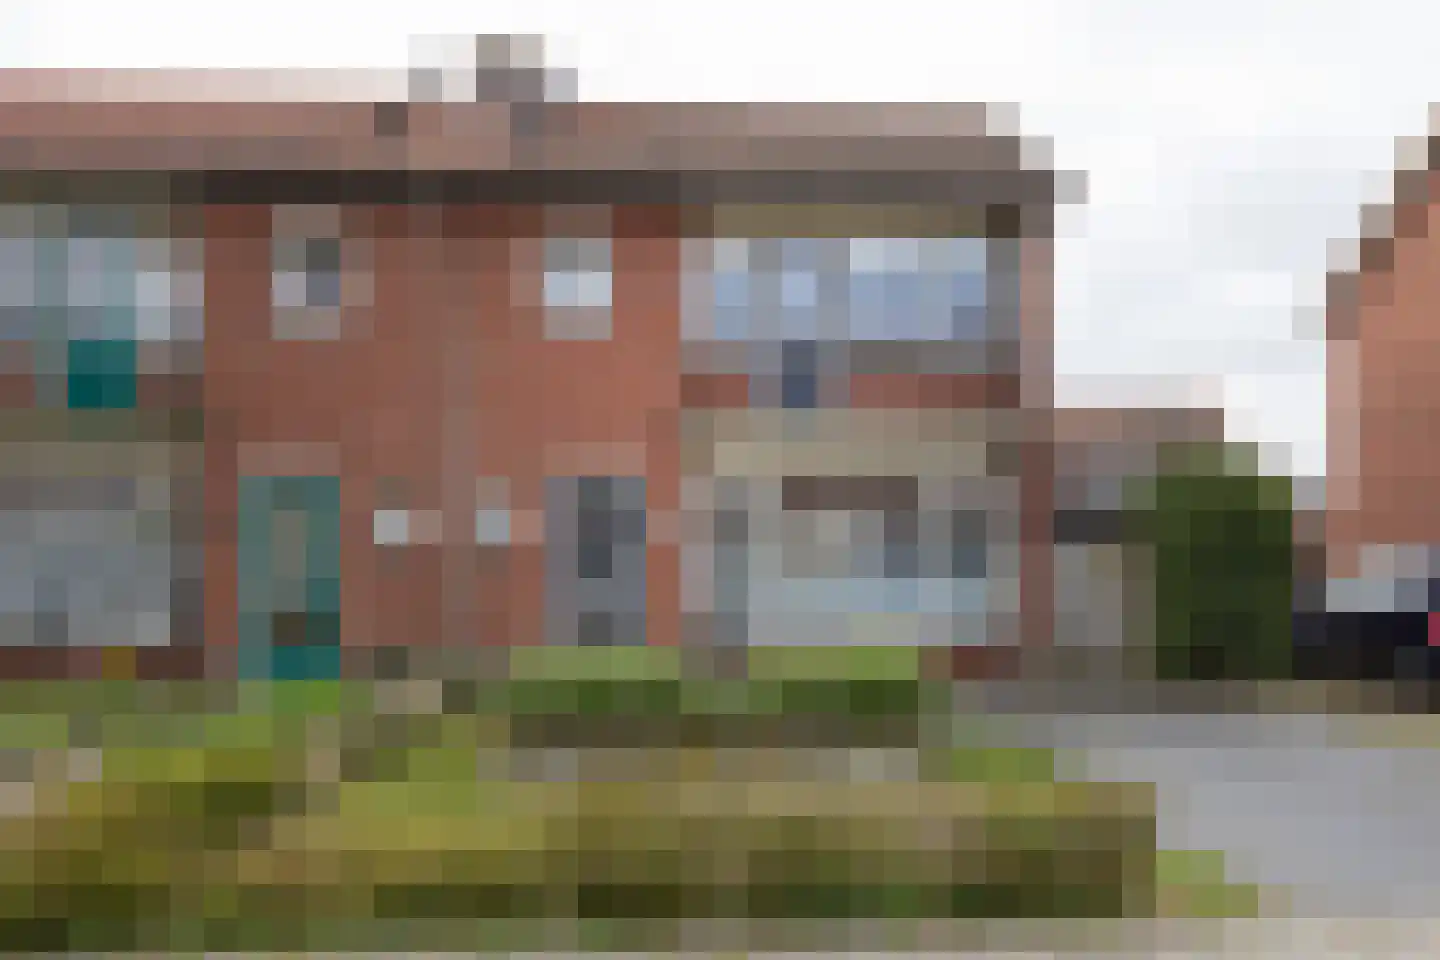
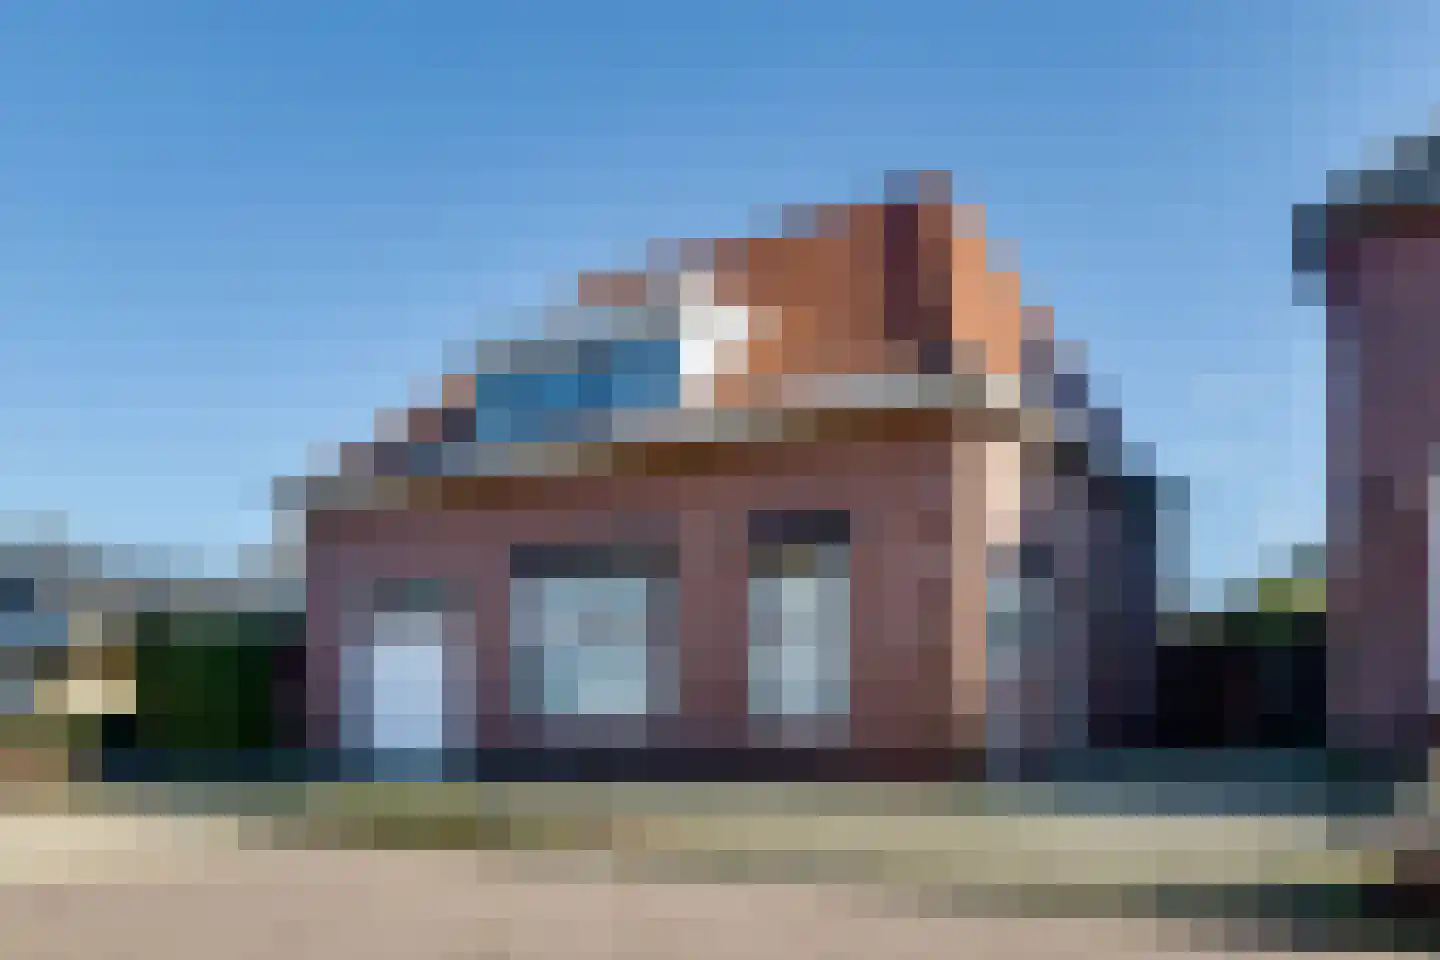
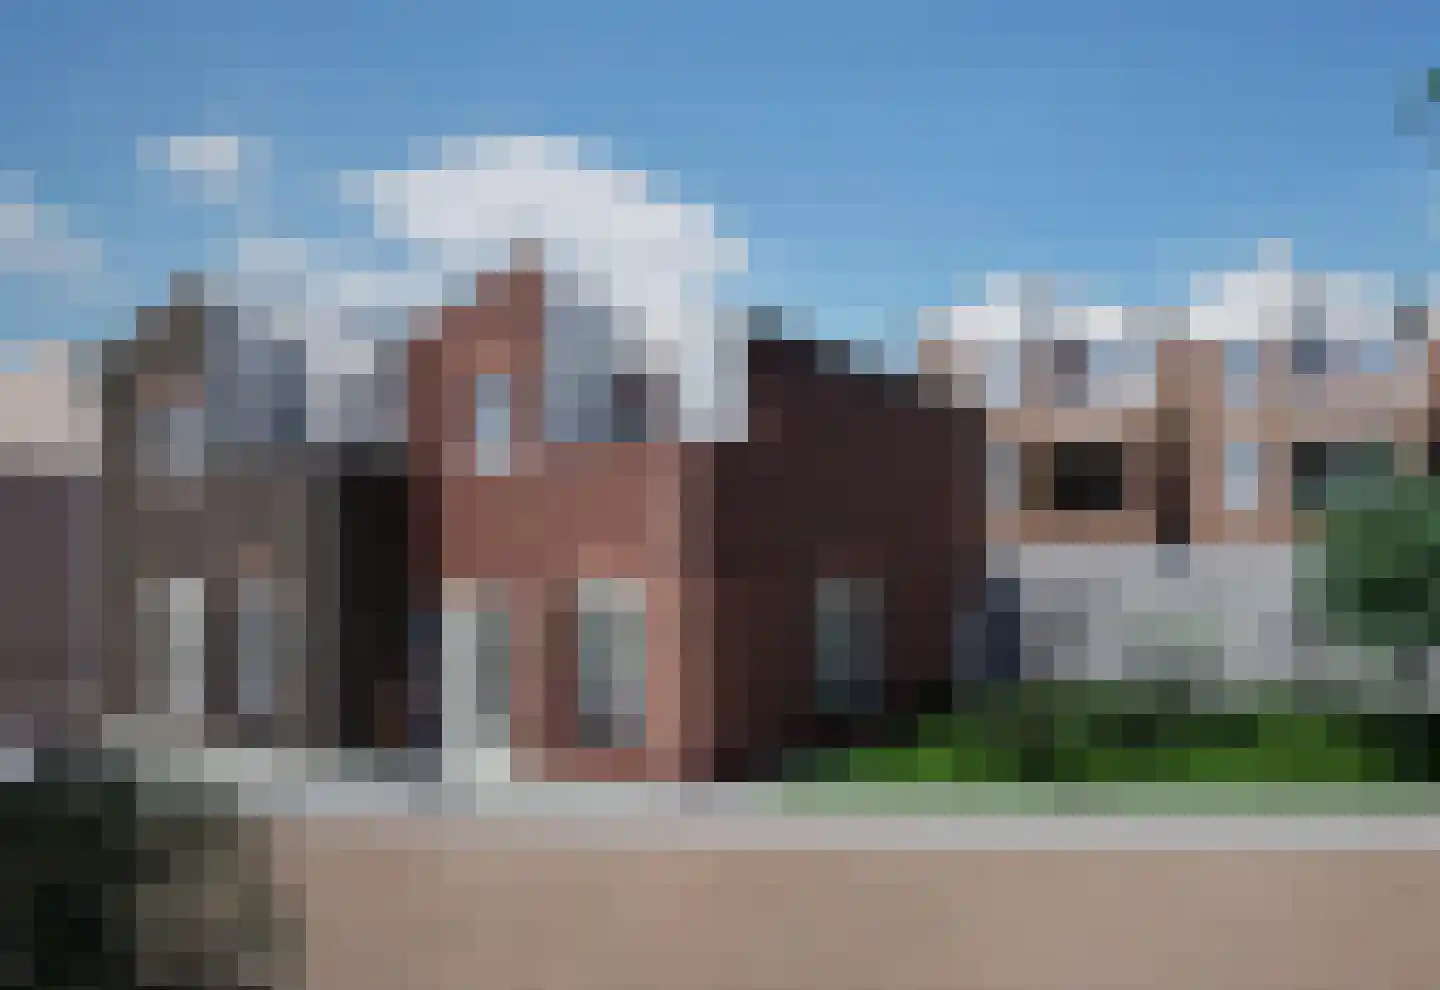
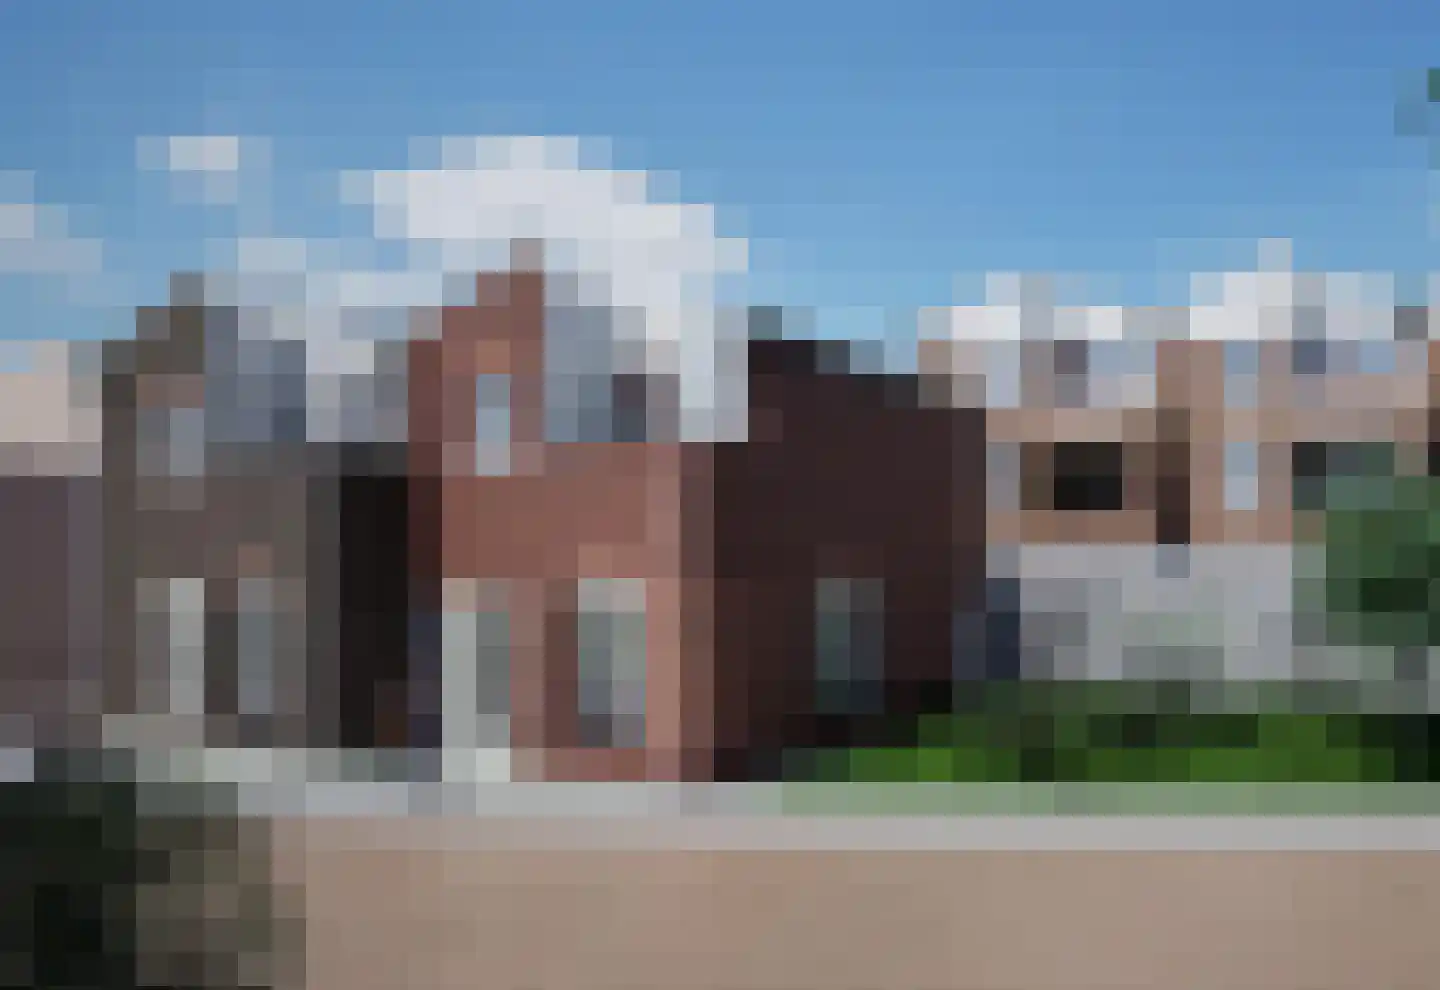
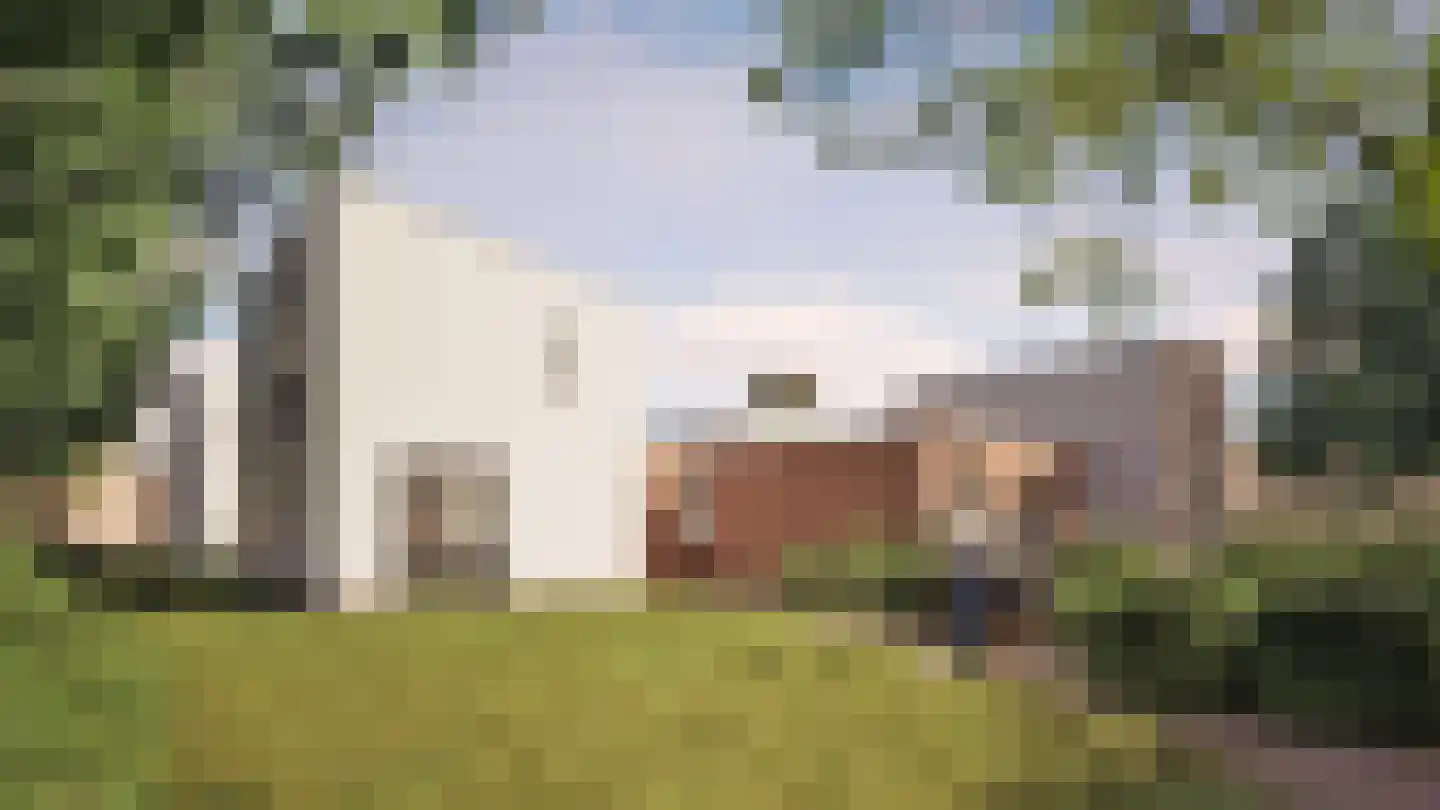
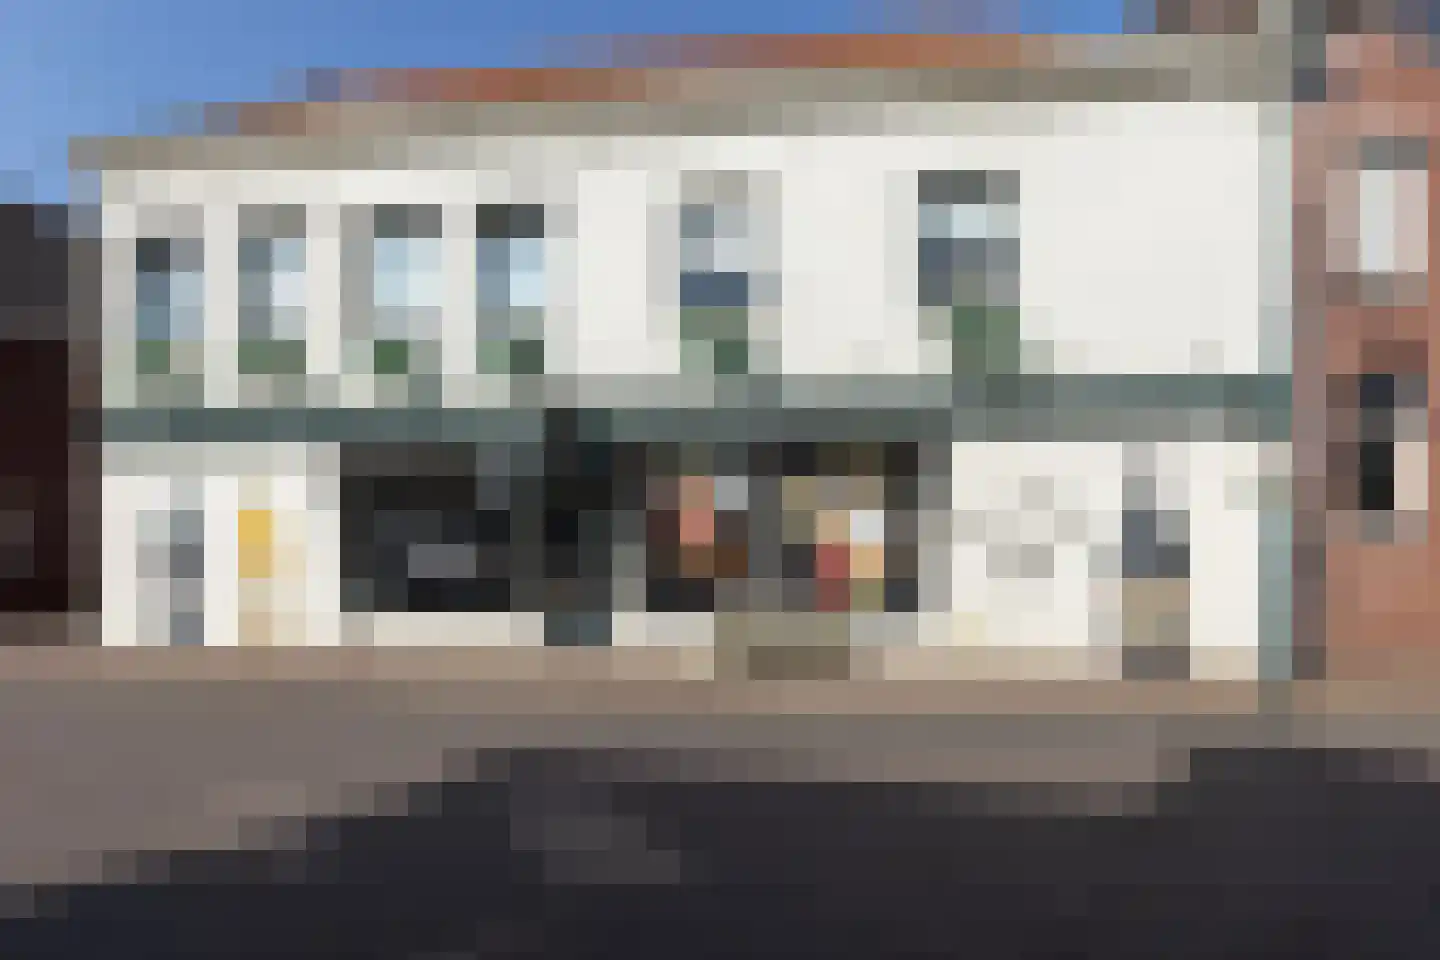
- Available
Groeneweg 1
7141DR Groenlo
€ 397.500 k.k.
€ 2.723/m²
- Living area
- 146 m²
- Land area
- 195 m²
- Bedrooms
- 3
Searching in 153 houses in Groenlo
Type to search. Use arrow down and arrow up to navigate through results and press Enter to open.
Hidden search suggestions.
View current properties in Groenlo or search targeted on street, postal code and property characteristics.
View the current housing stock in Groenlo and quickly filter by price, living area, rooms and more. There are currently 153 houses in this place within our selection. View also 112 sold houses in Groenlo for extra insight into the local housing market.
7141DR Groenlo
€ 397.500 k.k.
€ 2.723/m²
7141XL Groenlo
€ 325.000 k.k.
€ 3.009/m²
7141EP Groenlo
€ 169.000 k.k.
€ 3.596/m²
7141NS Groenlo
€ 485.000 k.k.
€ 3.464/m²
7141DE Groenlo
€ 650.000 k.k.
€ 4.221/m²
7141NK Groenlo
€ 365.000 k.k.
€ 3.093/m²
7142HW Groenlo
€ 650.000 k.k.
€ 2.590/m²
7141EN Groenlo
€ 249.012 k.k.
€ 2.515/m²
7141VM Groenlo
€ 415.000 k.k.
€ 3.242/m²
7141TC Groenlo
€ 399.000 k.k.
€ 3.244/m²
7141XN Groenlo
€ 395.000 k.k.
€ 4.341/m²
7141VS Groenlo
€ 295.000 k.k.
€ 2.810/m²
7141RE Groenlo
€ 347.500 k.k.
€ 2.780/m²
7141WK Groenlo
€ 285.000 k.k.
€ 3.519/m²
7141KG Groenlo
€ 319.000 k.k.
7141TV Groenlo
€ 250.000 k.k.
€ 2.660/m²
7141CE Groenlo
€ 398.018 k.k.
€ 3.373/m²
7141DD Groenlo
€ 985.000 k.k.
€ 3.924/m²
7141EN Groenlo
€ 385.000 k.k.
€ 3.291/m²
7141EN Groenlo
€ 326.000 k.k.
€ 3.396/m²
7141EN Groenlo
€ 330.000 k.k.
€ 3.438/m²
7141EN Groenlo
€ 329.000 k.k.
€ 3.357/m²
7141EE Groenlo
€ 450.000
€ 4.592/m²
7141BS Groenlo
€ 985.000 k.k.
€ 3.648/m²
7141BX Groenlo
€ 425.000 k.k.
€ 3.269/m²
7141PB Groenlo
€ 349.032 k.k.
€ 3.144/m²
7141KZ Groenlo
€ 349.000 k.k.
7141LK Groenlo
€ 900.000 k.k.
Get free quotes from real estate agents with local market knowledge. Compare more than 15 real estate agents in Groenlo.
Selling a home in Groenlo? Compare all real estate agents in Groenlo or view the top 10 real estate agents in Groenlo for extra context for your choice.
Real estate agents make sharper offers when they know you're comparing — ask for quotes for sale or purchase.
Practical answers about housing supply, sales and comparing real estate agents in Groenlo.
The costs of a real estate agent in Groenlo depend on commission, setup costs, property presentation and the chosen service. Compare the 15 real estate agents in Groenlo via the real estate agent page and request multiple quotes to compare rates and approach well.
Within our selection, we are currently showing 153 houses in Groenlo. View also the sold houses in Groenlo to compare the current offering with recent transactions.
Take into account not only price and living area but also maintenance, energy label, location, outdoor space and sales status. This way you compare houses in Groenlo on more than just the asking price.
A local real estate agent knows the neighborhoods, recent transactions and demand in Groenlo. By comparing 15 real estate agents in the region you get a better insight into prices, sales strategy and expected yield; the top 10 in Groenlo provides a useful starting point.
Yes, when making a sales plan, a valuation in Groenlo is wise. You gain insight into a realistic asking price and can then compare offers from real estate agents specifically.
View current location data on residents, WOZ development, housing stock, energy consumption, business activity and safety in Groenlo. In 2026 were there 10.032 residents. The average WOZ value in 2025 is EUR 314.000.
These figures help to better assess and compare the housing stock in Groenlo with recent sold homes. Orient yourself then on suitable top real estate agents in Groenlo for sales advice in this region.
Residents
10.032
Last year: 2026
Average WOZ
EUR 314.000
Last year: 2025
Average income per person.
EUR 33.200
Source: AllNumbers
Crimes (current year)
207
Total registered
| Year | Residents |
|---|---|
| 2021 | 9.860 |
| 2022 | 9.920 |
| 2023 | 10.030 |
| 2024 | 10.075 |
| 2025 | 10.080 |
| 2026 | 10.032 |
| Year | Average WOZ |
|---|---|
| 2021 | EUR 222.000 |
| 2022 | EUR 236.000 |
| 2023 | EUR 264.000 |
| 2024 | EUR 280.000 |
| 2025 | EUR 314.000 |
Hoger
2.320
Praktisch
1.750
Middelbaar
3.460
Europa
785
Nederland
8.650
Buiten Europa
645
Label C
1.391
Label A
1.002
Label B
856
Label D
532
Label G
372
Label F
361
Label E
289
Label A+++
54
Label A++
42
Label A+
28
Label A++++
13
Label A+++++
1
| Year | Gas (m3) | Electricity (kWh) |
|---|---|---|
| 2020 | 1.300 | 3.010 |
| 2021 | 1.450 | 3.040 |
| 2022 | 1.130 | 2.840 |
| 2023 | 930 | 2.730 |
| 2024 | 900 | 2.820 |
Hoekwoning
Gas: 910 • Electricity: 2.580
Huurwoning
Gas: 770 • Electricity: 2.050
Koopwoning
Gas: 980 • Electricity: 2.970
Appartement
Gas: 690 • Electricity: 1.960
Tussenwoning
Gas: 850 • Electricity: 2.450
Vrijstaande woning
Gas: 1.240 • Electricity: 3.850
Twee-onder-één-kap woning
Gas: 960 • Electricity: 2.870
Total number of company establishments: 1.120
| Period | Crimes |
|---|---|
| jan 2026 | 14 |
| jul 2025 | 15 |
| jun 2025 | 14 |
| mei 2025 | 16 |
| mrt 2025 | 19 |
| mrt 2026 | 17 |
| nov 2024 | 23 |
| nov 2025 | 13 |
| okt 2024 | 20 |
| okt 2025 | 32 |
| sep 2024 | 22 |
| sep 2025 | 22 |
These figures give an indicative picture of safety trends in the living environment of Groenlo.
Short answers based on current local statistics, handy for a quick comparison of the living environment.
Groenlo telt in 2026 ongeveer 10.032 inwoners.
De gemiddelde WOZ-waarde in Groenlo is in 2025 circa € 314.000.
Het gemiddelde inkomen per inwoner in Groenlo ligt rond € 33.200 per jaar.
Voor het huidige jaar gaat het om ongeveer 207 geregistreerde misdrijven. Gebruik deze cijfers als indicatie en vergelijk trends per periode.
In Groenlo komt vooral "Tussenwoningen" veel voor, met ongeveer 1.247 woningen.