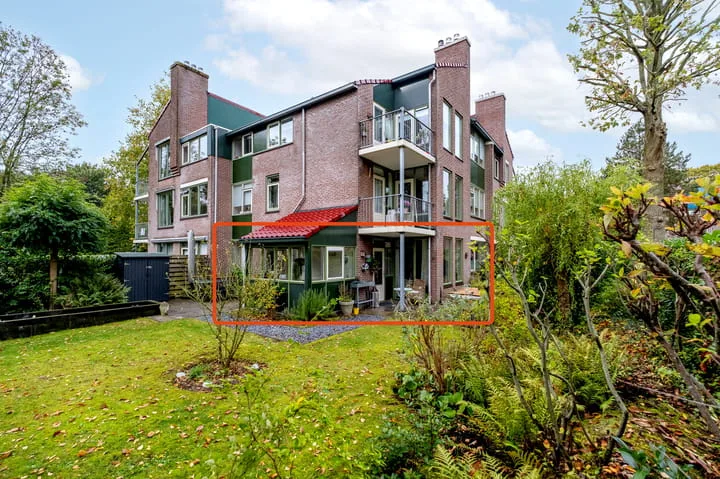
- Sold
Coendersweg 69
9722GD Groningen
€ 315.000 k.k.
€ 4.500/m²
- Living area
- 70 m²
- Land area
- —
- Bedrooms
- 3
View 2.463 sold houses in Groningen
Type to search. Use arrow down and arrow up to navigate through results and press Enter to open.
Hidden search suggestions.
Compare sold homes in Groningen or view the current offering in this location directly.
On this page you will find recently sold homes in Groningen. Use this overview to better estimate selling prices, popular neighborhoods, and the local housing supply before you choose a real estate agent. Also view the current housing supply with 3.231 houses in Groningen.
9722GD Groningen
€ 315.000 k.k.
€ 4.500/m²
9732CJ Groningen
€ 215.000 k.k.
€ 2.905/m²
9713BA Groningen
€ 225.000 k.k.
€ 3.879/m²
9727EG Groningen
€ 299.000 k.k.
€ 4.152/m²
9731DW Groningen
€ 469.000 k.k.
€ 3.813/m²
9722CA Groningen
€ 345.000 k.k.
€ 3.670/m²
9721LL Groningen
€ 275.000 k.k.
€ 3.716/m²
9746AM Groningen
€ 350.000 k.k.
€ 3.684/m²
9712PS Groningen
€ 745.000 k.k.
€ 2.699/m²
9743JV Groningen
€ 450.000 k.k.
€ 3.782/m²
9734CA Groningen
€ 395.000 k.k.
€ 4.340/m²
9733GH Groningen
€ 375.000 k.k.
€ 3.099/m²
9711LT Groningen
€ 235.000 k.k.
€ 4.051/m²
9713LZ Groningen
€ 239.500 k.k.
€ 3.742/m²
9728RH Groningen
€ 249.000 k.k.
€ 3.661/m²
9722BK Groningen
€ 225.000 k.k.
€ 3.409/m²
9721ZL Groningen
€ 300.000 k.k.
€ 4.000/m²
9725HB Groningen
€ 264.500 k.k.
€ 3.306/m²
9714AK Groningen
€ 359.000 k.k.
€ 4.487/m²
9722KM Groningen
€ 259.000 k.k.
€ 2.846/m²
9713PP Groningen
€ 265.000 k.k.
€ 3.630/m²
9716BA Groningen
€ 209.000 k.k.
€ 4.180/m²
9733GA Groningen
€ 415.000 k.k.
€ 3.373/m²
9744AG Groningen
€ 385.000 k.k.
€ 3.500/m²
9737LM Groningen
€ 360.000 k.k.
€ 3.564/m²
9722BV Groningen
€ 450.000 k.k.
€ 3.781/m²
9742RG Groningen
€ 395.000 k.k.
€ 3.950/m²
9721BJ Groningen
€ 425.000 k.k.
€ 4.292/m²
Bekijk recente verkopen en ontvang gratis offertes van lokale verkoopmakelaars in Groningen.
Recent verkocht in Groningen? Lees de verkoopgerichte gids huis verkopen in Groningen, vergelijk verkoopmakelaars in Groningen of bekijk de beste verkoopmakelaars in Groningen voor referentie bij jouw keuze.
Makelaars maken scherpere voorstellen als ze weten dat je vergelijkt — vraag offertes aan voor verkoop of aankoop.
Short answers about housing prices, sold homes and comparing real estate agents in Groningen.
The costs of a real estate agent in Groningen vary per office, property type and sales approach. Therefore, compare multiple quotes and also look at the real estate agents in Groningen to better compare rates, presentation and local experience.
On this page we currently show 2.463 sold houses in Groningen from our selection. This helps you to better assess recent transactions and the local housing market.
Houses sold in Groningen give insight into asking prices, house types and neighborhoods where recent transactions have taken place. Compare this also with the current housing stock in Groningen to better understand the market.
Je kunt verkochte woningen gebruiken als eerste marktindicatie, maar een lokale makelaar kan beter rekening houden met afwerking, ligging, onderhoud en actuele vraag in Groningen. Plan de volgende stap via de gids huis verkopen in Groningen.
Vergelijk makelaars in Groningen op lokale verkoopervaring, reviews, verwachte opbrengst, courtage en marketingaanpak. Bekijk verkoopmakelaars in Groningen of de top 10 makelaars in Groningen om snel sterke kantoren te ontdekken.
View current location data on residents, WOZ development, housing stock, energy consumption, business activity and safety in Groningen. In 2025 were there 211.700 residents. The average WOZ value in 2025 is EUR 293.695.
These figures help to better assess and compare the housing stock in Groningen with recent sold homes. Orient yourself then on suitable top real estate agents in Groningen for sales advice in this region.
Residents
211.700
Last year: 2025
Average WOZ
EUR 293.695
Last year: 2025
Average income per person.
EUR 30.848
Source: AllNumbers
Crimes (current year)
14.334
Total registered
| Year | Residents |
|---|---|
| 2021 | 202.905 |
| 2022 | 203.955 |
| 2023 | 206.010 |
| 2024 | 211.120 |
| 2025 | 211.700 |
| Year | Average WOZ |
|---|---|
| 2021 | EUR 212.933 |
| 2022 | EUR 237.307 |
| 2023 | EUR 278.911 |
| 2024 | EUR 282.292 |
| 2025 | EUR 293.695 |
Hoger
78.440
Praktisch
27.960
Middelbaar
70.780
Europa
25.770
Nederland
144.365
Buiten Europa
41.575
Label A
35.130
Label C
23.443
Label B
16.569
Label D
8.436
Label E
6.737
Label G
5.153
Label A+
4.522
Label F
4.407
Label A+++
3.164
Label A++
2.391
Label A++++
461
Label A+++++
31
| Year | Gas (m3) | Electricity (kWh) |
|---|---|---|
| 2020 | 1.018 | 2.119 |
| 2021 | 1.125 | 2.152 |
| 2022 | 877 | 2.017 |
| 2023 | 746 | 1.905 |
| 2024 | 721 | 1.921 |
Hoekwoning
Gas: 1.032 • Electricity: 2.369
Huurwoning
Gas: 677 • Electricity: 1.728
Koopwoning
Gas: 872 • Electricity: 2.183
Appartement
Gas: 630 • Electricity: 1.651
Tussenwoning
Gas: 894 • Electricity: 2.209
Vrijstaande woning
Gas: 1.448 • Electricity: 3.256
Twee-onder-één-kap woning
Gas: 1.159 • Electricity: 2.635
Total number of company establishments: 27.345
| Period | Crimes |
|---|---|
| jan 2025 | 1.088 |
| jan 2026 | 1.104 |
| jul 2025 | 1.142 |
| jun 2025 | 1.229 |
| mei 2025 | 1.195 |
| mrt 2025 | 1.166 |
| nov 2024 | 1.246 |
| nov 2025 | 1.266 |
| okt 2024 | 1.436 |
| okt 2025 | 1.390 |
| sep 2024 | 1.231 |
| sep 2025 | 1.275 |
These figures give an indicative picture of safety trends in the living environment of Groningen.
Short answers based on current local statistics, handy for a quick comparison of the living environment.
Groningen telt in 2025 ongeveer 211.700 inwoners.
De gemiddelde WOZ-waarde in Groningen is in 2025 circa € 293.695.
Het gemiddelde inkomen per inwoner in Groningen ligt rond € 30.848 per jaar.
Voor het huidige jaar gaat het om ongeveer 14.334 geregistreerde misdrijven. Gebruik deze cijfers als indicatie en vergelijk trends per periode.
In Groningen komt vooral "Appartementen" veel voor, met ongeveer 76.656 woningen.