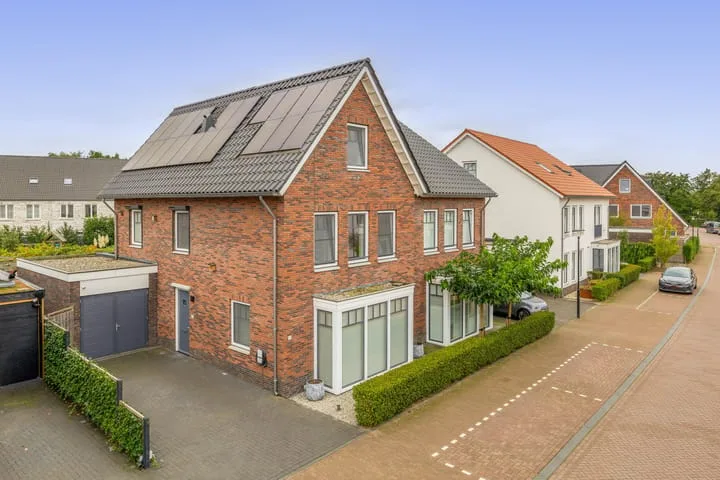
- Sold
Spakenburgpad 20
3844JP Harderwijk
€ 465.000 k.k.
€ 3.940/m²
- Living area
- 118 m²
- Land area
- 144 m²
- Bedrooms
- 4
View 433 sold houses in Harderwijk
Type to search. Use arrow down and arrow up to navigate through results and press Enter to open.
Hidden search suggestions.
Compare sold homes in Harderwijk or view the current offering in this location directly.
On this page you will find recently sold homes in Harderwijk. Use this overview to better estimate selling prices, popular neighborhoods, and the local housing supply before you choose a real estate agent. Also view the current housing supply with 645 houses in Harderwijk.
3844JP Harderwijk
€ 465.000 k.k.
€ 3.940/m²
3843VB Harderwijk
€ 415.000 k.k.
€ 4.068/m²
3847LL Harderwijk
Price upon request
3847LL Harderwijk
Price upon request
3841CM Harderwijk
€ 439.000 k.k.
€ 5.556/m²
3841DP Harderwijk
€ 469.000 k.k.
€ 3.941/m²
3841EV Harderwijk
€ 300.000 k.k.
€ 6.000/m²
3846JB Harderwijk
€ 600.000 k.k.
€ 4.255/m²
3845HP Harderwijk
€ 579.000 k.k.
€ 4.632/m²
3843JR Harderwijk
€ 585.000 k.k.
€ 5.679/m²
3844RM Harderwijk
€ 439.500 k.k.
€ 4.675/m²
3842LN Harderwijk
€ 439.500 k.k.
€ 4.225/m²
3844NC Harderwijk
€ 589.000 k.k.
€ 3.681/m²
3845KL Harderwijk
€ 1.150.000 k.k.
€ 4.474/m²
3841KG Harderwijk
€ 399.000 k.k.
€ 3.594/m²
3844PS Harderwijk
€ 415.000 k.k.
€ 3.738/m²
3845KM Harderwijk
€ 835.000 k.k.
€ 4.513/m²
3841EN Harderwijk
€ 325.000 k.k.
€ 5.701/m²
3843GV Harderwijk
€ 399.000 k.k.
€ 3.800/m²
3841BL Harderwijk
€ 419.000 k.k.
€ 4.655/m²
3844BE Harderwijk
€ 475.000 k.k.
€ 3.740/m²
3843BE Harderwijk
€ 639.000 k.k.
€ 4.437/m²
3845HD Harderwijk
€ 485.000 k.k.
€ 4.145/m²
3843EX Harderwijk
€ 350.000 k.k.
€ 4.022/m²
3842AH Harderwijk
€ 275.000 k.k.
€ 5.978/m²
3846JV Harderwijk
€ 625.000 k.k.
€ 5.841/m²
3844CK Harderwijk
€ 485.000 k.k.
€ 3.789/m²
3842CH Harderwijk
€ 475.000 k.k.
€ 4.318/m²
Get free quotes from realtors with local market knowledge in Harderwijk.
Selling a home in Harderwijk? Compare real estate agents who know the local housing market. Also check out all real estate agents in Harderwijk or the top 10 real estate agents in Harderwijk for extra context for your choice.
By comparing brokers and requesting quotes
Short answers about housing prices, sold homes and comparing real estate agents in Harderwijk.
The costs of a real estate agent in Harderwijk vary per office, property type and sales approach. Therefore, compare multiple quotes and also look at the real estate agents in Harderwijk to better compare rates, presentation and local experience.
On this page we currently show 433 sold houses in Harderwijk from our selection. This helps you to better assess recent transactions and the local housing market.
Houses sold in Harderwijk give insight into asking prices, house types and neighborhoods where recent transactions have taken place. Compare this also with the current housing stock in Harderwijk to better understand the market.
You can use sold homes as a first market indication, but a local real estate agent can better take into account finishing, location, maintenance and current demand in Harderwijk.
Compare realtors in Harderwijk on local sales experience, reviews, expected yield, commission and marketing approach. The top 10 realtors in Harderwijk helps to quickly discover strong offices.
View current location data on residents, WOZ development, housing stock, energy consumption, business activity and safety in Harderwijk. In 2025 were there 46.495 residents. The average WOZ value in 2025 is EUR 393.126.
These figures help to better assess and compare the housing stock in Harderwijk with recent sold homes. Orient yourself then on suitable top real estate agents in Harderwijk for sales advice in this region.
Residents
46.495
Last year: 2025
Average WOZ
EUR 393.126
Last year: 2025
Average income per person.
EUR 24.263
Source: AllNumbers
Crimes (current year)
1.923
Total registered
| Year | Residents |
|---|---|
| 2021 | 45.480 |
| 2022 | 45.510 |
| 2023 | 45.475 |
| 2024 | 45.945 |
| 2025 | 46.495 |
| Year | Average WOZ |
|---|---|
| 2021 | EUR 280.664 |
| 2022 | EUR 309.114 |
| 2023 | EUR 370.493 |
| 2024 | EUR 380.488 |
| 2025 | EUR 393.126 |
Hoger
10.320
Praktisch
9.490
Middelbaar
14.510
Europa
2.465
Nederland
36.280
Buiten Europa
7.765
Label A
6.906
Label C
4.968
Label B
3.569
Label D
1.386
Label E
1.239
Label F
910
Label A+
725
Label G
585
Label A+++
511
Label A++
437
Label A++++
420
Label A+++++
9
| Year | Gas (m3) | Electricity (kWh) |
|---|---|---|
| 2020 | 1.080 | 2.693 |
| 2021 | 1.224 | 2.720 |
| 2022 | 959 | 2.553 |
| 2023 | 819 | 2.433 |
| 2024 | 785 | 2.472 |
Hoekwoning
Gas: 985 • Electricity: 2.736
Huurwoning
Gas: 679 • Electricity: 1.969
Koopwoning
Gas: 932 • Electricity: 2.760
Appartement
Gas: 580 • Electricity: 1.845
Tussenwoning
Gas: 851 • Electricity: 2.475
Vrijstaande woning
Gas: 1.386 • Electricity: 4.020
Twee-onder-één-kap woning
Gas: 1.076 • Electricity: 3.210
Total number of company establishments: 6.060
| Period | Crimes |
|---|---|
| jan 2025 | 124 |
| jan 2026 | 144 |
| jul 2025 | 138 |
| jun 2025 | 149 |
| mei 2025 | 165 |
| mrt 2025 | 259 |
| nov 2024 | 146 |
| nov 2025 | 186 |
| okt 2024 | 142 |
| okt 2025 | 185 |
| sep 2024 | 169 |
| sep 2025 | 148 |
These figures give an indicative picture of safety trends in the living environment of Harderwijk.
Short answers based on current local statistics, handy for a quick comparison of the living environment.
Harderwijk telt in 2025 ongeveer 46.495 inwoners.
De gemiddelde WOZ-waarde in Harderwijk is in 2025 circa € 393.126.
Het gemiddelde inkomen per inwoner in Harderwijk ligt rond € 24.263 per jaar.
Voor het huidige jaar gaat het om ongeveer 1.923 geregistreerde misdrijven. Gebruik deze cijfers als indicatie en vergelijk trends per periode.
In Harderwijk komt vooral "Tussenwoningen" veel voor, met ongeveer 8.068 woningen.