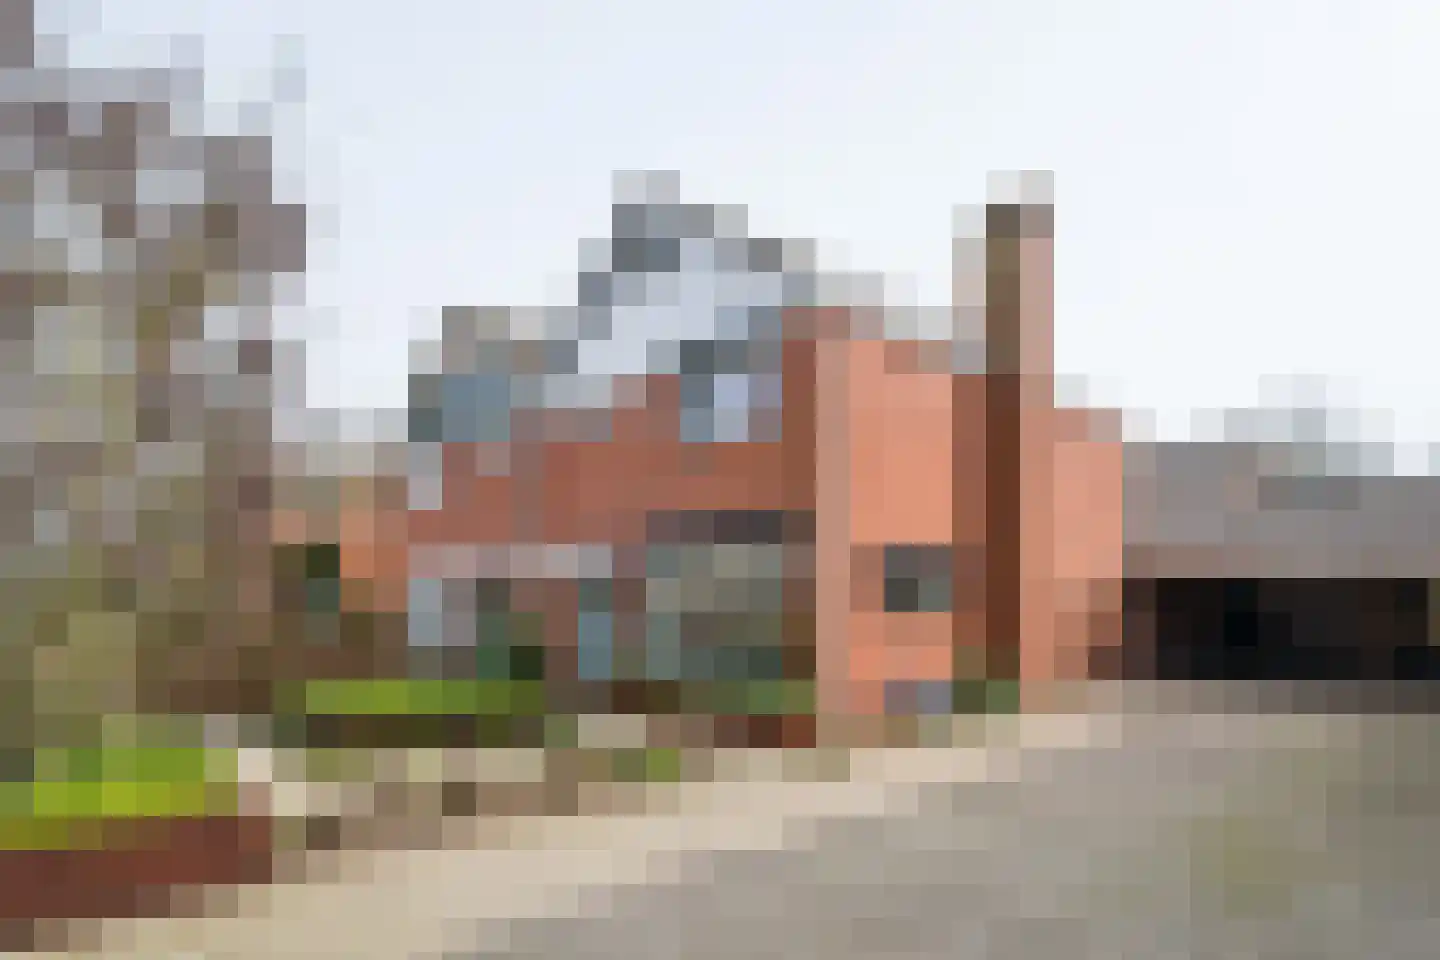
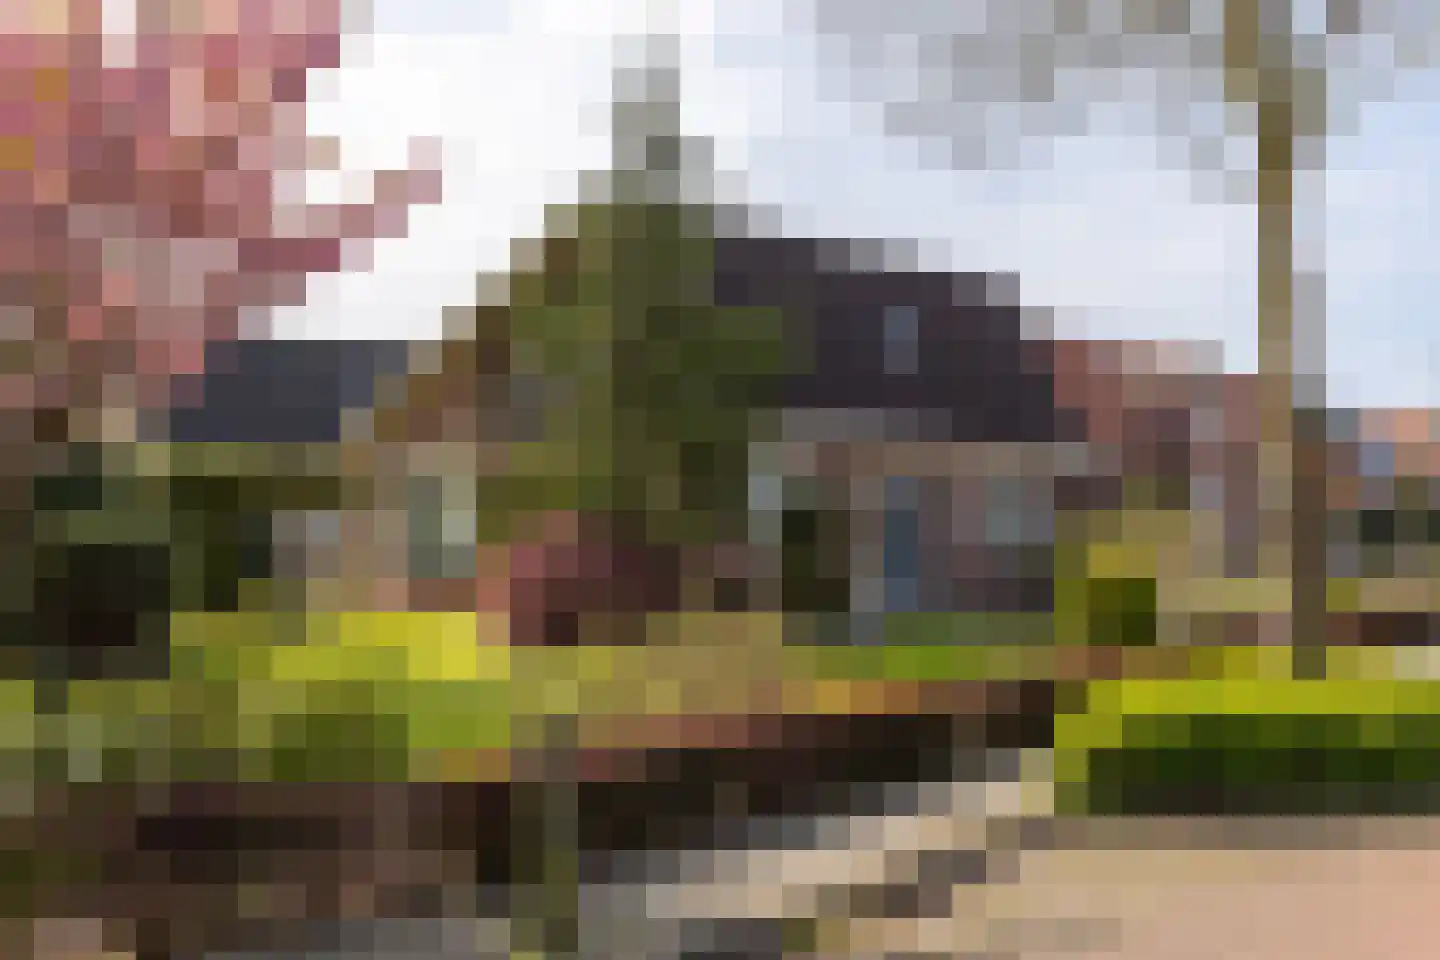
- Available
Toebeshof 10
7135JN Harreveld
€ 400.000 k.k.
€ 3.509/m²
- Living area
- 114 m²
- Land area
- 507 m²
- Bedrooms
- 3
Searching in 15 houses in Harreveld
Type to search. Use arrow down and arrow up to navigate through results and press Enter to open.
Hidden search suggestions.
View current properties in Harreveld or search targeted on street, postal code and property characteristics.
View the current housing stock in Harreveld and quickly filter by price, living area, rooms and more. There are currently 15 houses in this place within our selection. View also 14 sold houses in Harreveld for extra insight into the local housing market.
7135JN Harreveld
€ 400.000 k.k.
€ 3.509/m²
7135JH Harreveld
€ 399.000 k.k.
€ 3.046/m²
7135JV Harreveld
€ 399.000 k.k.
€ 3.594/m²
7135KR Harreveld
€ 379.000 k.k.
€ 2.325/m²
7135JD Harreveld
€ 345.000 k.k.
€ 3.224/m²
7135JM Harreveld
€ 179.000 k.k.
€ 3.254/m²
7135TZ Harreveld
€ 300.000 k.k.
€ 3.260/m²
7135KH Harreveld
€ 435.000 k.k.
€ 1.891/m²
7135JN Harreveld
€ 395.000 k.k.
€ 3.834/m²
7135TX Harreveld
€ 474.040 k.k.
€ 3.460/m²
7135KC Harreveld
€ 597.500 k.k.
€ 5.481/m²
7135JN Harreveld
€ 175.000 k.k.
€ 2.108/m²
7135KC Harreveld
€ 674.007 k.k.
€ 0/m²
7135KG Harreveld
€ 395.000 k.k.
€ 2.801/m²
7135KH Harreveld
€ 1.100.000 k.k.
€ 3.618/m²
Get free quotes from real estate agents with local market knowledge. Compare more than 15 real estate agents in Harreveld.
Selling a home in Harreveld? Compare all real estate agents in Harreveld or view the top 10 real estate agents in Harreveld for extra context for your choice.
Real estate agents make sharper offers when they know you're comparing — ask for quotes for sale or purchase.
Practical answers about housing supply, sales and comparing real estate agents in Harreveld.
The costs of a real estate agent in Harreveld depend on commission, setup costs, property presentation and the chosen service. Compare the 15 real estate agents in Harreveld via the real estate agent page and request multiple quotes to compare rates and approach well.
Within our selection, we are currently showing 15 houses in Harreveld. View also the sold houses in Harreveld to compare the current offering with recent transactions.
Take into account not only price and living area but also maintenance, energy label, location, outdoor space and sales status. This way you compare houses in Harreveld on more than just the asking price.
A local real estate agent knows the neighborhoods, recent transactions and demand in Harreveld. By comparing 15 real estate agents in the region you get a better insight into prices, sales strategy and expected yield; the top 10 in Harreveld provides a useful starting point.
Yes, when making a sales plan, a valuation in Harreveld is wise. You gain insight into a realistic asking price and can then compare offers from real estate agents specifically.
View current location data on residents, WOZ development, housing stock, energy consumption, business activity and safety in Harreveld. In 2025 were there 1.305 residents. The average WOZ value in 2025 is EUR 382.000.
These figures help to better assess and compare the housing stock in Harreveld with recent sold homes. Orient yourself then on suitable top real estate agents in Harreveld for sales advice in this region.
Residents
1.305
Last year: 2025
Average WOZ
EUR 382.000
Last year: 2025
Average income per person.
EUR 32.000
Source: AllNumbers
Crimes (current year)
32
Total registered
| Year | Residents |
|---|---|
| 2021 | 1.415 |
| 2022 | 1.370 |
| 2023 | 1.360 |
| 2024 | 1.345 |
| 2025 | 1.305 |
| Year | Average WOZ |
|---|---|
| 2021 | EUR 275.000 |
| 2022 | EUR 285.000 |
| 2023 | EUR 319.000 |
| 2024 | EUR 336.000 |
| 2025 | EUR 382.000 |
Hoger
270
Praktisch
200
Middelbaar
550
Europa
45
Nederland
1.230
Buiten Europa
30
Label C
132
Label F
72
Label G
66
Label A
62
Label B
55
Label D
50
Label A+++
17
Label E
16
Label A+
10
Label A++++
7
Label A++
4
Label A+++++
0
| Year | Gas (m3) | Electricity (kWh) |
|---|---|---|
| 2020 | 1.600 | 3.760 |
| 2021 | 1.760 | 3.760 |
| 2022 | 1.350 | 3.440 |
| 2023 | 1.060 | 3.390 |
| 2024 | 1.010 | 3.420 |
Hoekwoning
Gas: 910 • Electricity: 2.640
Huurwoning
Gas: 1.120 • Electricity: 2.790
Koopwoning
Gas: 1.050 • Electricity: 3.480
Appartement
Gas: 1.150 • Electricity: 3.420
Tussenwoning
Gas: 720 • Electricity: 2.410
Vrijstaande woning
Gas: 1.190 • Electricity: 3.840
Twee-onder-één-kap woning
Gas: 990 • Electricity: 3.200
Total number of company establishments: 195
| Period | Crimes |
|---|---|
| jan 2025 | 3 |
| jan 2026 | 0 |
| jul 2025 | 3 |
| jun 2025 | 4 |
| mei 2025 | 6 |
| mrt 2025 | 4 |
| nov 2024 | 1 |
| nov 2025 | 0 |
| okt 2024 | 2 |
| okt 2025 | 2 |
| sep 2024 | 7 |
| sep 2025 | 3 |
These figures give an indicative picture of safety trends in the living environment of Harreveld.
Short answers based on current local statistics, handy for a quick comparison of the living environment.
Harreveld telt in 2025 ongeveer 1.305 inwoners.
De gemiddelde WOZ-waarde in Harreveld is in 2025 circa € 382.000.
Het gemiddelde inkomen per inwoner in Harreveld ligt rond € 32.000 per jaar.
Voor het huidige jaar gaat het om ongeveer 32 geregistreerde misdrijven. Gebruik deze cijfers als indicatie en vergelijk trends per periode.
In Harreveld komt vooral "Vrijstaande woningen" veel voor, met ongeveer 247 woningen.