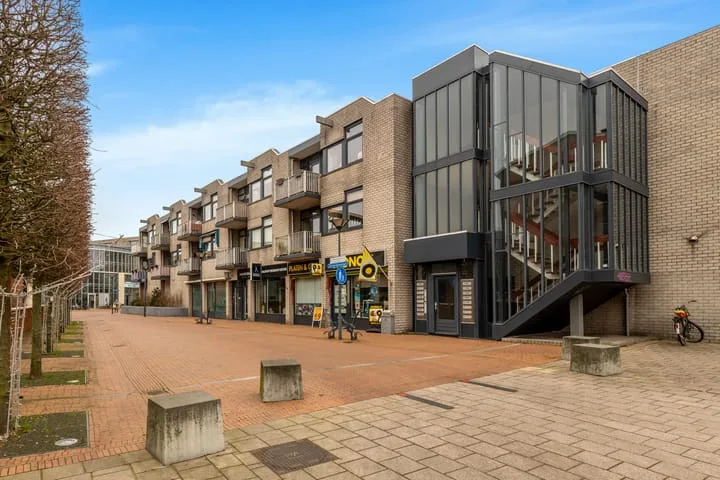
- Sold
Leeuwenburg 25
1965NN Heemskerk
€ 535.000 k.k.
€ 4.385/m²
- Living area
- 122 m²
- Land area
- 140 m²
- Bedrooms
- 4
View 306 sold houses in Heemskerk
Type to search. Use arrow down and arrow up to navigate through results and press Enter to open.
Hidden search suggestions.
Compare sold homes in Heemskerk or view the current offering in this location directly.
On this page you will find recently sold homes in Heemskerk. Use this overview to better estimate selling prices, popular neighborhoods, and the local housing supply before you choose a real estate agent. Also view the current housing supply with 399 houses in Heemskerk.
1965NN Heemskerk
€ 535.000 k.k.
€ 4.385/m²
1966SC Heemskerk
€ 450.000 k.k.
€ 3.658/m²
1967GH Heemskerk
€ 395.000 k.k.
€ 5.129/m²
1964LR Heemskerk
€ 495.000 k.k.
€ 4.900/m²
1965GJ Heemskerk
€ 535.000 k.k.
€ 4.280/m²
1967JH Heemskerk
€ 650.000 k.k.
€ 3.651/m²
1962ED Heemskerk
€ 295.000 k.k.
€ 3.933/m²
1963AM Heemskerk
€ 795.000 k.k.
€ 5.638/m²
1965SK Heemskerk
€ 629.000 k.k.
€ 4.058/m²
1965BG Heemskerk
€ 445.000 k.k.
€ 4.734/m²
1961GJ Heemskerk
€ 625.000 k.k.
€ 6.188/m²
1965NX Heemskerk
€ 450.000 k.k.
€ 4.017/m²
1963RH Heemskerk
€ 440.000 k.k.
€ 3.793/m²
1967HG Heemskerk
€ 510.000 k.k.
€ 4.513/m²
1962XE Heemskerk
€ 495.000 k.k.
€ 4.230/m²
1961EX Heemskerk
€ 309.000 k.k.
€ 5.065/m²
1966WJ Heemskerk
€ 300.000 k.k.
€ 3.947/m²
1966RK Heemskerk
€ 475.000 k.k.
€ 3.861/m²
1963AM Heemskerk
€ 775.000 k.k.
€ 4.754/m²
1967GH Heemskerk
€ 435.000 k.k.
€ 4.780/m²
1964BR Heemskerk
€ 475.000 k.k.
€ 4.750/m²
1967HE Heemskerk
€ 650.000 k.k.
€ 3.757/m²
1964ES Heemskerk
€ 449.000 k.k.
€ 5.044/m²
1966WJ Heemskerk
€ 250.000 k.k.
€ 4.464/m²
1966MH Heemskerk
€ 299.000 k.k.
€ 3.602/m²
1965GK Heemskerk
€ 475.000 k.k.
€ 4.094/m²
1964TD Heemskerk
€ 525.000 k.k.
€ 4.268/m²
1961EB Heemskerk
€ 299.500 k.k.
€ 5.348/m²
View recent sales and receive free quotes from local real estate agents. Compare more than 60 real estate agents in Heemskerk.
Sold recently in Heemskerk? Read the sales-oriented guide sell your home in Heemskerk, compare sales agents in Heemskerk or view the top sales agents in Heemskerk for reference in your choice.
Real estate agents make sharper offers when they know you're comparing — ask for quotes for sale or purchase.
Short answers about housing prices, sold homes and comparing real estate agents in Heemskerk.
The costs of a real estate agent in Heemskerk vary per office, property type and sales approach. In Heemskerk you can compare 60 real estate agents; therefore also look at the real estate agents in Heemskerk to better compare fees, presentation and local experience.
On this page we currently show 306 sold houses in Heemskerk from our selection. This helps you to better assess recent transactions and the local housing market.
Houses sold in Heemskerk give insight into asking prices, house types and neighborhoods where recent transactions have taken place. Compare this also with the current housing stock in Heemskerk to better understand the market.
You can use sold homes as a first market indication, but a local real estate agent can better take into account finishing, location, maintenance and current demand in Heemskerk. Plan the next step via the guide selling a house in Heemskerk.
Compare the 60 real estate agents in Heemskerk on local sales experience, reviews, expected yield, commission and marketing approach. View real estate agents in Heemskerk or the top 10 agents in Heemskerk to quickly discover strong offices.
View current location data on residents, WOZ development, housing stock, energy consumption, business activity and safety in Heemskerk. In 2026 were there 39.532 residents. The average WOZ value in 2025 is EUR 412.000.
These figures help to better assess and compare the housing stock in Heemskerk with recent sold homes. Orient yourself then on suitable top real estate agents in Heemskerk for sales advice in this region.
Residents
39.532
Last year: 2026
Average WOZ
EUR 412.000
Last year: 2025
Average income per person.
EUR 34.600
Source: AllNumbers
Crimes (current year)
1.191
Total registered
| Year | Residents |
|---|---|
| 2022 | 39.189 |
| 2023 | 39.431 |
| 2024 | 39.452 |
| 2025 | 39.380 |
| 2026 | 39.532 |
| Year | Average WOZ |
|---|---|
| 2021 | EUR 307.000 |
| 2022 | EUR 339.000 |
| 2023 | EUR 402.000 |
| 2024 | EUR 402.000 |
| 2025 | EUR 412.000 |
Hoger
26
Praktisch
27
Middelbaar
46
Europa
2.759
Nederland
30.159
Buiten Europa
6.462
Label A
5.742
Label C
5.338
Label B
2.682
Label D
1.620
Label E
1.230
Label F
611
Label A+
465
Label G
393
Label A+++
376
Label A++
171
Label A++++
67
Label A+++++
2
| Year | Gas (m3) | Electricity (kWh) |
|---|---|---|
| 2020 | 1.080 | 2.620 |
| 2021 | 1.220 | 2.660 |
| 2022 | 940 | 2.470 |
| 2023 | 820 | 2.310 |
| 2024 | 790 | 2.340 |
Hoekwoning
Gas: 940 • Electricity: 2.580
Huurwoning
Gas: 680 • Electricity: 1.800
Koopwoning
Gas: 910 • Electricity: 2.660
Appartement
Gas: 610 • Electricity: 1.720
Tussenwoning
Gas: 830 • Electricity: 2.410
Vrijstaande woning
Gas: 1.370 • Electricity: 3.770
Twee-onder-één-kap woning
Gas: 1.130 • Electricity: 3.080
Total number of company establishments: 4.295
| Period | Crimes |
|---|---|
| jan 2025 | 116 |
| jan 2026 | 78 |
| jul 2025 | 116 |
| jun 2025 | 79 |
| mei 2025 | 98 |
| mrt 2025 | 98 |
| nov 2024 | 89 |
| nov 2025 | 73 |
| okt 2024 | 110 |
| okt 2025 | 86 |
| sep 2024 | 106 |
| sep 2025 | 146 |
These figures give an indicative picture of safety trends in the living environment of Heemskerk.
Short answers based on current local statistics, handy for a quick comparison of the living environment.
Heemskerk telt in 2026 ongeveer 39.532 inwoners.
De gemiddelde WOZ-waarde in Heemskerk is in 2025 circa € 412.000.
Het gemiddelde inkomen per inwoner in Heemskerk ligt rond € 34.600 per jaar.
Voor het huidige jaar gaat het om ongeveer 1.191 geregistreerde misdrijven. Gebruik deze cijfers als indicatie en vergelijk trends per periode.
In Heemskerk komt vooral "Tussenwoningen" veel voor, met ongeveer 7.192 woningen.