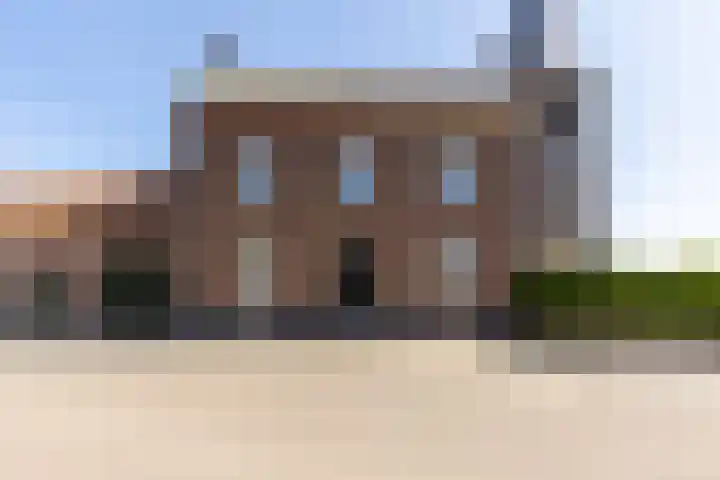
Houses sold in Jabeek

View 6 sold houses in Jabeek

Connected to: Vastgoed Nederland NVM Makelaars

On this page you will find recently sold homes in Jabeek. Use this overview to better estimate selling prices, popular neighborhoods, and the local housing supply before you choose a real estate agent. Also view the current housing supply with 11 houses in Jabeek.

Selection

Search and filter homes

Set your preferences and discover homes that suit you.

Total supply 242.695
Filters

Set price, area and other characteristics. Adjust a filter or click on Show homes. Location changes directly above.

Reset filters

You search for

  • Place Jabeek
  • Status Sold

Sell your house in Jabeek? Compare real estate agents

Bekijk recente verkopen en ontvang gratis offertes van lokale makelaars. Vergelijk meer dan 51 makelaars in Jabeek.

Free request a quote

  • Quotes in Jabeek
  • Non-binding
  • Personal
  • Compare free rates

Selling your own home in Jabeek? Compare real estate agents in Jabeek or view the best real estate agents in Jabeek as a reference for your choice.

Compare multiple quotes

Real estate agents make sharper offers when they know you're comparing — ask for quotes for sale or purchase.

Frequently asked questions about sold homes in Jabeek

Short answers about housing prices, sold homes and comparing real estate agents in Jabeek.

Residential and neighborhood statistics in Jabeek

View current location data on residents, WOZ development, housing stock, energy consumption, business activity and safety in Jabeek. In 2026 were there 711 residents. The average WOZ value in 2025 is EUR 319.000.

These figures help to better assess and compare the housing stock in Jabeek with recent sold homes. Orient yourself then on suitable top real estate agents in Jabeek for sales advice in this region.

Residents

711

Last year: 2026

Average WOZ

EUR 319.000

Last year: 2025

Average income per person.

EUR 31.800

Source: AllNumbers

Crimes (current year)

22

Total registered

Demographics and WOZ development

Inhabitants per year

Inhabitants per year in Jabeek
Year Residents
2021 700
2022 710
2023 710
2024 720
2025 715
2026 711

Annual WOZ value

WOZ value per year in Jabeek
Year Average WOZ
2021 EUR 239.000
2022 EUR 256.000
2023 EUR 291.000
2024 EUR 295.000
2025 EUR 319.000

Composition of residents

Age build-up

65+: 180 0-15: 75 15-25: 40 25-45: 145 45-65: 225

Education level

Hoger

180

Praktisch

170

Middelbaar

210

Origin of residents (2025)

Europa

110

Nederland

575

Buiten Europa

30

Housing stock and construction periods

Types of homes

Hoekwoningen 49
Appartementen 16
Tussenwoningen 44
Vrijstaande woningen 98
Twee-onder-één-kap woningen 129

Construction period of buildings

Voor 1700 0
1700 tot 1900 35
1900 tot 1925 18
1925 tot 1950 33
1950 tot 1970 92
1970 tot 1980 85
1980 tot 1990 37
1990 tot 2000 25
2000 tot 2010 13
2010 tot 2020 4
2020 en later 3

Energy and sustainability

Energy label distribution

Label C

74

Label G

57

Label B

53

Label D

47

Label A

41

Label F

35

Label E

18

Label A+

0

Label A++

0

Label A+++

0

Label A++++

0

Label A+++++

0

Average energy consumption per year

Average energy consumption per year in Jabeek
Year Gas (m3) Electricity (kWh)
2020 1.570 3.460
2021 1.790 3.550
2022 1.370 3.370
2023 1.090 3.340
2024 1.080 3.300

Consumption per house type

Hoekwoning

Gas: 1.140 • Electricity: 3.380

Huurwoning

Gas: 840 • Electricity: 2.570

Koopwoning

Gas: 1.160 • Electricity: 3.550

Appartement

Gas: 580 • Electricity: 2.040

Tussenwoning

Gas: 960 • Electricity: 2.910

Vrijstaande woning

Gas: 1.340 • Electricity: 4.210

Twee-onder-één-kap woning

Gas: 1.010 • Electricity: 3.030

Business activity in Jabeek (2025)

Handel en HORECA 10
Nijverheid en energie 10
Zakelijke dienstverlening 20
Overheid, onderwijs en zorg 15
Landbouw, bosbouw en visserij 5
Vervoer, informatie en communicatie 0
Financiele diensten en onroerendgoed 5
Cultuur, recreatie en overige diensten 10

Total number of company establishments: 75

Recent crime statistics

Recent crime statistics in Jabeek
Period Crimes
jan 2026 1
jul 2025 5
jun 2025 2
mei 2025 3
mrt 2025 1
mrt 2026 1
nov 2024 4
nov 2025 3
okt 2024 3
okt 2025 3
sep 2024 6
sep 2025 0

These figures give an indicative picture of safety trends in the living environment of Jabeek.

Frequently asked questions about living in Jabeek

Short answers based on current local statistics, handy for a quick comparison of the living environment.

Hoeveel inwoners heeft Jabeek?

Jabeek telt in 2026 ongeveer 711 inwoners.

Wat is de gemiddelde WOZ-waarde in Jabeek?

De gemiddelde WOZ-waarde in Jabeek is in 2025 circa € 319.000.

Wat is het gemiddelde inkomen per inwoner in Jabeek?

Het gemiddelde inkomen per inwoner in Jabeek ligt rond € 31.800 per jaar.

Hoe veilig is wonen in Jabeek?

Voor het huidige jaar gaat het om ongeveer 22 geregistreerde misdrijven. Gebruik deze cijfers als indicatie en vergelijk trends per periode.

Welke woningtypen komen het meest voor in Jabeek?

In Jabeek komt vooral "Twee-onder-één-kap woningen" veel voor, met ongeveer 129 woningen.

Receive free, non-binding quotes

Compare multiple real estate agents and choose the best match.